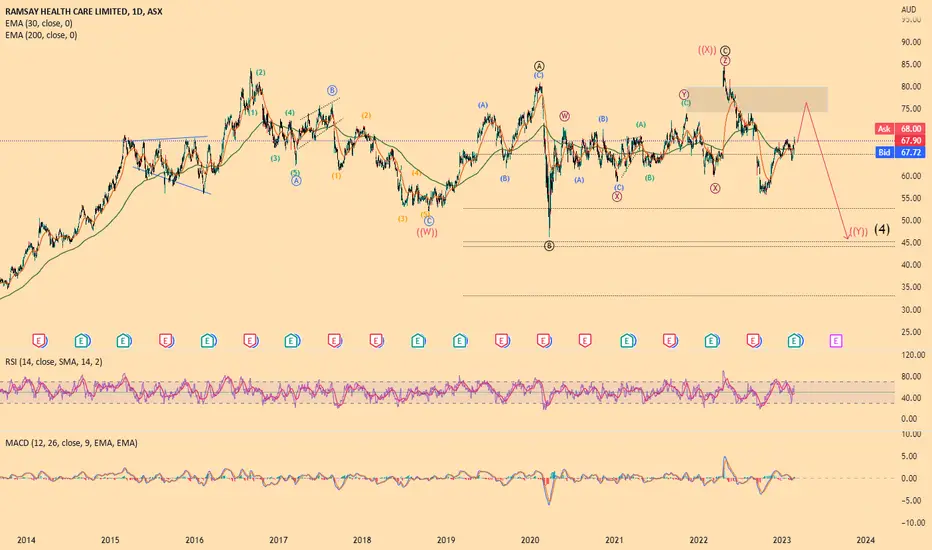
Dead Cat or Last Breath? RHC’s Pivot Trap LoomsRHC is sitting at a pivotal moment. For the bullish case to stay alive, we need to see price swiftly reclaim and close above ~$43 — that’s the line in the sand.
However, I’m leaning toward Scenario 1, which suggests a short-term push up to the yearly pivot and macro 50% retracement level, followed
3,918.18
0.00 USD
15.54 M USD
11.53 B USD
About Ramsay Health Care Limited
Sector
Industry
CEO
Natalie Davis
Website
Headquarters
Sydney
Founded
1975
ISIN
US75158L1052
FIGI
BBG008DV0552
Ramsay Health Care Ltd. engages in the healthcare services and the operation of hospitals and day surgery facilities. It operates through the following geographical segments : Asia Pacific, UK, France and Nordics. The company was founded by Paul Joseph Ramsay in 1964 and is headquartered in Sydney, Australia.
Related stocks

Simple Technical Stock Analysis for ASX Blue Chip Stock RHCSimple Technical Stock Analysis for ASX Blue Chip Stock RHC (Ramsay Health Care).
Market Monkey ASX Top 50 #41 for June 2024.
This week, the Team unpacks some simple technical and trend indicators for ASX Blue Chip Stock RHC (Ramsay Health Care).
Indicators include:
- Trend Momentum
- Price Di

RHCA very long consolidation of a larger wave 4 still in progress. The final leg y of (wxy) will end in a zigzag pattern that indicates the completion of wave 4.
RHC is chopping around and looking for resistance RHC has been chopping around between 61-70 since april last year. a recent surge of 3 bullish candles now sees price coming up against resistance area at $68. a clear break above should see an easy run up to $70. If it struggles to break 68 area i'd be looking for a return to low 60's. for now i'm k


RHC - The trend is your friendHey guys welcome back, as promised here is the first of three charts I have this weeks. Give me a follow if your liking the charts so far. Thumbs up and comments are also appreciated.
I have broken the chart down into a general reversal situation. Sell off. Accumulation. Breakout. Retest. Continu

Gap and GO weekly breakoutfrom bearish to bullish trend due to gap and go, bullish macd cross and rsi trend. strong vol

$RHC.AX #RamsayHealthcare looks bullish abv 56 its 61$RHC.AX #RamsayHealthcare looks bullish abv 56 its 61

See all ideas
Summarizing what the indicators are suggesting.
Oscillators
Neutral
SellBuy
Strong sellStrong buy
Strong sellSellNeutralBuyStrong buy
Oscillators
Neutral
SellBuy
Strong sellStrong buy
Strong sellSellNeutralBuyStrong buy
Summary
Neutral
SellBuy
Strong sellStrong buy
Strong sellSellNeutralBuyStrong buy
Summary
Neutral
SellBuy
Strong sellStrong buy
Strong sellSellNeutralBuyStrong buy
Summary
Neutral
SellBuy
Strong sellStrong buy
Strong sellSellNeutralBuyStrong buy
Moving Averages
Neutral
SellBuy
Strong sellStrong buy
Strong sellSellNeutralBuyStrong buy
Moving Averages
Neutral
SellBuy
Strong sellStrong buy
Strong sellSellNeutralBuyStrong buy
Displays a symbol's price movements over previous years to identify recurring trends.