PALLADIUM Channel Up starting a new 2-month Bullish Leg.Palladium (XPDUSD) has been trading within a Channel Up since almost the start of the year. Its latest October 16 Higher High started a pull-back (Bearish Leg) that found support recently on its 1D MA50 (blue trend-line).
As with the Bearish Leg before, it also almost reached the 0.5 Fibonacci retr
About Palladium (XPDUSD)
Palladium has several special properties as a commodity. One of the most interesting aspects for traders in futures contracts is that palladium, despite its status as one of the main internationally traded precious metal commodities, has not seen a significant rise in price, as opposed to other precious metals like gold or silver.
The market for palladium is large while the palladium price per ounce is currently comparatively low, which is an enticing combination for those involved in commodity trading. Palladium is also different to gold in terms of investment, in that prices of gold usually rise when the economy is in a slump. Palladium price charts will show that the opposite is true of the palladium price - it decreases when the economy is down.
More than 80% of all palladium in the world is mined in South Africa and Russia.

Palladium Outlook – Double Pullback Sets Up Next Leg Higher💎 XPD/USD – “PALLADIUM vs U.S. DOLLAR”
⚡ Metals Market Opportunity Blueprint | Swing Trade Setup 🚀
🧭 Plan: Bullish Confirmation Detected!
✅ Structure: Double pullback confirmed on Kijun Line + 200 SMA retest — trend momentum reignited.
💹 Strategy: Thief’s signature Layering Style Entries 🕵️♂️
💰 La

Palladium Is Back in Shape: A Long-Term Upside SetupPalladium is showing renewed strength, forming a compelling long-term long setup.
After a prolonged correction, the metal is gradually shifting back into a bullish scenario.
The technical picture looks constructive:
Stop: 1375 — a key level whose preservation maintains the developing bullish str

xpd usd Long Palladiummonthly chart on how Palladium may act once it keeps the 0.786 orange fibo as a support. Once it does that, like it did in Green Circle, it should rally up to fibo 1.00 (roughly 1550-1600 usd for 2024) and then the real move should come after that to fibo 1.272... Mind the divergence in monthly RSI

Cup & handle, bull flag - look for a breakoutCommodities are bullish right now if you didn't know.
Silver, Gold, Natural Gas, Palladium and more. They are all interesting right now. Commodities is the sector you should be looking at right now.
We had tech, weedstocks, cryptos, ai
now look for commodities for near term plays.
Speaking of Pa
Generational Wealth | Precious Metals Super Cycle | Palladium Strategy: Impulse Correction
Direction: Bullish
Moving Average: Blue above Red
Fib Retracement: 38.2 reached
MACD > 0
Support : Finding additional confluence, as the weekly bounces off a massive support structure.
Alongside this, we can see that a reverse pattern is becoming clear with additio

STRONG BUY | PALLADIUM Strategy: Impulse Correction
Direction: Bullish
Moving Average: Blue above Red
Fib Retracement: 38.2 reached
MACD > 0
Support : Finding additional confluence, as the weekly bounces off a massive support structure
1st Target = 1336
2nd Target = 1449
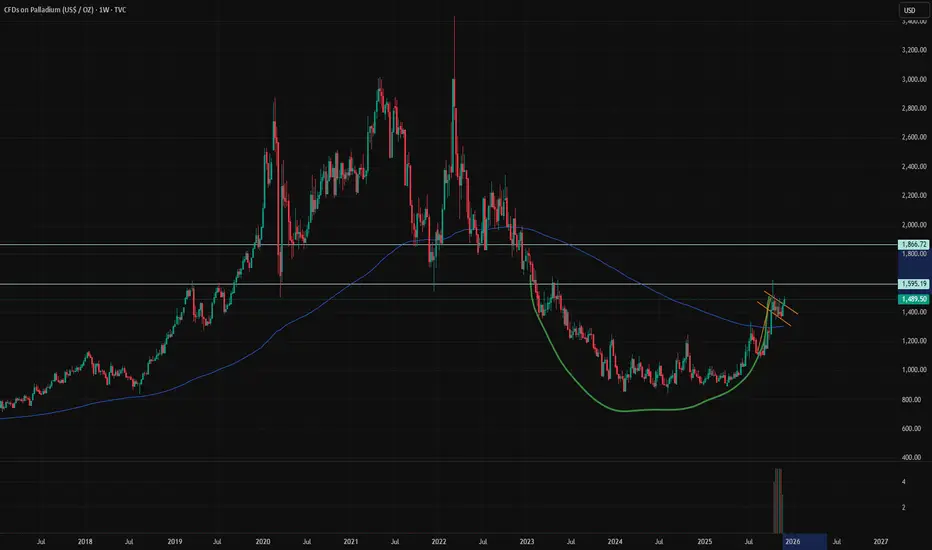
3rd Target = 1595
Lots: 0.1 (Plan to pyramid

“Palladium Double Bottom Thief Plan – Will $XPDUSD Steal 1350?”📝 TradingView Description (Thief Style, Polished, Stylish, Funny-Pro Vibe)
Asset: XPD/USD “Palladium vs U.S Dollar”
Market Map: Forex Metals – Swing/Day Trade Strategy
📊 Plan – Thief Strategy in Action
The bullish plan is confirmed with:
✅ Double bottom pullback & retest
✅ Triangular moving average

XPD/USD: Mapping A Bullish Swing Trade On Palladium🎯 Title: XPD/USD Palladium Play: The Kijun Thief's Bullish Heist! 💎🚀
Buckle up, Thief OG's! 👑 Pd (Palladium) is flashing a classic bullish pullback play, and we're looking to sneak in with a layered entry strategy. This isn't a race; it's a calculated ambush! 🥷✨
📈 The Setup: Bullish & Bouncy
Asset:

Palladium - The Calm Before the Next Surge!🏹Palladium has been on a strong bullish run , riding within a clean rising channel. After a sharp impulse, price is now cooling off — and this pullback might just be the calm before the next surge.
⚔️The metal is approaching a major intersection zone where the rising trendline meets a strong demand

See all ideas
Displays a symbol's price movements over previous years to identify recurring trends.