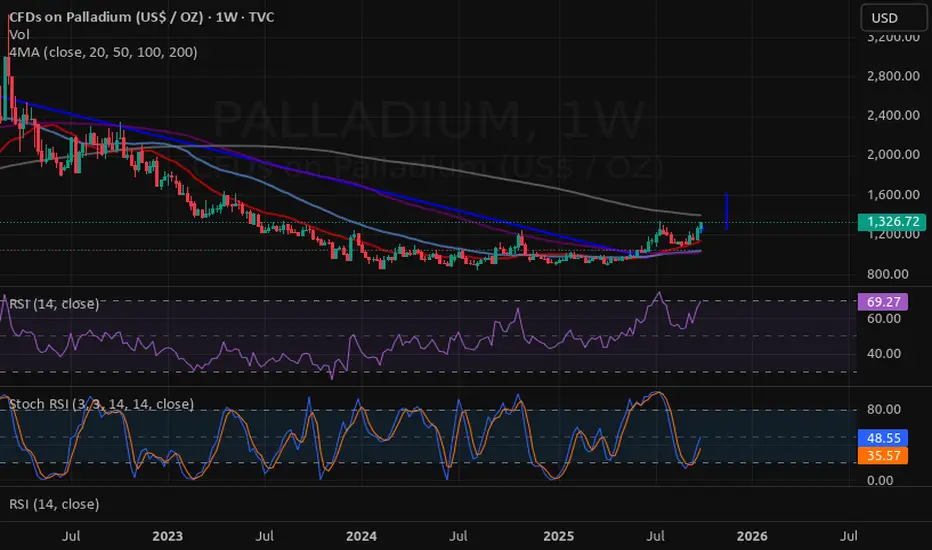
Palladium Is Back in Shape: A Long-Term Upside SetupPalladium is showing renewed strength, forming a compelling long-term long setup.
After a prolonged correction, the metal is gradually shifting back into a bullish scenario.
The technical picture looks constructive:
Stop: 1375 — a key level whose preservation maintains the developing bullish structure.
Target: 1670 — a retest of previous highs.
A breakout above 1670 could open the way for a more aggressive medium-term upside.
Trade ideas

Cup & handle, bull flag - look for a breakoutCommodities are bullish right now if you didn't know.
Silver, Gold, Natural Gas, Palladium and more. They are all interesting right now. Commodities is the sector you should be looking at right now.
We had tech, weedstocks, cryptos, ai
now look for commodities for near term plays.
Speaking of Palladium, I love this chart. Beautiful.
We have a nice formation of a 2 year cup with a resistance at 1600$
Short term, we have near break out of bull flag at 1500$
The blue zone extending to may should be a zone where you have to keep close attention to this chart.
I'm expecting a breakout with target of 1870 ish on palladium. I'm early on this one, there is no breakout at the moment. I just follow the good sector and bet on the nice chart.
Generational Wealth | Precious Metals Super Cycle | Palladium Strategy: Impulse Correction
Direction: Bullish
Moving Average: Blue above Red
Fib Retracement: 38.2 reached
MACD > 0
Support : Finding additional confluence, as the weekly bounces off a massive support structure.
Alongside this, we can see that a reverse pattern is becoming clear with additional support illustrated by the support level in the form of the rectangular red box.
1st Target = 1678
2nd Target = 1836
3rd Target = 2039
Lots: 0.1 (Plan to pyramid into this one)
INSIGHTS: Precious metals continue to show strength with a weakening dollar. Pay attention to the DBC commodity Index which is indicating strength across the commodity complex. Alongside this, the DXY is sitting at an interesting level. Lets see whether will bounce at this level off a multiyear trend or whether the dollar will give way to lower lows in the coming months.

STRONG BUY | PALLADIUM Strategy: Impulse Correction
Direction: Bullish
Moving Average: Blue above Red
Fib Retracement: 38.2 reached
MACD > 0
Support : Finding additional confluence, as the weekly bounces off a massive support structure
1st Target = 1336
2nd Target = 1449
3rd Target = 1595
Lots: 0.1 (Plan to pyramid into this one)
INSIGHTS: Mining companies are pressing Trump to add tariffs to palladium imports from Russian. Should this happen, we should see an increase in price as SA and Russia export the most Palladium.
Re-entering this trade as I have a string conviction on it.
Trade 5/20

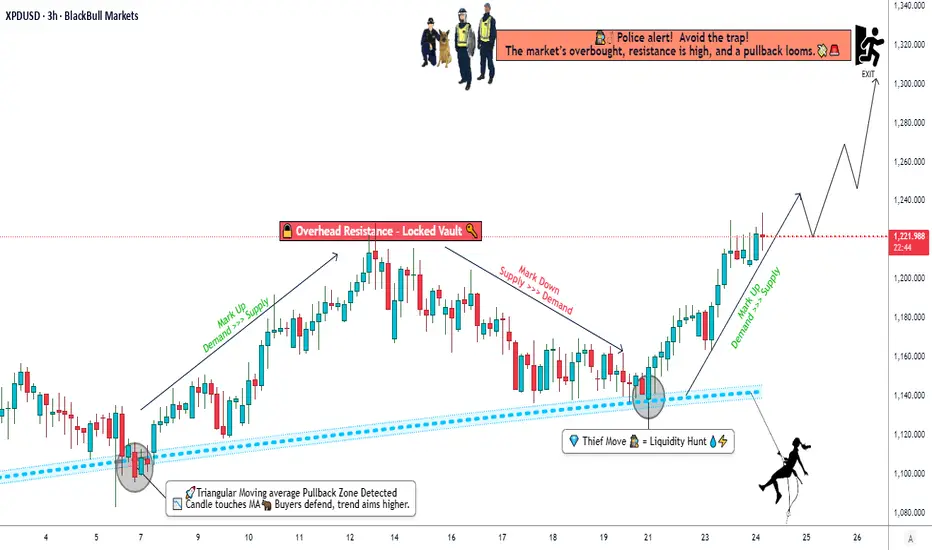
Palladium Outlook – Double Pullback Sets Up Next Leg Higher💎 XPD/USD – “PALLADIUM vs U.S. DOLLAR”
⚡ Metals Market Opportunity Blueprint | Swing Trade Setup 🚀
🧭 Plan: Bullish Confirmation Detected!
✅ Structure: Double pullback confirmed on Kijun Line + 200 SMA retest — trend momentum reignited.
💹 Strategy: Thief’s signature Layering Style Entries 🕵️♂️
💰 Layered Buy Limits: 1,400.000 → 1,440.000 → 1,480.000
(You can increase limit layers based on your own comfort and capital allocation.)
🛑 Stop Loss (SL): Thief SL @ 1,380.000
👑 Dear Ladies & Gentlemen (Thief OG’s) — Adjust your SL based on your own strategy and risk level.
🎯 Take Profit (TP): Resistance acting as a “Police Barricade” 🧱 + Overbought Trap ⚠️ spotted ahead.
🏁 Target zone → 1,660.000
💬 Note: This is not financial advice — trade at your own risk and reward preference!
💠 Correlated Markets & Pairs to Watch:
OANDA:XAUUSD (Gold): Often leads Palladium’s momentum during USD weakness.
⚙️ OANDA:XAGUSD (Silver): Tracks overall metals sentiment; supportive when inflation expectations rise.
💵 TVC:DXY (U.S. Dollar Index): Inverse correlation — weaker dollar often boosts Palladium strength.
💴 FX:USDJPY : Watch for USD weakness; it can signal risk appetite shift favoring metals.
🧠 Key Market Insights:
🔹 The 200 SMA has consistently acted as dynamic support in recent sessions.
🔹 Kijun pullback = Momentum reset before next bullish continuation.
🔹 Layering entries reduce timing risk and improve cost-average efficiency.
🔹 The target aligns with previous supply and psychological resistance around 1,660.
⚔️ Execution Blueprint:
1️⃣ Wait for price retrace into your preferred layer levels (1,400 / 1,440 / 1,480).
2️⃣ Confirm entries via candle reaction or Ichimoku signal.
3️⃣ Keep SL below invalidation zone (~1,380).
4️⃣ Take partials near 1,600 and secure final profits around 1,660.
5️⃣ Stay alert — if USD strengthens, metals might pause or pull back.
💬 “Drop your thoughts below — How are you layering your XPD/USD setup?”
❤️ Hit LIKE & FOLLOW if you enjoy clean swing setups & advanced layering strategy breakdowns!
⚡ Let’s keep the momentum rolling, Thief OG’s 👑

“Palladium Double Bottom Thief Plan – Will $XPDUSD Steal 1350?”📝 TradingView Description (Thief Style, Polished, Stylish, Funny-Pro Vibe)
Asset: XPD/USD “Palladium vs U.S Dollar”
Market Map: Forex Metals – Swing/Day Trade Strategy
📊 Plan – Thief Strategy in Action
The bullish plan is confirmed with:
✅ Double bottom pullback & retest
✅ Triangular moving average support
✅ Heikin Ashi reversal doji candle formed
✅ Re-accumulation at the neutral zone
This looks like Palladium is warming up for a climb!
🎯 Entry – Thief Layer Style
Instead of a single entry, I use layered buy limits (multiple limit orders):
💎 1240
💎 1250
💎 1260
💎 1270
(Traders can adjust/increase layers based on their own style.)
🛡 Stop Loss (SL) – Thief’s Guard Line
My SL idea → 1200
👉 But remember: It’s your account, your rules. Choose your own risk shield.
🎯 Target – Thief’s Escape Point
Main target: 1350
Strong resistance barricade around 1400 → could act as a police trap zone (overbought + liquidity zone).
📌 Best play: Escape with profits before the barricade!
🔑 Key Notes to the OG’s
Dear Ladies & Gentleman (Thief OG’s), this isn’t about following my SL or TP blindly.
Trading is risk. Manage it your way → take money, then make money.
🔄 Related Correlation Watchlist
Keep an eye on metals & correlated assets for cross-check confirmation:
OANDA:XAUUSD (Gold) – often leads sentiment in precious metals
OANDA:XAGUSD (Silver) – momentum clues for XPD
OANDA:XPTUSD (Platinum) – strong structural correlation with Palladium
TVC:DXY (U.S Dollar Index) – dollar strength/weakness directly impacts Palladium
✨ “If you find value in my analysis, a 👍 and 🚀 boost is much appreciated — it helps me share more setups with the community!”
⚠️ Disclaimer: This is a Thief Style trading strategy just for fun & educational purposes. Not financial advice. Trade at your own risk.
#XPDUSD #Palladium #Forex #Metals #TradingStrategy #SwingTrade #DayTrade #Gold #Silver #Platinum #DollarIndex #ThiefStrategy

XPD/USD: Mapping A Bullish Swing Trade On Palladium🎯 Title: XPD/USD Palladium Play: The Kijun Thief's Bullish Heist! 💎🚀
Buckle up, Thief OG's! 👑 Pd (Palladium) is flashing a classic bullish pullback play, and we're looking to sneak in with a layered entry strategy. This isn't a race; it's a calculated ambush! 🥷✨
📈 The Setup: Bullish & Bouncy
Asset: XPD/USD (Palladium vs. U.S. Dollar) 💰
Bias: STRONGLY BULLISH ✅ 🐂
Confirmation: A clean pullback to the Kijun-sen (Kijun Moving Average) from the Ichimoku Cloud. Price respecting this level is our green light! 🟢
🎯 The Thief's Entry Plan (Layered Limit Orders)
The breakout above 99.200 confirms the vibe! Our "Thief Strategy" uses multiple limit orders to scale in, averaging our entry like a pro.
Entry Zone: We're setting buy limit orders in layers:
Layer 1: 🎯 1360
Layer 2: 🎯 1380
Layer 3: 🎯 1400
Layer 4: 🎯 1420
💡 Pro Tip: You can add more layers or adjust levels based on your risk appetite!
⚠️ Risk Management (The Escape Plan) 🚨
Stop Loss (The Getaway Car): 🚗💨 A Thief's SL is 1300. This is our line in the sand. If price breaches this, the heist is off!
📢 Note, Dear Ladies & Gentleman (Thief OG's): I do not recommend using only my SL. It's your choice; you can make money then take money at your own risk.
💰 Profit-Taking (Cashing the Loot) 🏦💵
Target: 1620 🎯
Why Here? This area converges with a strong Moving Average resistance, potential overbought conditions, and could be a trap for late buyers. We escape with profits before the chaos! 😎
📢 Note, Dear Ladies & Gentleman (Thief OG's): I do not recommend using only my TP. It's your choice; you can make money then take money at your own risk.
🔍 Related Pairs & Market Context 🌍
Keep an eye on the whole precious metals family for confirmation! 👀
XAU/USD ( TVC:GOLD ): 👑 The king of metals. A strong Gold often lifts the whole complex.
XPT/USD ( CAPITALCOM:PLATINUM ): 💍 Palladium's sister metal. They often move in correlation.
TVC:DXY (U.S. Dollar Index): 📉 A weaker TVC:DXY typically boosts dollar-denominated commodities like Palladium.
✨ Footer & Community Love ❤️
✨ “If you find value in my analysis, a 👍 and 🚀 boost is much appreciated — it helps me share more setups with the community!”
🏷️ Hashtags
#Palladium #XPDUSD #Trading #Metals #SwingTrading #TechnicalAnalysis #Ichimoku #Kijun #ThiefStrategy #TradingSetup #ToTheMoon #Profit

Palladium - The Calm Before the Next Surge!🏹Palladium has been on a strong bullish run , riding within a clean rising channel. After a sharp impulse, price is now cooling off — and this pullback might just be the calm before the next surge.
⚔️The metal is approaching a major intersection zone where the rising trendline meets a strong demand and structure area, a confluence that has previously sparked powerful rallies. As long as this intersection holds, I’ll be watching for bullish confirmations to join the trend.
A healthy correction into this zone could set the stage for the next impulsive wave, with potential upside targets around $1,550 and even $1,700 if momentum kicks in.
In short, Palladium remains overall bullish, and this upcoming retest could be the perfect reload zone before the next big move north.
📊All Strategies Are Good; If Managed Properly!
~Richard Nasr

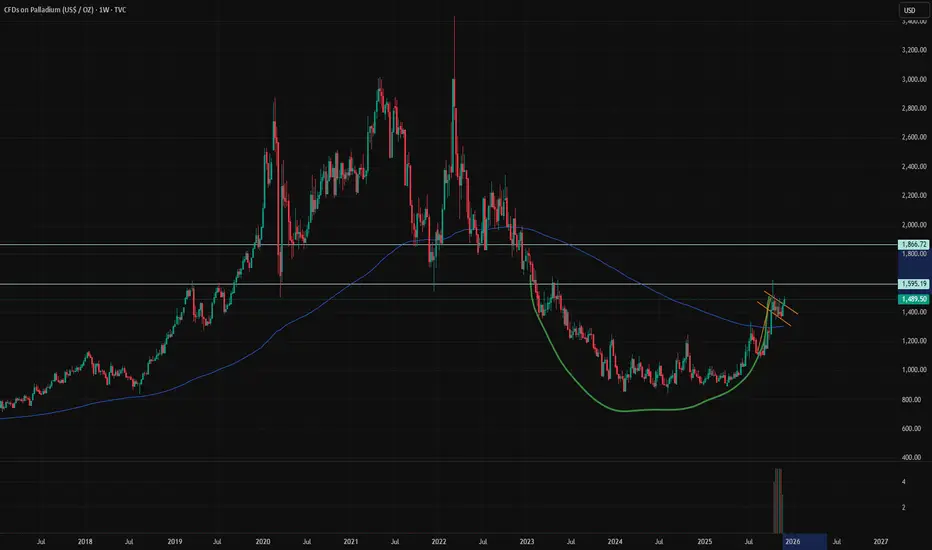
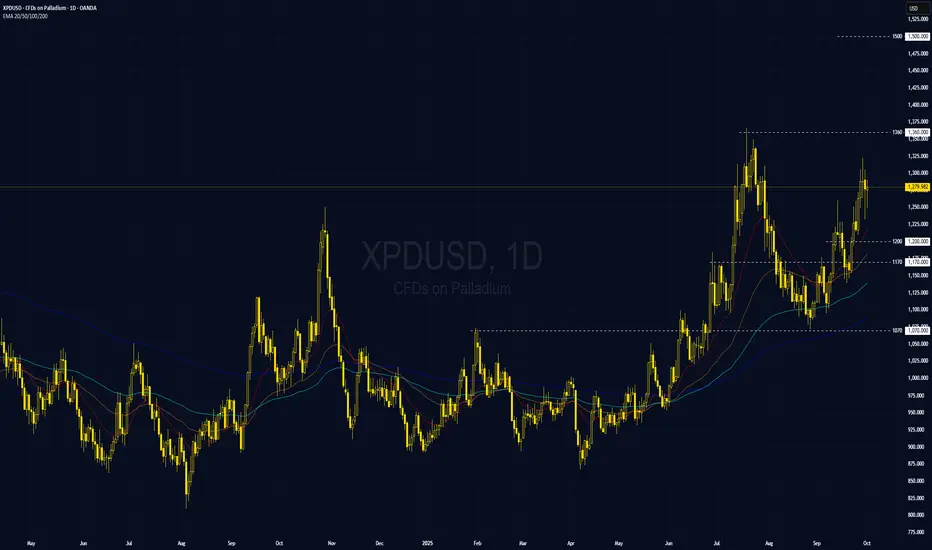
Palladium (XPDUSD) – Cup & Handle Breakout in Play?Palladium is showing a Cup & Handle pattern on the weekly chart – a strong bullish continuation setup. After a long rounded base (cup), price has pulled back slightly to form the handle, and now it’s testing the neckline zone.
🔑 Key Levels:
📍 Breakout Zone: 1,270 USD
🎯 Target: 1,680 USD (cup depth projection)
🛑 Invalidation: Below 1,200 USD
📈 Bullish View: A confirmed breakout and weekly close above 1,270 could spark a move towards 1,680. Momentum traders may look for entries on the breakout with stops below handle support.
📉 Bearish Risk: Failure to hold above 1,200 would invalidate the pattern and could lead to deeper downside.
⚖️ Trade Plan Idea:
✅ Entry: Breakout above 1,270
✅ Stop: Below 1,200
✅ TP: 1,680 (first target)

Palladium's Downward Spiral: XPDUSD Bearish Outlook for October XPDUSD Direction Outlook for October 21, 2025
Palladium prices against the US dollar opened the day at around 1,504.50 but have since experienced a sharp decline, currently trading near 1,421.67 with a daily drop of approximately 5.51%. The day's range has fluctuated between a high of 1,520.26 and a low of 1,414.01, reflecting heightened volatility and seller dominance. This downward movement aligns with broader technical signals, including a strong sell recommendation from moving averages and indicators, suggesting continued bearish pressure in the short term. Recent forecasts indicate potential intraday weakness, with some analyses noting a break of weekly support levels and bearish price action patterns like engulfing candles.
Market sentiment from real-time discussions points to a significant plunge, with reports of over 14% losses from recent highs, testing key support around 1,456 to 1,500. While some observers anticipate a rebound if support holds at levels like 1,480 or 1,380, the immediate trend shows clear downside follow-through from Friday's reversal. External factors, such as industrial demand concerns and surplus projections, may be contributing to this sell-off, though longer-term views remain mixed with potential for recovery in 2025 if supply constraints emerge.
Overall, the direction for XPDUSD today leans bearish, with risks of further declines toward 1,345 or lower if current supports fail, though buyers could step in for a temporary stabilization.

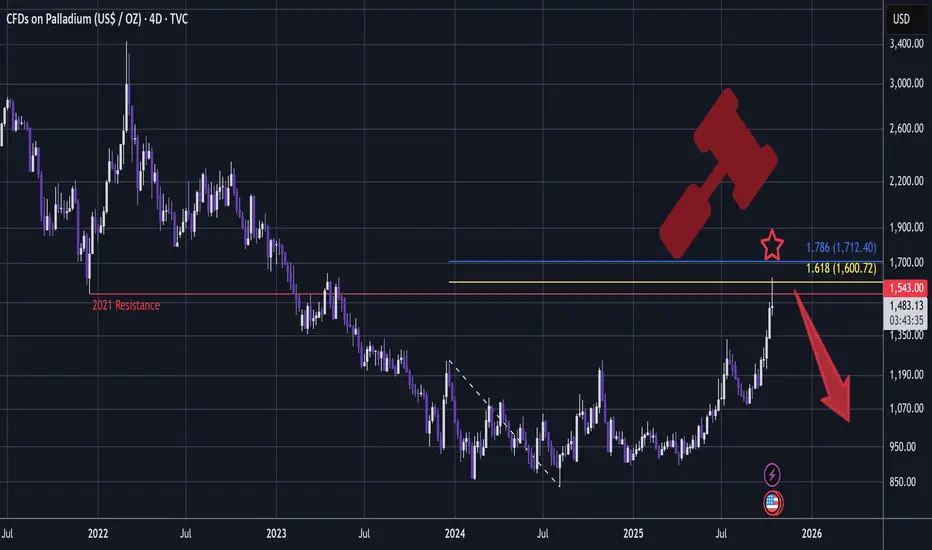
PALLADIUM - Short Setup, Bearish Rotation In MetalsA very bearish setup is developing:
Since the top, there is nowhere on the chart that has a whipsawing candle like this:
A very big Shooting Star!
This setup has my favourite conditions met:
- Whipsawing candle that sweeps liquidity through key resistance (2021)
- Tidy 1.618 Golden Window (1.618 - 1.786) - taking extremity pivots of Accumulation to draw the fib trendline.
Palladium has quite weak price action overall comparing to other metals and this very bearish whipsaw might be a signal for the overall metals market that we're passing through a major pivot.
This is also considering that SILVER may have topped at my 1.618 target @ $54:
And GOLD may perhaps also have topped after hitting the ultra long term 2.272 (image below is a previous thread I made - click to enter):
In addition news arrives that "Gold price pulls back from record as Trump eases trade concerns" - www.mining.com
Interesting isn't it how this type of news arrives exactly as GOLD, SILVER and PALLADIUM all hit hit respective Phi ratio landmarks / significant resistances !
...
Palladium may chop, however it often dumps hard when it swings bearish - I doubt it can take out this candle wick high - and even if it did then it would still be very bearish.
The candle closes in a few hours.
And from here there is a possibility that this might be the next wave down, though I won't hold anywhere near that long.
In summary, we have multiple signals from Gold, Silver, Palladium and Trump tariff news that metals may be topping / hitting a significant peak.
I entered a short position here.
This analysis is shared for educational purposes only and does not constitute financial advice. Please conduct your own research and consider that crypto is a dangerous market.
Palladium Wave Analysis – 17 October 2025- Palladium reversed from long-term resistance level 1600.00
- Likely to fall to support level 1500.00
Palladium recently reversed down from the long-term resistance level 1600.00 (former strong support from 2020 and 2021, acting as resistance after it was broken at the start of 2023, as can be seen below).
The resistance level 1600.00 was strengthened by the upper weekly Bollinger Band and by the 50% Fibonacci correction of the weekly downtrend from the end of 2022.
Given the long-term downtrend, Palladium can be expected to fall to the next round support level 1500.00.

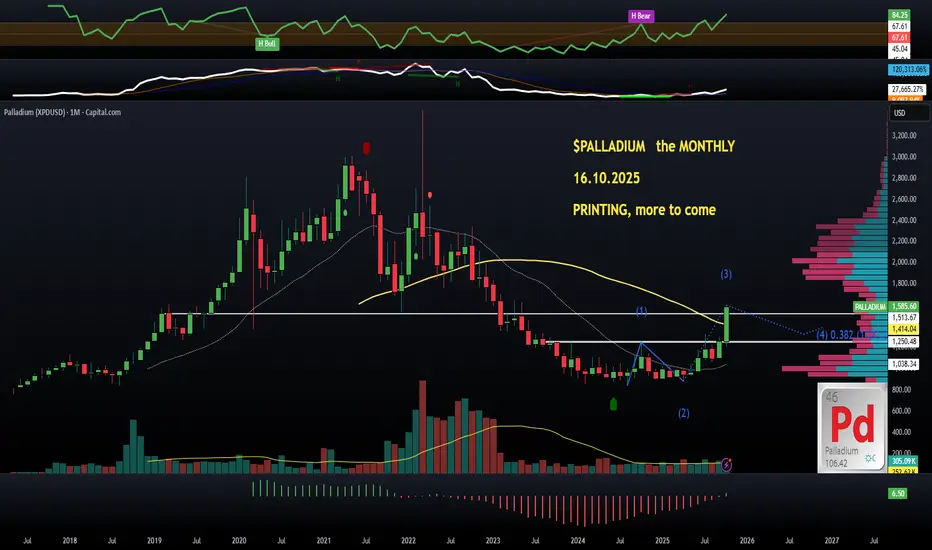
$PALLADIUM (monthly): PRINTING on WAVE 3, much MORE to comeOnly last month I published another one of my METALS trade, $PALLADIUM.
I couldn't resist, MONTHLY chart was enough for me to go in, it was $1207 then, 5 weeks ago, and approaching $1600 now.
I called the money wave, basically, that's what they call WAVE 3 in Elliot's Wave Theory. And it's not done yet.
The monthly candle is of a GOD-type, flipped $1513 (multi-year support/resistance level dating back to 2019), gaining momentum (RSI 84, overbought technically, but could easily get much much more overbought, as METALS often do).
My favourite Elliot's WAVE oscillator has only started flipping into green territory.
This is just the beggining, imo, although there might be a short-term cool-down at some point. Long-term, this MONTHLY is an absolute GEM.
👽💙
Palladium - a precious metal in demandPalladium is a precious metal in demand.
Applications -
- Automotive sector for Catalytic converters and EV adoption.
- Geopolitical supply side pressure ( Russia ) and Recycling delays.
- Industrial use electronics, chemical catalysts, hydrogen storage , fuel cells.
- Healthcare - Dental Alloy, Implantable medical devices
- Aerospace
- Jewlery
- Water Treatment
- Optics and Photography
Palladium has been on an absolute tear. Price has moved from October 3rd at 1211 , in which the 200 MAV channel was tested. To a recent swing high of 1532.
Everything has to breathe out, and price is now retracing. Areas of interest for a potential reversal include
1. Confluence of Trendline and Fibonacci 50% retracement = around $1375
2. Confluence of the Demand Zone and Fibonacci 61.8% retracement = around $ 1335.
These offer good areas to consider a long position. The sentiment for all precious metals is bullish. Your long position could be a swing trade or better still a position trade.
Gold and Silver are at ATH. Platinum is close. Palladium can easily double from here.

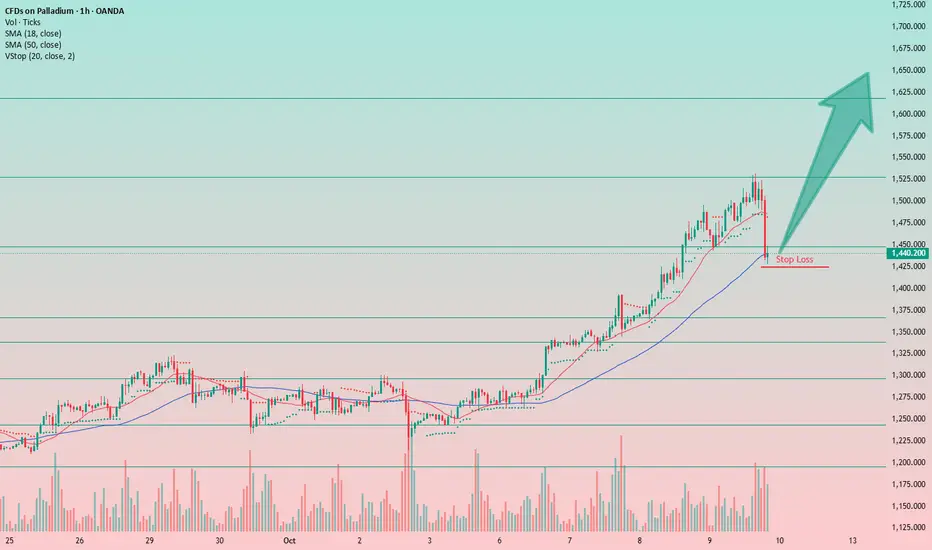
Palladium: Testing a Long from Current LevelsIt might be worth trying a long position on palladium from the current levels.
There’s a chance that the long-awaited correction has begun, and the downward move could deepen. However, the tight stop-loss at the level 1425 on this trade is encouraging — as is the accumulated profit, which allows for such tactical entries.
A small amount of risk seems acceptable here; if anything goes wrong, the position will close at the stop.
PALLADIUM ( XPDUSD ) BULLISH BREAKOUTPalladium peaked on March 2022 @ 3400$ before sharply dropping to consolidate in the price range of 800$ - 1300$. The insiders have been accumulating the precious metal in this tight consolidation for the past two years. At its peak at $3400, Palladium was more expensive than Gold. Following the accumulation phase, Palladium is on the verge of a breakout. A close above the consolidation phase on the daily TF, accompanied by high volume, will offer a buying opportunity.


Palladium to follow Gold & SilverPalladium after finding a bottom around 900$ is ramping up, trying to catch with gold and silver. First target 1600$, secondary target 2000$
Palladium’s bull run is knocking on a two-year highPalladium’s bull run is knocking on a two-year high.
Technical Analysis XPDUSD rose toward the previous high near 1,360 after forming a series of higher swings, supported by diverging bullish EMAs that suggest stronger bullish momentum.
If XPDUSD breaks above 1,360, it would mark a new two-year high and may target the next level at 1,500.
However, before pushing higher, it may pull back to test support around 1,170–1,200 before the uptrend resumes.
Fundamental Analysis
The Palladium bull run is driven by geopolitical tensions, especially the risk of new trade barriers on Russian palladium export, which are creating uncertainty and spurring speculative buying.
In addition, global mine output has not increased meaningfully, and some regions are facing operational and environmental setbacks, tightening global supply.
Another factor is safe-haven demand led by gold, which has lifted the broader precious-metals products and supported demand in palladium.
Overall, palladium prices are supported by supply concerns and robust industrial demand, though volatility is likely in response to production headlines or shifts in precious-metals sentiment.
The outlook is positive but requires caution. Market participants should closely monitor Russia’s export policy and mine updates from South Africa and North America.
Analysis by: Krisada Yoonaisil, Financial Markets Strategist at Exness

XPDUSD Long AnalysisPalladium has shifted from a mid-August downtrend into a choppy recovery and now shows signs of a trending bullish phase on the 4-hour timeframe. Price has cleared short-term resistance around 1,176.87 → 1,246.75 and is currently trading ~1,237 (your chart). The moving averages have flattened then begun to slope upward, and the most recent swing shows a higher low / higher high rhythm — the basic condition you want for a bullish continuation.
The chart’s annotated zones show a clear supply band around 1,246.7 (nearby resistance) and a higher upside magnet around 1,366.84 (your marked major target). That gives a visible path for an upside trade with a defined invalidation area below recent demand.
Why bulls have the edge now:
• Price is back above the shorter MAs and testing the prior supply band — buyers have absorbed previous selling.
• The 4H swing structure: recent higher lows vs earlier lows (buyers defending lower levels).
• Momentum in the last push is relatively clean (no long upper wick exhaustion) — the move is controlled, not a spike.
Important macro/contextual notes (trade-sensitivity):
• Palladium is sensitive to industrial/catalytic demand and to USD strength; watch auto demand news and USD moves.
• Palladium can gap on low liquidity and on supply/disruption headlines — plan for slippage around big events.
________________________________________
Key levels to respect (copy/paste friendly)
• Current price (approx): 1,237.11
• Immediate resistance (short-term supply): 1,246.75
• Primary support (near-term demand / pullback buy zone): 1,176.87
• Major upside target / magnet: 1,366.84
• Deeper support (if bulls fail): lower dotted green levels on your chart (≈ 1,100–1,050 area historically)
A clean 4H close above 1,246.75 removes local supply pressure and is the simplest technical confirmation for the next leg up toward 1,366.84. Conversely, a decisive 4H close back below 1,176.87 would invalidate this bullish plan and suggest re-evaluation.
________________________________________
Trade risk plan & management (rules you should follow)
• Position sizing: size so the dollar risk to your stop equals 1–2% of account equity. That keeps any single loss manageable.
• Partial profits: take 30–40% at the first meaningful resistance on the way up (see trade setups below). This locks gains while leaving a runner for the bigger target.
• Stop management: after a first partial is taken, move your stop to breakeven (or a small profit) to make the remainder risk-free. Then trail the stop under each new 4H higher low (or use a volatility trail like 1.5×ATR(20,4H)) to give the trade room while protecting gains.
• Event risk: reduce size or avoid adding right before major macro/industry events that can move metals (e.g., major US data, central bank windows, supply/disruption news).
• Plan for slippage: Palladium can gap — factor realistic slippage and wider fills into your sizing and stop placement.
• Fail scenario: if price closes below 1,176.87 on 4H, exit and wait for a new structure to form.
________________________________________
Trade setups (bullets only)
A) Breakout (higher-probability, confirmation entry)
• Entry: buy after a confirmed 4H close above 1,246.75, or on the retest of 1,246.75 after that close (better risk control).
• Stop-loss: 1,200 (below the breakout zone and recent short-term structure).
• Take Profit 1: 1,320 → take 30–40% off.
• Take Profit 2: 1,366.84 → scale out remaining position (trail remaining).
• Sizing tip: risk 1% of equity to the stop for the full position.
________________________________________
Execution checklist (quick)
1. Confirm no major data/event in the next 4-12 hours (if you’re entering short term).
2. Prefer a 4H close above 1,246.75 for the breakout plan, or a clear price action buy signal in 1,200–1,176.87 for the pullback plan.
3. Place stop and position size to risk 1–2% max.
4. Book partials at TP1, move stop to breakeven, then trail using 4H higher lows or 1.5×ATR.
5. If the market closes 4H below 1,176.87, exit and reassess.
________________________________________
Final takeaway
Technically this is a bullish, controlled setup: structure shows buyers defending lower levels and the path to ~1,367 is clear if price can hold above local demand and overcome the short supply band at 1,246.7. Use disciplined sizing, partial profit-taking at intermediate resistance, and an active trailing stop to protect gains — that combination gives you upside capture while controlling downside risk.

Palladium Market Roadmap | Bullish Case vs Overbought Resistance💎 XPD/USD | Palladium vs U.S Dollar – Market Wealth Strategy Map (Swing/Day Trade)
📊 Plan:
Bullish confirmation looks solid here — backed by Triangular Moving Average pullback + retest ✅ and a Double Bottom formation 🥂 which adds strength to buyers’ side.
I’m laying out my Thief Strategy (Layering Style Entry Method):
Entry is not fixed at a single point 🎯 — instead, I prefer layering multiple limit orders to build positions gradually.
👉 Example Buy Limit Layers:
1180
1190
1200
1220
(You can increase or adjust layers based on your own conviction.)
🛡️ Stop Loss (SL):
📍 My reference SL: 1150
(Note: I’m not recommending you only follow my SL. Always set risk at your comfort level. Manage wisely!)
🎯 Target (TP):
⚠️ “Police barricade” 🚔 acts as strong resistance + overbought conditions → possible bull trap.
My target zone: 1320
(Again, this is just my style. Take profits when it suits your strategy — protect your gains!)
🔗 Related Pairs to Watch:
OANDA:XPTUSD (Platinum vs USD) → Often moves with Palladium due to industrial/auto demand links 🚗
OANDA:XAUUSD (Gold vs USD) → Precious metals correlation, safe-haven appeal 🏆
OANDA:XAGUSD (Silver vs USD) → Volatility cousin, tends to echo similar swings ⚡
PEPPERSTONE:USDX (Dollar Index) → Strong USD can weigh on metals overall 💵
Key Correlation Insight:
Palladium is more industrial-demand driven compared to gold/silver. When auto-sector demand spikes, palladium shines 🌟, but when USD strengthens or risk-off flows dominate, metals may face pressure.
✨ “If you find value in my analysis, a 👍 and 🚀 boost is much appreciated — it helps me share more setups with the community!”
⚠️ Disclaimer:
This is a Thief Style Trading Strategy created for educational + fun purposes only. Not financial advice. Trade at your own risk.
#Palladium #XPDUSD #MetalsTrading #SwingTrade #DayTrade #ThiefStrategy #LayeringStrategy #MarketAnalysis #PreciousMetals
XPDUSD--LONG--Bullish bias
--check monthy,weekly and daily chart as well
--tp and entry levels are as shown on chart
