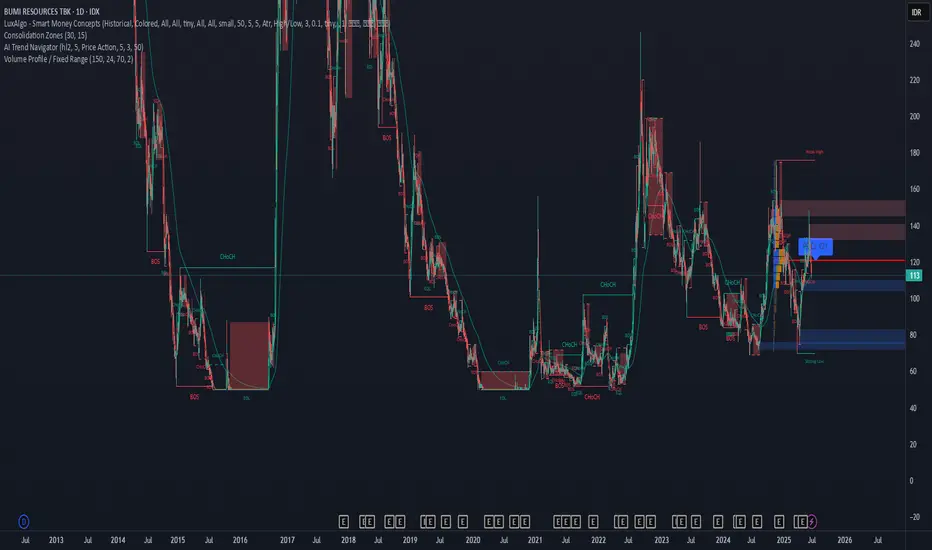
The End of Bakrie Euphoria? $IDX:BUMIDespite the MSCI candidate euphoria and several significant corp action, IDX:BUMI D1 chart has shown an important warning to all of its Investor. If we use the classic price action frame work, there should be new higher high to confirm that BUMI is in an uptrend. In this case, I've done several ba
PT Bumi Resources TBK
No trades
−0.01 USD
67.25 M USD
1.36 B USD
About PT Bumi Resources Tbk Class A
Sector
Industry
CEO
Adika Nuraga Bakrie
Website
Headquarters
Jakarta
Founded
1973
IPO date
Jul 30, 1990
Identifiers
3
ISIN US69367Y1073
PT Bumi Resources Tbk is a holding company, which engages in mining activities. It operates through the following segments: Holding Company, Coal, Services, Oil and Gas, and Minerals. The Coal segment includes the exploration, exploitation, mining, and selling of deposits. The Services segment involves the provision of marketing and management. The Oil and Gas segment refers to the exploration stage. The Mineral segment focuses on gold and exploration. The company was founded on June 26, 1973 and is headquartered in Jakarta, Indonesia.
Related stocks

TRADING SIGNAL SAHAM : BUMI RESOURCES📈 TRADING SIGNAL: BUMI RESOURCES (BUMI.JK)
Parameter Details
📅 Date of Analysis December 20, 2025
🎯 Signal Type Potential Buy on Support Retest
Entry Zone: Consider entries between IDR 340-360
💰 Take Profit Targets (TP) -
- TP1: IDR 500
- TP2: IDR 530
⚠️ Stop Loss (SL) SL: IDR 280
⚠️ DISCLAIMER:

$BUMI - Executive Summary IDX:BUMI
Price has broken down from a rising channel and is now sitting directly on the Fibonacci 0.382 zone (~350). RSI is weak and trending down, showing persisting bearish momentum.
The next high-probability reaction zone is 320 (Fib 0.618)--buyers usually more dominant here.
Now, bears rem


BUMI <The Sideways Technique>BUMI, one of trending stock with good news latelty, up/down watch the pivot area, probability bullish, sell @ Red area. If price breakdown (below pivot area) better go for another stock or buy @ Green area.

BUMI My Bullish PredictionBUMI My Bullish Prediction.
DISCLAIMER ON. DO YOUR OWN RESEARCH. IMHO. KAYA

BUMI - Pasca Libur Lebaran 2022$BUMI
sektor = COAL
teknikal = supply & demand
Buy = 56
Stoploss = tidak ada
TargetPrice1 = 64
TargetPrice2 = 71
TargetPrice3 = 86
TargetPrice4 = 102
⚠️ BUMI terkenal saham gocap. Tapi cukup potensi ikut momen COAL (volume transaksinya paling besar)

BUMI POSSIBLE ROAD TO 504 - 520 - 560Bumi Resources from the perspective of Technical Analysis. If Double Bottom is valid, possible retest neckline area 504 - 520 - 560

See all ideas
Summarizing what the indicators are suggesting.
Oscillators
Neutral
SellBuy
Strong sellStrong buy
Strong sellSellNeutralBuyStrong buy
Oscillators
Neutral
SellBuy
Strong sellStrong buy
Strong sellSellNeutralBuyStrong buy
Summary
Neutral
SellBuy
Strong sellStrong buy
Strong sellSellNeutralBuyStrong buy
Summary
Neutral
SellBuy
Strong sellStrong buy
Strong sellSellNeutralBuyStrong buy
Summary
Neutral
SellBuy
Strong sellStrong buy
Strong sellSellNeutralBuyStrong buy
Moving Averages
Neutral
SellBuy
Strong sellStrong buy
Strong sellSellNeutralBuyStrong buy
Moving Averages
Neutral
SellBuy
Strong sellStrong buy
Strong sellSellNeutralBuyStrong buy
Displays a symbol's price movements over previous years to identify recurring trends.