AIRLINK – TECH SHORT-SELL CALL | 1H TF | 26 NOV 2025 | By TCAAIRLINK – TECH SHORT-SELL CALL | 1H TF | 26 NOV 2025 | By The Chart Alchemist
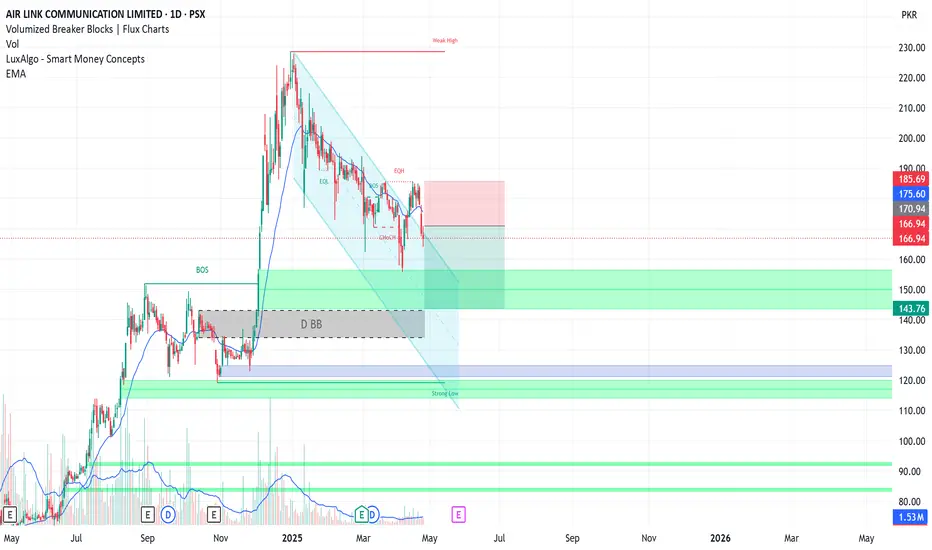
AIRLINK previously completed a significant uptrend, reaching a high of PKR 193. However, the momentum has now shifted bearish, and the stock has formed a robust bearish structure near the current market levels. We expect the stock to continue its downward movement.
📢 Technical Analysis by Mushtaque Muhammad (The Chart Alchemist).
Trade ideas

Airlink🔹 Technical Summary
✅ Wave (5) near completion at strong ascending support
✅ Bullish wedge compression suggests reversal potential
⚠️ Break below 152 invalidates pattern and may trigger deeper correction toward 145

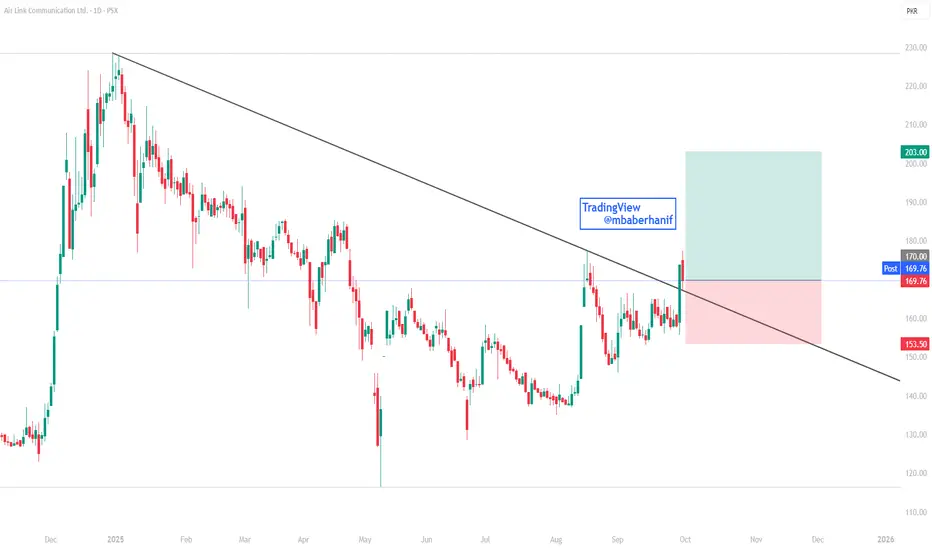
AIRLINK Breakout Signals Potential Upside Rally!!!AIRLINK has successfully broken above its long-standing descending trendline, signaling a shift in momentum. The breakout indicates bullish strength, supported by higher volumes and sustained buying pressure. A retest of the breakout zone is underway, which, if held, would further confirm the continuation of the upward move. Based on the current structure, the first target is placed at 188, while the second target is projected at 203. On the downside, the invalidation level for this view lies below 153.50. Sustained movement above the breakout point will keep the outlook positive in the coming sessions.
AIRLINK LongAir Link Communication Ltd (AIRLINK – PSX)
The stock has broken out of the falling channel and is consolidating around 157.
Buy Zone: 155 – 158 (if price holds above 150)
Stop Loss: Below 147 (safer stop at 126 for long-term view)
Take Profit:
TP1: 190
TP2: 223
This setup offers a good risk-to-reward opportunity. Always manage your position size wisely.
Disclaimer:
This information is provided strictly for educational purposes only. It should not be considered as financial, investment, or trading advice. Please do your own research and consult a licensed professional before making any decisions.

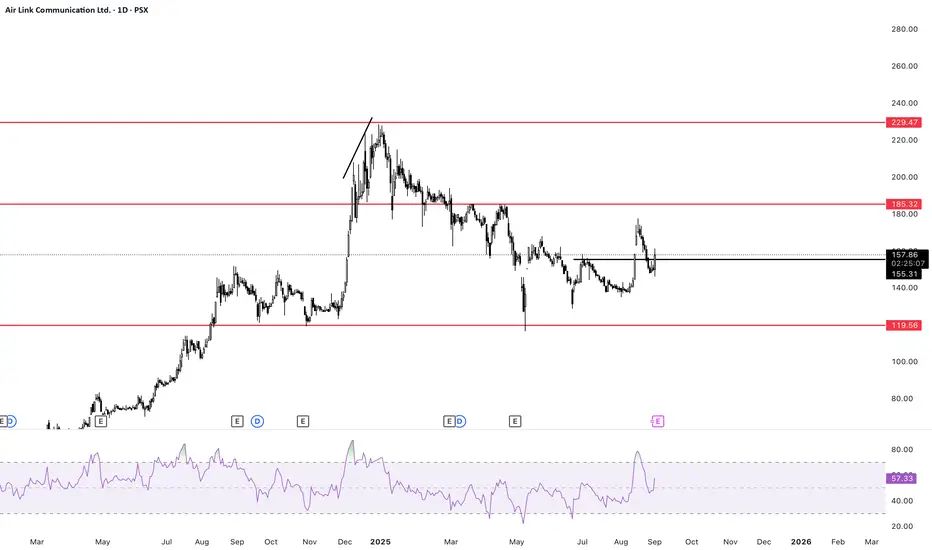
Airlink: Wyckoff Automatic Rally in Play!#Airlink has started to show the classic signs of a Wyckoff Automatic Rally (AR) after months of persistent decline. The stock found strong demand inside the sell-side liquidity zone of 116.5–137.5, which acted as a potential Selling Climax (SC) where weak hands exited and stronger players absorbed supply. From there, the sharp bounce towards 161+ marked the Automatic Rally, signaling that supply had been absorbed and demand was strong enough to push prices higher.
The Secondary Test (ST) has already been completed within the same liquidity zone, confirming demand absorption and strengthening the accumulation structure. With ST out of the way, the stock now eyes a potential Sign of Strength (SOS), which could emerge on a breakout above 180–185.
If successful, the next upside target lies around 225 (previous high), while 200 could act as a Last Point of Support (LPS) on a retest. On the downside, a break below 116.5 would invalidate the accumulation setup and reintroduce markdown risk. Overall, #Airlink appears positioned in the early accumulation-to-markup stage of Wyckoff with a strong upside bias if the trading range holds.
#Disclaimer: This analysis is for educational purposes only and not financial advice. Trading stocks involves risk; past performance does not guarantee future results. Please do your own research before investing.

Airlink assembler of mobile phone in PakistanFundamentally very strong company in IT sector
operating profit 4.3 B
whereas other income and jump in finance cost is not good
however net profit and eps increasing ....
Technically good opportunity to buy
Note:
Don’t put all your money in one trade
Risk 5-10% of your portfolio
Monthly Closing isnt that bad.AIRLINK
Closed at 149.60 (29-08-2025)
Monthly Closing isnt that bad.
However, retesting around 140 - 143
is possible.
If some bullish candles are formed on this level,
we may witness 175 - 180 again.
Even in worst case, it should not break 116.

Airlink📌 Trading Plan (For Swing Traders)
Bullish Scenario (Higher Probability):
If price holds above 145–148, expect bounce toward 170 first, then 200–210.
Pattern confirmation comes if it breaks 170 with volume.
Bearish Scenario (Risk):
Breakdown below 145 could trigger deeper correction to 130.
Risk Management:
Ideal stop-loss below 142–143.
Reward-to-risk ratio is attractive if targeting 200+.

Airlink📌 **Swing Trading Plan – AIRLINK (PSX, 4H)**
**1. Entry Levels**
* **Aggressive Entry**: Current zone **168–170** (near breakout level).
* **Safer Entry (on dip)**: Around **160–162** (Fib 0.382 retracement + support zone).
**2. Stop-Loss (Risk Management)**
* **Tight SL**: Below **158** (just under Fib 0.382 support).
* **Safer SL**: Below **150** (Fib 0.618 + breakout invalidation).
**3. Targets**
* **Target 1**: **175** (recent swing high).
* **Target 2**: **186** (Fib -0.27 extension).
* **Target 3**: **200** (Fib -0.618 extension + psychological level).
**4. Risk-Reward (Approximate)**
* If entry at **162**, SL at **150** (risk \~12 pts):
* T1 = 175 → Reward 13 pts → **RR ≈ 1:1**
* T2 = 186 → Reward 24 pts → **RR ≈ 2:1**
* T3 = 200 → Reward 38 pts → **RR ≈ 3:1**
This is a **good swing setup** if you aim for mid to higher targets.
**5. Strategy Notes**
* Since RSI is **overbought**, an initial pullback is possible. Best strategy is to **scale in gradually** (partial buy at 168–170, add more near 160–162 if tested).
* Trail your stop-loss upwards once price breaks **175** to lock profits.
* Watch **volume** – if it dries up significantly on pullbacks, that’s bullish (healthy correction).
✅ **Summary:**
Swing entry around **162–170**, SL below **150–158**, upside targets **175 → 186 → 200**. Risk/reward improves significantly if you catch a dip entry near **160–162**.
-

AIRLINK PSX Airlink is ready to breakout from triangle after being in range for a while, the quarterly report is still pending.

AIRLINK – TECHNICAL BUY CALL | 13 AUGUST 2025 (1-DAY TF) The stoAIRLINK – TECHNICAL BUY CALL | 13 AUGUST 2025 (1-DAY TF)
The stock previously marked a high of Rs. 228 and has been taking support from an ascending line at Rs. 122. After a recent high, the stock went into a long pullback, touched below the ascending line, and reversed upwards, indicating a potential bullish move.

AIRLINKAIRLINK – Daily Chart: Descending Channel Breakout Setup 📉➡📈
Technical Picture
Price has been respecting a downward-sloping channel for several weeks
The lower highs and lower lows defined the downtrend until recently. breaking out!
Now,
Breakout confirmation: 🚀
Upper Cap done!
Volume expansion on breakout day
Buy on retracement or use buy stop order 140 150 or buy agressively from CRP (current market price)
Retest buy zone: PKR 138–140 after breakout 🛡
Short-term target: PKR167 🎯
Medium-term target: PKR 180 and 186 if momentum holds ⛰
Medium-term target: PKR 200 and 228 if momentum holds ⛰
Fundamentals Still Solid & Confirmed
Xiaomi Smart TVs: Local assembly started Jan 2025 via subsidiary Select Technologies.
Earnings: FY24 Revenue +162%, PAT +242%, EPS Rs 7.74, Dividend Rs 6.
Product Range: Samsung, Xiaomi, Apple, Tecno, Acer, wearables — keeps diversification strong.

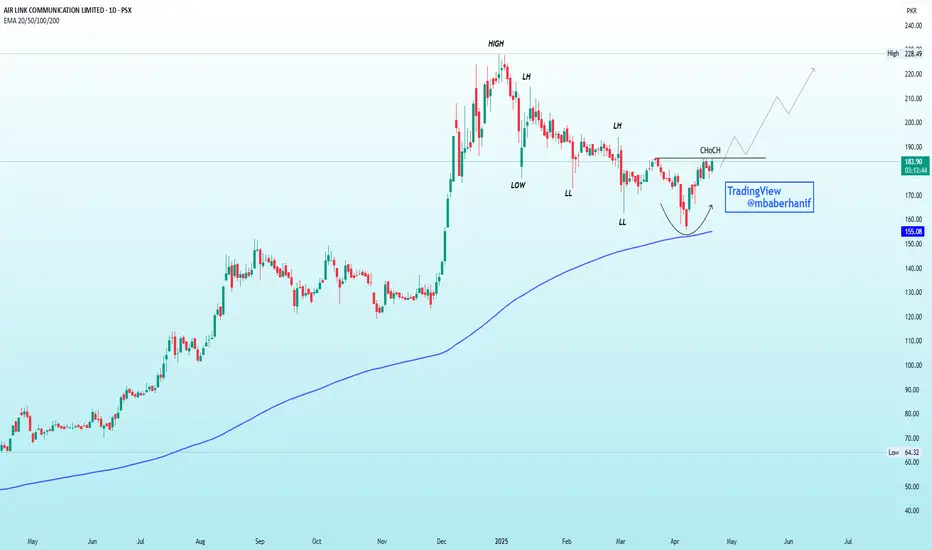
AIRLINK | An Imminent Reversal!!!Previous Trend: Bearish, confirmed by Lower Highs (LH) and Lower Lows (LL).
CHoCH (Change of Character): Bullish signal—price broke previous LH.
Pattern: Rounded bottom forming near the 200 EMA (~155), acting as strong support.
Volume: Slight pickup near bottom—early sign of accumulation.
Outlook: Bullish reversal likely. Break above CHoCH with volume confirms uptrend.
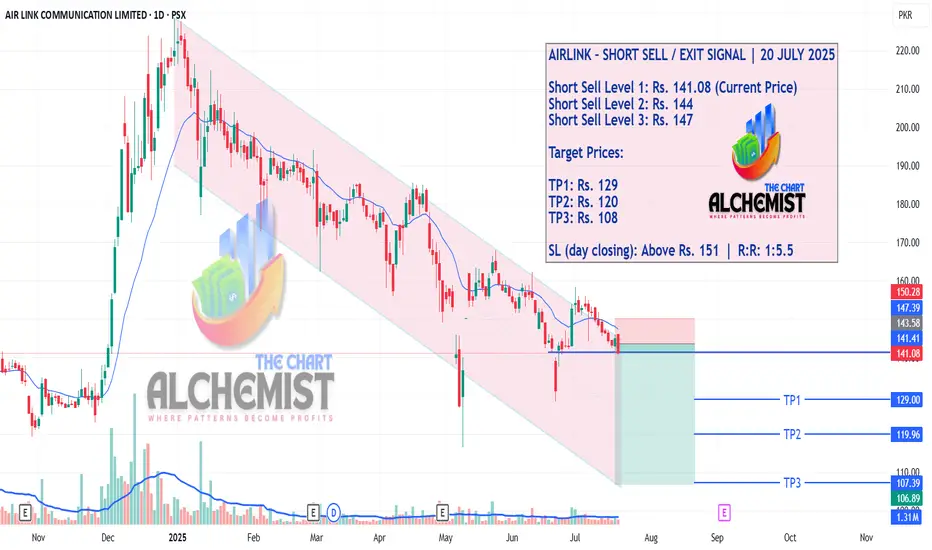
AIRLINK – SHORT SELL / EXIT SIGNAL | 20 JULY 2025AIRLINK – SHORT SELL / EXIT SIGNAL | 20 JULY 2025
AIRLINK has been trading inside a defined downward bearish channel, shaded in light pink. The stock recently tested the 20 EMA and failed to sustain higher levels, indicating that it may now begin a fresh downward leg. This setup presents a high-probability short sell or exit opportunity with clearly mapped downside targets.
AIRLINK DTFIf the marked Grey zone breaks, then next possible supports price levels can be 135-137, 125-129 and 120. Grey zone slightly breached as has been witnessed previously BUT 137-138 is a MUST level to sustain in my view.

Play on Levels.AIRLINK Closed at 152.83 (03-07-2025)
Immediate Resistance is around 156 - 159
Crossing & Sustaining this level may lead
it towards 175 - 177 & then may be towards
200+
Support seems to be around 145 - 146 & then
around 134 - 135.
This time it should not break 128.

SHORT SELL AIRLINKAIRLINK is in Downtrend since January 2025.
It has recently tried to Breakout of the downward channel but failed to post a higher high
It has created a double top instead
Short Airlink 166-177
TP1 156
TP2 143
SL 186
Live Buying Signal in Airlink This is live Khareedo (Buy) signal in Airlink at 168.99, Lets see how long it will go.
Note: This is not a buy/sell call, Trade at your own analysis and will. Use stop loss too.

Play on Levels169 - 175 can be a Good Support Area.
Better Financial Results.
Should not Break 161 even in Worst Cases.
Crossing 187 may lead it towards 200 - 203.

Good Financial Results.169 - 175 can be a Good Support Area.
Better Financial Results.
Should not Break 162 even in Worst Cases.
Crossing 180 may lead it towards 190 - 193.

Perfect ABCD Pattern on Weekly TF.Perfect ABCD Pattern on Weekly TF.
161 - 165 is a Good Support now.
Next Important Support level is around 143 - 145.
Company Directors' are themselves buying this
share @ around 171.

Airlink Technical Analysis: Potential Bullish SetupAirlink is moving in an uptrend, holding above a trendline, and is currently testing the 0.5 Fibonacci retracement level, a common area of support where buyers often step in. Price is also testing the 89-day EMA, a Fibonacci number that has historically acted as support, reinforcing the bullish outlook. Airlink is also a fundamentally strong company.
Trading Recommendations:
Buy 1 (CMP): 178
Buy 2: 166
Stop-Loss (Conservative): Closing below 118 (below the most recent higher low)
Stop-Loss (Aggressive): Closing below 140 (horizontal support level & below trendline)
Take Profit 1: 226
Take Profit 2: 268
Take Profit 3: Open
Happy trading!

Currently at ResistanceCurrently at Immediate Resistance.
Should not break 175.
208 - 210 can be witness if 198 - 199 is
Crossed & Sustained.
Bull run will resume once 228 - 230 is Crossed
with Good volumes.
