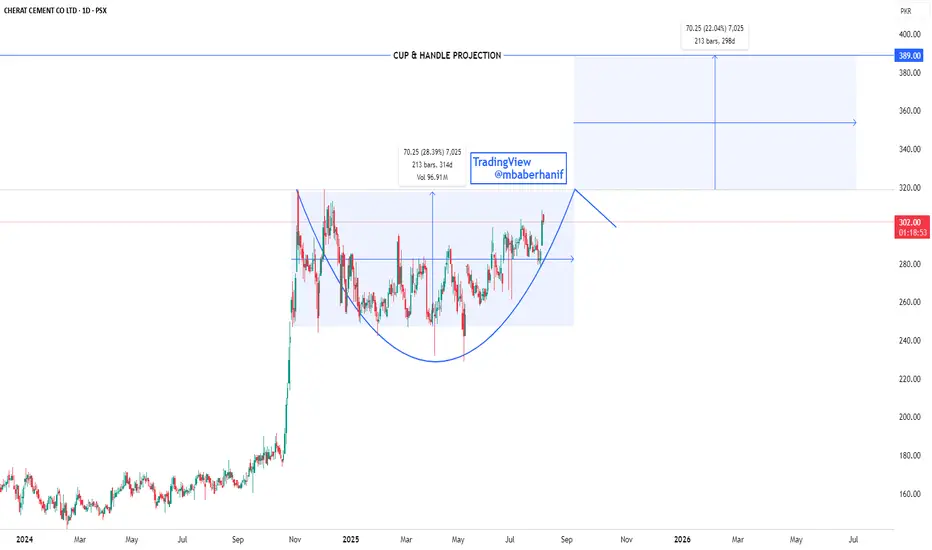
Pattern Breakout Watch: CHCC Aims for New HighsCHCC on the daily timeframe is showcasing a well-formed Cup and Handle pattern, a classic bullish continuation setup that signals accumulation before a breakout. The price has completed the rounded base of the cup and is currently approaching the neckline resistance near PKR 305. A confirmed breakou
Next report date
—
Report period
—
EPS estimate
—
Revenue estimate
—
40.66 PKR
8.68 B PKR
37.81 B PKR
134.30 M
About Cherat Cement Co. Ltd.
Sector
Industry
CEO
Azam Faruque
Website
Headquarters
Karachi
Founded
1981
ISIN
PK0029801013
FIGI
BBG000GMS6B7
Cherat Cement Co. Ltd. engages in the manufacture, marketing, and sale of cement. It focuses on clinker and cement production. The company was founded on May 25, 1981 and is headquartered in Karachi, Pakistan.
Related stocks
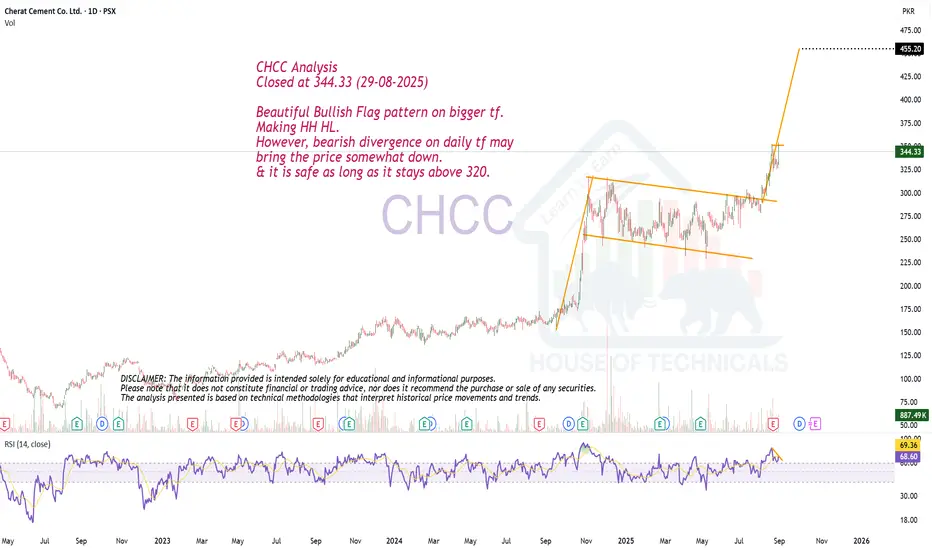
Beautiful Bullish Flag pattern.CHCC Analysis
Closed at 344.33 (29-08-2025)
Beautiful Bullish Flag pattern on bigger tf.
Making HH HL.
However, bearish divergence on daily tf may
bring the price somewhat down.
& it is safe as long as it stays above 320.
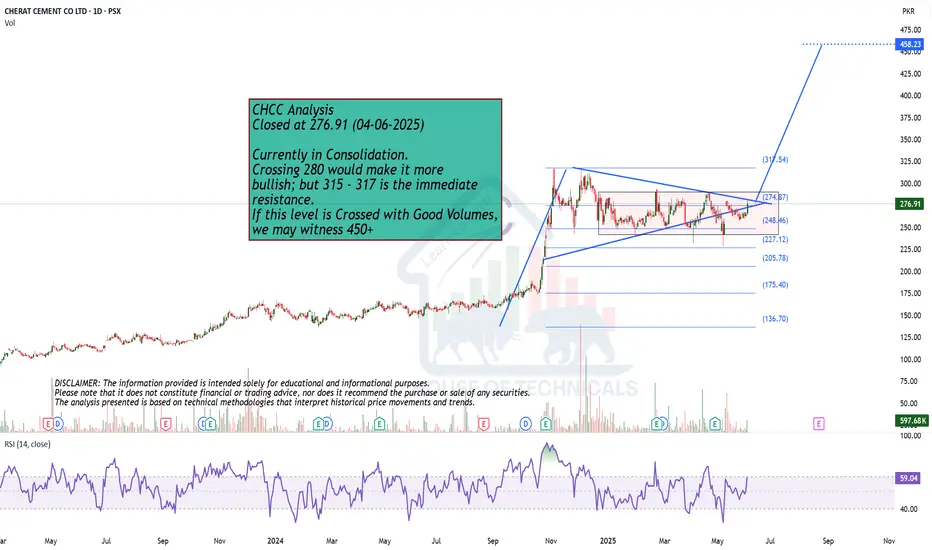
Currently in Consolidation.
Closed at 276.91 (04-06-2025)
Currently in Consolidation.
Crossing 280 would make it more
bullish; but 315 - 317 is the immediate
resistance.
If this level is Crossed with Good Volumes,
we may witness 450+

Finally my Bullish Position executed for #CHCCChirat Cement has great financials. Over previous 10 years its CAGR is 14% which is fairly enough for me to put a tick mark on its financials.
I was waiting for this position 159 since 10 December 2025 . Today on 17th January 2025 it came to my zone made a small flag.
My target is around 392


CHCC - PSX - Buy Call - Trend AnalysisAfter a sharp bull run of 7 days, as such there is no sign of reversal or retracement yet, as there is no divergence on RSI and Klinger is also showing bull run. Therefore, one may continue entering the trade.
However, for me price should come down a bit at around 236~246 level. Then after staying

CHCC - PSX -Daily Buy Trade CallCHERAT CEMENT
Klinger is above Zero indicating Bullish trend. However, Blue line is yet to cross green line - once it does so, bull run will take momentum.
RSI indicator suggests a Hidden Bullish Divergence means continuation of an uptrend.
Technically correct entry will be after price reaches 18

CHCC:- BULLICH TREND TO CONTINUEThe script has been in bull run. Since the start of this year the scrurity has not been able to cross over the 170. In this process the triangle has been formed which is a continuation pattern. SL in this scenario is 141 and TP is 195.
Due diligence and strict money managament is solicited.
Have a

See all ideas
Summarizing what the indicators are suggesting.
Neutral
SellBuy
Strong sellStrong buy
Strong sellSellNeutralBuyStrong buy
Neutral
SellBuy
Strong sellStrong buy
Strong sellSellNeutralBuyStrong buy
Neutral
SellBuy
Strong sellStrong buy
Strong sellSellNeutralBuyStrong buy
An aggregate view of professional's ratings.
Neutral
SellBuy
Strong sellStrong buy
Strong sellSellNeutralBuyStrong buy
Neutral
SellBuy
Strong sellStrong buy
Strong sellSellNeutralBuyStrong buy
Neutral
SellBuy
Strong sellStrong buy
Strong sellSellNeutralBuyStrong buy
Displays a symbol's price movements over previous years to identify recurring trends.
Frequently Asked Questions
The current price of CHCC is 331.00 PKR — it has decreased by −0.77% in the past 24 hours. Watch Cherat Cement Co. Ltd. stock price performance more closely on the chart.
Depending on the exchange, the stock ticker may vary. For instance, on PSX exchange Cherat Cement Co. Ltd. stocks are traded under the ticker CHCC.
CHCC stock has fallen by −1.36% compared to the previous week, the month change is a −7.19% fall, over the last year Cherat Cement Co. Ltd. has showed a 29.81% increase.
We've gathered analysts' opinions on Cherat Cement Co. Ltd. future price: according to them, CHCC price has a max estimate of 606.00 PKR and a min estimate of 450.15 PKR. Watch CHCC chart and read a more detailed Cherat Cement Co. Ltd. stock forecast: see what analysts think of Cherat Cement Co. Ltd. and suggest that you do with its stocks.
CHCC reached its all-time high on Sep 8, 2025 with the price of 390.00 PKR, and its all-time low was 22.17 PKR and was reached on Aug 16, 2019. View more price dynamics on CHCC chart.
See other stocks reaching their highest and lowest prices.
See other stocks reaching their highest and lowest prices.
CHCC stock is 3.16% volatile and has beta coefficient of 0.61. Track Cherat Cement Co. Ltd. stock price on the chart and check out the list of the most volatile stocks — is Cherat Cement Co. Ltd. there?
Today Cherat Cement Co. Ltd. has the market capitalization of 64.20 B, it has decreased by −4.92% over the last week.
Yes, you can track Cherat Cement Co. Ltd. financials in yearly and quarterly reports right on TradingView.
Cherat Cement Co. Ltd. is going to release the next earnings report on Feb 13, 2026. Keep track of upcoming events with our Earnings Calendar.
CHCC net income for the last quarter is 2.10 B PKR, while the quarter before that showed 1.85 B PKR of net income which accounts for 13.40% change. Track more Cherat Cement Co. Ltd. financial stats to get the full picture.
Cherat Cement Co. Ltd. dividend yield was 1.89% in 2025, and payout ratio reached 12.31%. The year before the numbers were 4.29% and 24.73% correspondingly. See high-dividend stocks and find more opportunities for your portfolio.
As of Oct 29, 2025, the company has 945 employees. See our rating of the largest employees — is Cherat Cement Co. Ltd. on this list?
EBITDA measures a company's operating performance, its growth signifies an improvement in the efficiency of a company. Cherat Cement Co. Ltd. EBITDA is 14.23 B PKR, and current EBITDA margin is 36.88%. See more stats in Cherat Cement Co. Ltd. financial statements.
Like other stocks, CHCC shares are traded on stock exchanges, e.g. Nasdaq, Nyse, Euronext, and the easiest way to buy them is through an online stock broker. To do this, you need to open an account and follow a broker's procedures, then start trading. You can trade Cherat Cement Co. Ltd. stock right from TradingView charts — choose your broker and connect to your account.
Investing in stocks requires a comprehensive research: you should carefully study all the available data, e.g. company's financials, related news, and its technical analysis. So Cherat Cement Co. Ltd. technincal analysis shows the sell today, and its 1 week rating is buy. Since market conditions are prone to changes, it's worth looking a bit further into the future — according to the 1 month rating Cherat Cement Co. Ltd. stock shows the buy signal. See more of Cherat Cement Co. Ltd. technicals for a more comprehensive analysis.
If you're still not sure, try looking for inspiration in our curated watchlists.
If you're still not sure, try looking for inspiration in our curated watchlists.