CNERGY | Trade CallCNERGY is in uptrend making higher highs and higher lows, if it breaks and sustains 9.17 then a possible bullish wave towards 9.74 and then 10.46 can be seen.
−0.65 PKR
−3.58 B PKR
296.72 B PKR
2.38 B
About Cnergyico Pk Limited
Sector
Industry
CEO
Amir Abbassciy
Website
Headquarters
Karachi
Founded
1995
ISIN
PK0078401012
FIGI
BBG000NVFG03
Cnergyico PK Ltd. engages in the business of refining crude oil into saleable components. It operates through the Oil Refining Business and Petroleum Marketing Business segment. The Oil Refining Business segment includes crude oil refining and selling of refined petroleum products to oil marketing companies. The Petroleum Marketing Business segment involves the trading of petroleum products, procuring products from oil refining business as well as from other sources. The company was founded by Parvez Abbasi on January 9, 1995 and is headquartered in Karachi, Pakistan.
Related stocks

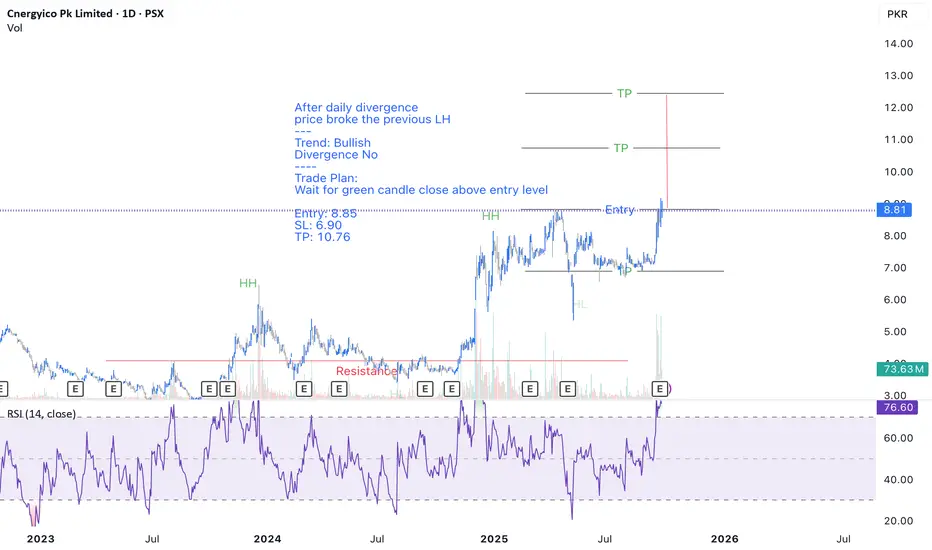
PSX - CNERGY - Long PositionAfter daily divergence
price broke the previous LH
---
Trend: Bullish
Divergence No
----
Trade Plan:
Wait for green candle close above entry level
Entry: 8.85
SL: 6.90
TP: 10.76
CNERGY SHORT TRADECNERGY has recently broken down of its upward trend line after encountering Bearish Breaker Block
It is expected to continue its new downtrend
Short CNERGY 7.8-8.1
TP 6.8
SL 8.9


CNERGY | Rising Wedge & Bearish Divergence!Two sign of danger
Rising Wedge Pattern and Bearish Divergence with Volume indicator
Rising Wedge Pattern:
Characteristics: Converging trend lines with higher highs and higher lows, narrowing range.
Interpretation: Bearish reversal pattern, weakening buying pressure.
Trading Strategy: Sho

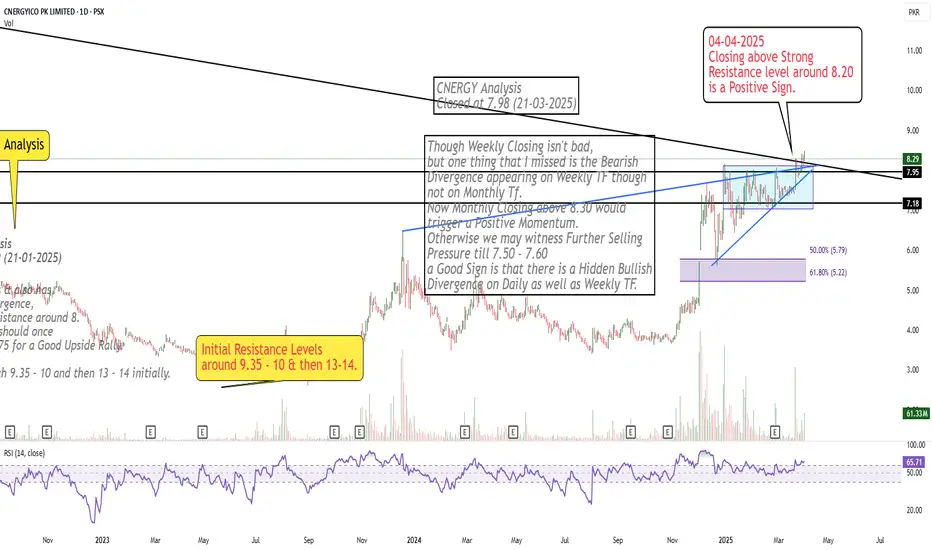
Crossed Important Resistance Area
Closing above Strong
Resistance level around 8.20
is a Positive Sign.
PSX- CNERGY : Breakout or Rejection? Trading Strategysignificant increase in volume is observed indicates accumulation by institutions or major market participants.
While Net volume remains negative (-8.06M), suggesting some selling pressure at higher levels.
Trading Strategy:
Short-Term Strategy
Buy on pullback when price retraces to 7.0 - 7.2 P

CNERGYTrend is Bulish. with Bulish Ascending triangle beark.
Trade Plan
Buy : 7.98
Stop Loss :5.50
TP: 10.54
RRR 1:1

CNERGY in a Bullish Flag PatternCnergy is moving and forming bullish flag pattern. Can go for Buy=7.58 or on breach of the flag with a SL =6.9 and TP =12

BYCO-Bullish Flag PatternByco is moving and forming bullish flag pattern. Can go for Buy=7.58 or on breach of the flag with a SL =6.9 and TP =12

See all ideas
Summarizing what the indicators are suggesting.
Oscillators
Neutral
SellBuy
Strong sellStrong buy
Strong sellSellNeutralBuyStrong buy
Oscillators
Neutral
SellBuy
Strong sellStrong buy
Strong sellSellNeutralBuyStrong buy
Summary
Neutral
SellBuy
Strong sellStrong buy
Strong sellSellNeutralBuyStrong buy
Summary
Neutral
SellBuy
Strong sellStrong buy
Strong sellSellNeutralBuyStrong buy
Summary
Neutral
SellBuy
Strong sellStrong buy
Strong sellSellNeutralBuyStrong buy
Moving Averages
Neutral
SellBuy
Strong sellStrong buy
Strong sellSellNeutralBuyStrong buy
Moving Averages
Neutral
SellBuy
Strong sellStrong buy
Strong sellSellNeutralBuyStrong buy
Displays a symbol's price movements over previous years to identify recurring trends.
Frequently Asked Questions
The current price of CNERGY is 8.43 PKR — it has decreased by −1.75% in the past 24 hours. Watch Cnergyico Pk Limited stock price performance more closely on the chart.
Depending on the exchange, the stock ticker may vary. For instance, on PSX exchange Cnergyico Pk Limited stocks are traded under the ticker CNERGY.
CNERGY stock has fallen by −0.82% compared to the previous week, the month change is a 16.92% rise, over the last year Cnergyico Pk Limited has showed a 124.80% increase.
CNERGY reached its all-time high on Jul 24, 2015 with the price of 31.16 PKR, and its all-time low was 2.60 PKR and was reached on Aug 31, 2023. View more price dynamics on CNERGY chart.
See other stocks reaching their highest and lowest prices.
See other stocks reaching their highest and lowest prices.
CNERGY stock is 4.53% volatile and has beta coefficient of 1.98. Track Cnergyico Pk Limited stock price on the chart and check out the list of the most volatile stocks — is Cnergyico Pk Limited there?
Today Cnergyico Pk Limited has the market capitalization of 47.13 B, it has increased by 5.52% over the last week.
Yes, you can track Cnergyico Pk Limited financials in yearly and quarterly reports right on TradingView.
CNERGY net income for the last quarter is −1.84 B PKR, while the quarter before that showed −2.99 B PKR of net income which accounts for 38.61% change. Track more Cnergyico Pk Limited financial stats to get the full picture.
No, CNERGY doesn't pay any dividends to its shareholders. But don't worry, we've prepared a list of high-dividend stocks for you.
As of Oct 10, 2025, the company has 983 employees. See our rating of the largest employees — is Cnergyico Pk Limited on this list?
EBITDA measures a company's operating performance, its growth signifies an improvement in the efficiency of a company. Cnergyico Pk Limited EBITDA is 9.70 B PKR, and current EBITDA margin is 3.46%. See more stats in Cnergyico Pk Limited financial statements.
Like other stocks, CNERGY shares are traded on stock exchanges, e.g. Nasdaq, Nyse, Euronext, and the easiest way to buy them is through an online stock broker. To do this, you need to open an account and follow a broker's procedures, then start trading. You can trade Cnergyico Pk Limited stock right from TradingView charts — choose your broker and connect to your account.
Investing in stocks requires a comprehensive research: you should carefully study all the available data, e.g. company's financials, related news, and its technical analysis. So Cnergyico Pk Limited technincal analysis shows the buy rating today, and its 1 week rating is buy. Since market conditions are prone to changes, it's worth looking a bit further into the future — according to the 1 month rating Cnergyico Pk Limited stock shows the strong buy signal. See more of Cnergyico Pk Limited technicals for a more comprehensive analysis.
If you're still not sure, try looking for inspiration in our curated watchlists.
If you're still not sure, try looking for inspiration in our curated watchlists.