DGKC - PSX - Technical AnalysisOn daily TF, DGKC has made almost a perfect Head & Shoulder reversal pattern whereby right shoulder is a bit higher than left - an indication that this reversal will continue and price will continue to drop.
CMP is 234.28 (on 24-Oct-2025) and if it does not bounce then Fair Value Gap (FVG) is quite below at 188~192 level; Trade values are depicted below and TP has been calculated based on height of Head. To draw the confluence, Klinger Oscillator also suggest that SCRIPT is in Bear Run and RSI indicator is also heading downwards.
Trade Values
Buy-1: 192
SL: 182
Buy-2: 242
Buy-3: 276
TP: 319
Trade ideas

DGKC – TECH BUY CALL | 1H | 13 OCT 2025DGKC – TECH BUY CALL | 1H | 13 OCT 2025 | By The Chart Alchemist
After breaking out of a converging triangle (marked light blue), DGKC entered a short bearish pullback (marked light pink channel). The stock found support near Rs. 230, formed a DB bull flag, and now exhibits strong signs of upward reversal.
📢 Technical Analysis by Mushtaque Muhammad (The Chart Alchemist).

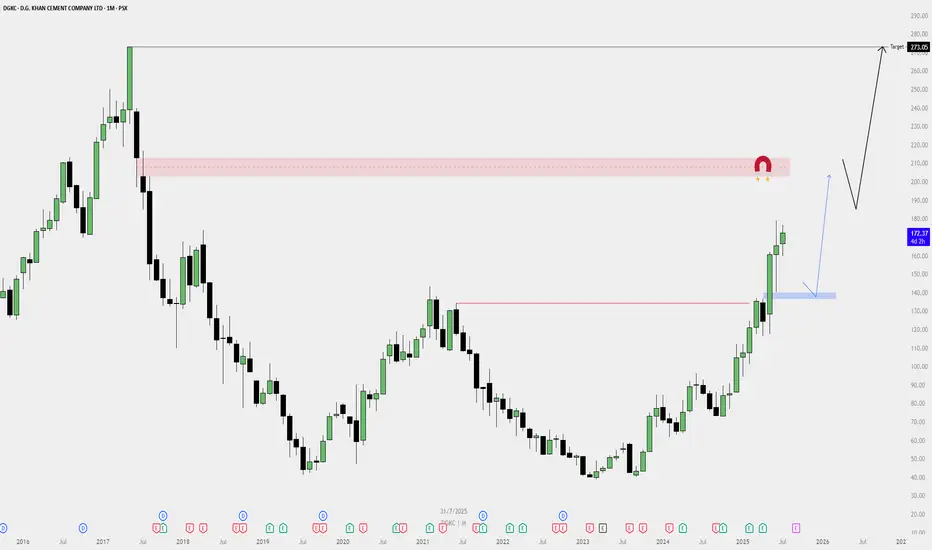
DGKC Monthly Buy Plan — Bullish Outlook📈 DGKC Monthly Buy Plan — Bullish Outlook
✅ Bias: Strongly Bullish
Price has broken major resistance levels with high momentum, forming a big bull trend on the monthly timeframe.
🔍 Key Observations:
Break of Structure:
Price broke past a major resistance zone (previous high).
Strong monthly green candles show institutional interest.
Demand Zone (Blue Box):
A fresh demand zone is formed — a possible area for pullback re-entry.
If price retests this zone, it may offer a high-probability long setup.
Liquidity Magnet Zone (Red Box):
A clear monthly imbalance / supply zone around the 210–220 range.
Could act as a temporary resistance before continuation.
Final Target:
Monthly inefficiency / liquidity target at 273.05, likely the final destination of the move.
Market structure suggests this level can be reached before any major reversal.
🔄 Plan Execution:
🔵 Scenario 1 (Pullback Entry):
Wait for a pullback to the blue demand zone.
Look for lower timeframe confirmation to enter long.
🔵 Scenario 2 (Momentum Continuation):
If price continues without deep pullback, consider smaller timeframes for continuation setups.
Do not chase price; wait for valid structure.
No Bearish Divergence yet...but..DGKC Analysis
CMP 242.40 (17-09-2025 12:34PM)
Extremely Bullish.
No Bearish Divergence yet. However,
Immediate Resistance is around 249 - 250.
Slight Bearish Divergence at this level may drag
the price towards 230ish.
272 - 275 is a Very Strong Resistance Level.
Crossing this level with good volumes, may expose
new highs.

DGKC LongCurrently the trendline and previous resistance level (173 - 179) are stopping it from going upward.
Fib 0.618 level is also near (184) which will be again a major hurdle before it goes further up towards 223 and 273.
However, RSI, MACD and Stoch are fine that suggest no extreme pressure for the price to go downwards yet.

PSX: DGKC - Monthly TF Long positionPSX: DGKC - Monthly time frame analysis
Promising fundamentals with possible three projected prices
DGKC – TECHNICAL BUY CALL (1H TF) | 11 AUGUST 2025DGKC – TECHNICAL BUY CALL (1H TF) | 11 AUGUST 2025
The stock is moving in a bullish channel marked with a light blue color, creating multiple bullish structures. We find it at a profitable position to enter a new buy trade.

DGKC – BUY SIGNAL | 01 AUGUST 2025 DGKC – BUY SIGNAL | 01 AUGUST 2025
The stock is trading in an upward bullish channel (marked light blue) and has previously completed two upward pushes. A third and final push is anticipated in this structure. Additionally, a high-probability buy setup has emerged, providing strong confluence for a bullish move.

DGCK next levelsDGCK next levels are 179.38, 200, 225 and 266
Note: This is not a buy/sell trade call.
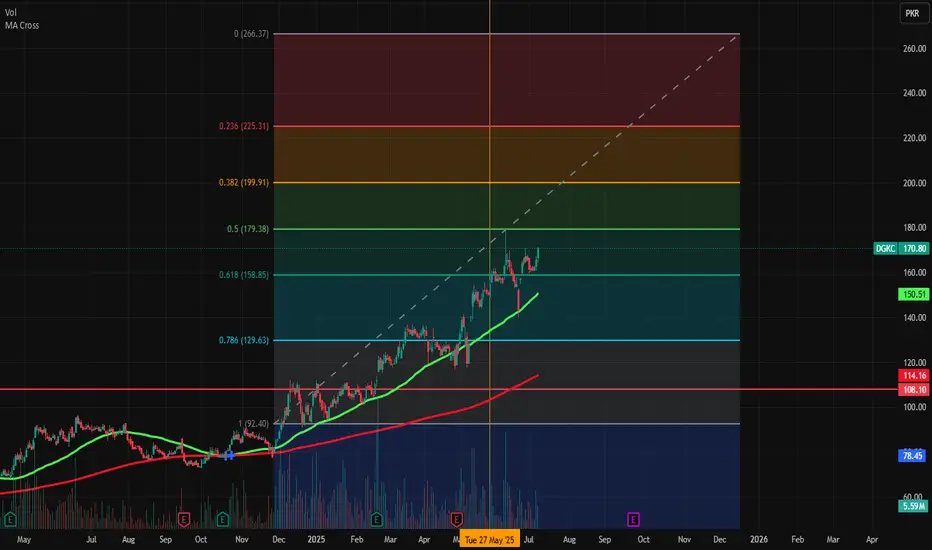
Currently trolling around channel resistance. Closed at 157.04 (05-06-2025)
Currently trolling around channel resistance.
Crossing 160 with Good volumes will bring more
positivity & upside price movement.
on the flip side, 151 - 152 & then 144 - 145 may
act as a Good Support.

DGKC LongRespecting its upward channel.
Immediate resistance at ~142.
Next target will be Fib 1.618 level i.e. ~204.
Immediate supports at 118 and 108

DGKC IN TRENDDGKC is breaking its monthly resistance and on shorter time frame there is a trendline resistance trade above the trendline and buy in parts once it breaks previous high this is a long trade on weekly time frame hold for several days

Bearish Divergence has appeared.
Bearish Divergence has appeared.
Better to wait for a better price
zone and a Support around 134-135
(if it comes).
Channel bottom is around 124 - 125 but
it seems unlikely so far. However, possibility
is still there.

DGKC SHORT TRADEDGKC has recently completed 5 Waves of Uptrend in a channel, it's last upward wave gave SOT ( Shortening of Thrust ) and also Up thrust or bull trap
It is currently going through corrective wave ABC, downward TP for which is around 116
Short DGKC 132-132
TP 116
SL 135

DGKC | Is This Cup & Handle Pattern?Here we have a classic pattern and price dynamics. A major high leads to a low and then a recovery wave. The recovery wave peaks before reaching the previous high and this reveals that a new drop is approaching.
Trading volume is low on the current rise and the latter part of it goes into a parabola. A parabola can only end in a retrace.
DGKC is now set to produce a correction, this correction is set to develop in the short- to mid-term.
RSI indicator if at over bought level while MACD is line is above the signal line, and can show a cross over which establish some negative stance on the price.
Fibonacci levels for the support are PkR123 (0.382 level) and PkR119 (0.5 level) from where a pull back can be expected
On the flip side, if the price gives a break out and closed above PkR137 level then only new bullish wave is expected.

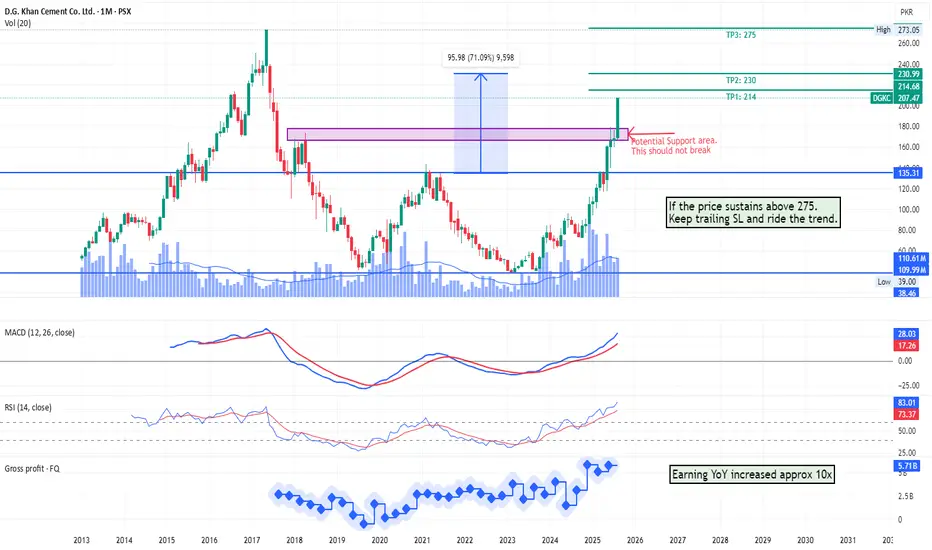
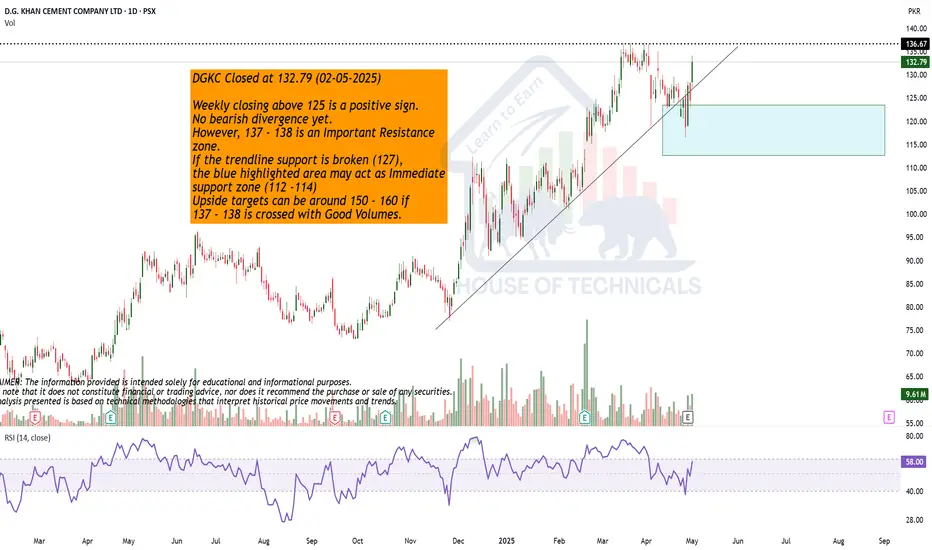
Play on Levels
Weekly closing above 125 is a positive sign.
No bearish divergence yet.
However, 137 - 138 is an Important Resistance
zone.
If the trendline support is broken (127),
the blue highlighted area may act as Immediate
support zone (112 -114)
Upside targets can be around 150 - 160 if
137 - 138 is crossed with Good Volumes.
DGKC entered into bullish zoneDGKC is entered into bullish zone,
Note: This is not a buy/sell trade call.

DGKC Long positionI shared the graph earlier where DGKC achieved all my targets from 82 to 107.
Now it has retraced at a very good rate, getting a 30% to 40% gain.
Stop Loss is 89 and targets are 126 and 133.

DGKC Trading Analysis:DGKC broke down after consolidating between 32-36 and is now trading at 124. The strategy is to exit if the price shows weakness when it revisits the 30-level mark.
Downside Targets:
1. *First target*: 110
2. *Second target*: 102
This analysis suggests a cautious approach, with a focus on managing risk and potential downside targets.

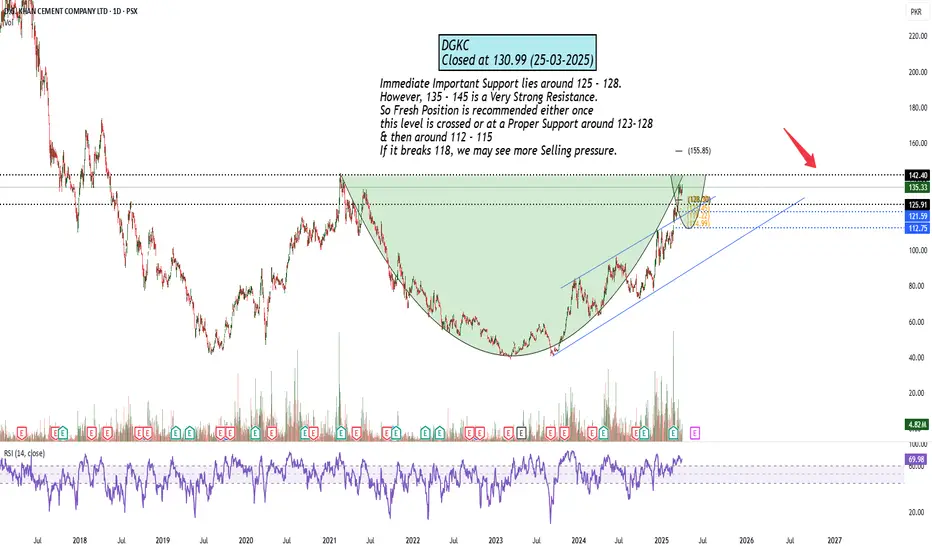
135 - 145 Important Resistance ZoneImmediate Important Support lies around 125 - 128.
However, 135 - 145 is a Very Strong Resistance.
So Fresh Position is recommended either once
this level is crossed or at a Proper Support around 123-128
& then around 112 - 115
If it breaks 118, we may see more Selling pressure.
Play on LevelsImmediate Important Support lies around 125 - 128.
However, 135 - 145 is a Very Strong Resistance.
So Fresh Position is recommended either once
this level is crossed or at a Proper Support around 123-128
& then around 112 - 115
If it breaks 118, we may see more Selling pressure.


Market Trends Favor DGKC: A 40% Gain in Sight?it is up against a multi-week resistance line once again, Several industry peers have already surged past key levels and Some of the producers already broke out and DGKC eventually shall follow suit. I personally expect DGKC to quadruple without much effort upon breakout to gain 40%.
