DGKC Hits New Highs! Breakout or Reversal Ahead?D.G. Khan Cement (DGKC) is showing strong bullish momentum, breaking past key resistance levels. Currently trading around 126.68 PKR, the stock is hovering near a crucial breakout zone at 127 PKR. If it sustains above this level with volume, we could see further upside. However, a failure to hold could lead to a pullback towards key Fibonacci retracement levels.
The Golden Ratio (0.618 level at 113.46 PKR) is a significant support zone, often considered an ideal level for potential reversals. Other support levels include 121-118 PKR (0.236 and 0.382 Fibonacci levels), which could act as strong demand zones if a correction occurs.
Meanwhile, the Relative Strength Index (RSI) is near overbought territory, indicating strong buying pressure but also a potential risk of short-term exhaustion. If bulls maintain control and push beyond 127 PKR, DGKC could enter a new rally phase. However, if the price faces resistance, we might see a healthy retracement before another move higher.
With the stock at a decisive point, traders must watch whether this breakout sustains or turns into a false signal. Will DGKC continue its bullish trend, or is a correction on the horizon? Let me know your thoughts below!
Trade ideas

DgkcFinally starting to rally after long consolidation.potential leader if this bull market continues.

DGKC ACCUMULATION BOX TRADE IDEADGKC IS TRADING IN A ACCUMULATION BOX. HALF YR RESULT WILL BE ANNOUNCED TODAY. EXPECTING GOOD RESULTS WHICH WILL BREAK THE ACCUMULATION BOX.
THE REAL REISTANCE IS AT 108.20 WHICH IS THE WEEKLY PREVIOUS HIGHER LOW AFTER WHICH THE STOCK WENT DOWN to all time low.
HOWEVER THERE IS A DEVIATION FROM 109 TO 112.
AT THE BREAKOUT AT 112 WITH LARGE VOLUMES will start the uptrend
A retest might be possible at the top of accumualation box at 112. Watch on 5m and 15m The EMA 21 is currently acting as a support.
the next quick target will be 116 . If the stock gives a strong breakout above 116 then 122 looks like the next target.

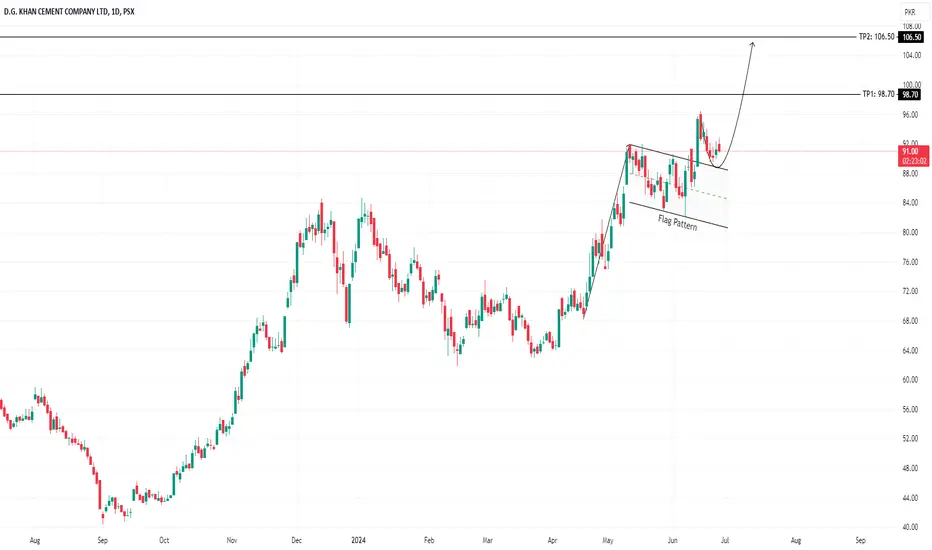
Series of HH HLBeautiful HH HL formation.
It may give a good move upside if retrace till 90-91.
Upside targets can be 128 - 130 & then 143 - 145.
However, 109 - 110 is an Important Resistance level.

DGKC ID Chart PSX - Ascending Triangle Buy StrategyDGKC ID Chart - Ascending Triangle Buy Strategy:
- Buy at Current Price: Enter the trade at the current market price.
- Stop Loss: Set a stop loss at 101 to minimize potential losses.
- Take Profit 1 (TP1): Target a first take profit at 132.
- Take Profit 2 (TP2): Set a second take profit at 153 for additional gains.
- "DGKC has delivered impressive results, showcasing strong financial performance and growth."
- "The company's strategic initiatives have paid off, resulting in robust earnings and market confidence."
- "DGKC continues to exceed expectations, reinforcing its position as a leader in the cement industry."
Happy Trading.

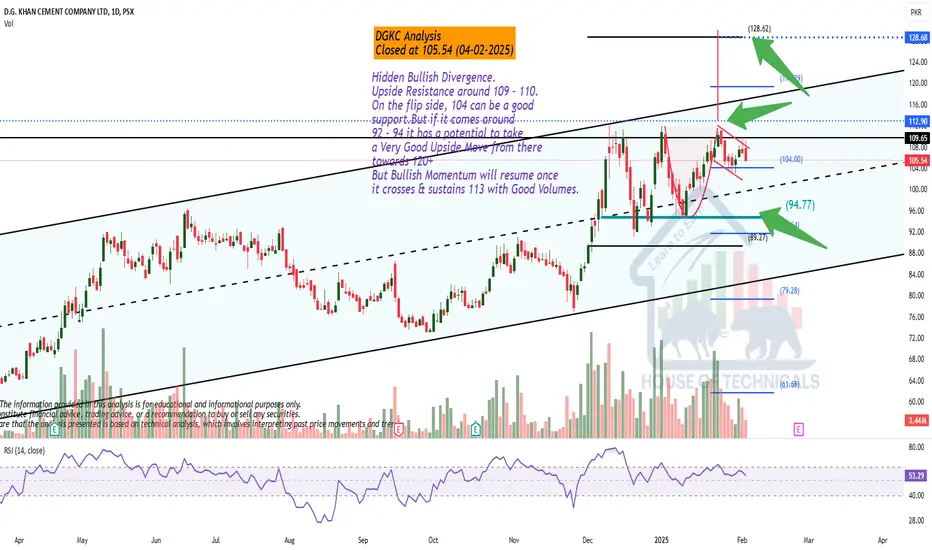
Hidden Bullish Divergence.Hidden Bullish Divergence.
Upside Resistance around 109 - 110.
On the flip side, 104 can be a good
support.But if it comes around
92 - 94 it has a potential to take
a Very Good Upside Move from there
towards 120+
But Bullish Momentum will resume once
it crosses & sustains 113 with Good Volumes.
DGKC Long on 1HDGKC has printed bullish divergence on RSI on 1H timeframe and has broken previous LH and downward trendline indicting a short term Long position until R1. My entry, TP and SL are marked on the chart.

DGKC a potential trade with 10% profitDGKC in PSX in hourly time frame has closed above EMA50 on Friday with current price of 99.75. If viewed closely, the channel formed from 20th December bottom is intact. previous high price is around 110.
In Monday's session, it is expected to stay above EMA50 which is 100 now, buying here with a target of 110 or channel top is around 113 can give 10% plus profit in a shorter period.
MACD, RSI and my own combined indicators are adding support to this view.

DGKC PSX IDEABased on previous bull run and support and resistance, DGKC looks good for long-term investment.

Beautiful Bullish Engulfer on Daily TF.Beautiful Bullish Engulfer on Daily TF.
61.8% fib retracement done around 90.50 - 91
Stock is Still Bullish on Bigger Time Frames.
If 96 is Sustained, we may easily wintess an
upside around 103 - 105 initially.

DGKC-LONGDGKC is trading in a bullish trend and now price has started reversal after correction so we will take long entry at CMP

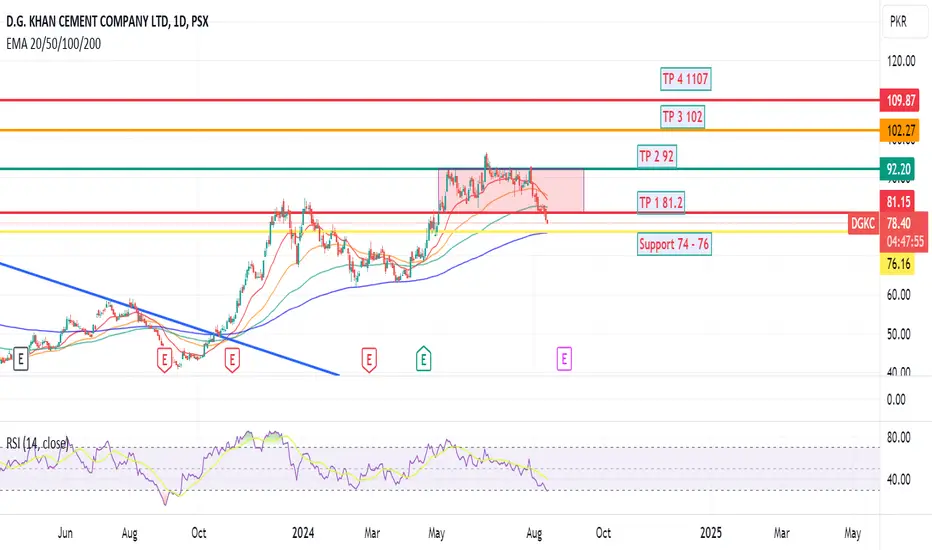
DGKC ready for long positionDGKC is taking continuous support from daily EMA 200.
RSI is around 30 so ready to make a move.
TPs and support is showing in the chart
DGKC Trade1. Bulish trend
2. break of continution pattern
3. break of resistance and sustane
4. no bearish divergence
5. long trade
6. TPs hit 40% increase


DGKC potential Buy setupReasons for bullish bias:
- Price gave a bullish closing above the weekly support level
- Price bounced from fib golden pocket
- Price gave downward trendline breakout
- AB = CD pattern can be seen, if price give resistance (also TP1) breakout, then next target can be considered at point D(approx. 105)
- Overall a bullish trend on daily
- Bullish divergence
Here are the recommended trading levels:
Buy 1: 87.03 (CMP)
Buy 2: 81.5
Stop Loss Level: 72.04
Take Profit Level 1: 96.5
Take Profit Level 2: Open
Happy Trading

DGKC is BullishThe macro trend was bullish, however the price went down for retracement and was respecting a descending trendline since August, however now it has given a breakout after the emergence of bullish divergence. Bulls seem to be in complete control of the price action and previous lower high is also broken successfully, hence we can expect new highs as per Dow theory. Moreover, the reversal also came from 0.67 of Fib retracement which is a potential reversal zone for AB = CD projection. Targets are mentioned on the chart.

DGKC can cross 80 and above levelsYesterdays results and move from 73 to 80 yesterday and today maintaining support in 78 and 79 levels. It could cross these defined levels in few days.

DGKC future presiction Currently its in middle, 50% position to move up or down,
Next week will see
I will make complete video on it

Bearish Divergence on Weekly TF.
Already made a Lower High on Daily TF.
If 75 is not Sustained on Weekly Basis,
we may witness 66 - 68.


PSX DGKC ReversalPrice taking support around 78 level.
Divergence being formed
Can take position when the price crosses 81 or MACD Blue line crossing above orange line or both.

* Bullish on Weekly as well as Monthly TF.
* 94 - 96 is a Strong Resistance for now.
* On the flip side, 90 - 91 may act as a
Strong Support.
* If 96 is Sustained, we may witness 105 - 106
initially.
* For Swing Traders, 82 should be the Stoploss
on Closing basis.