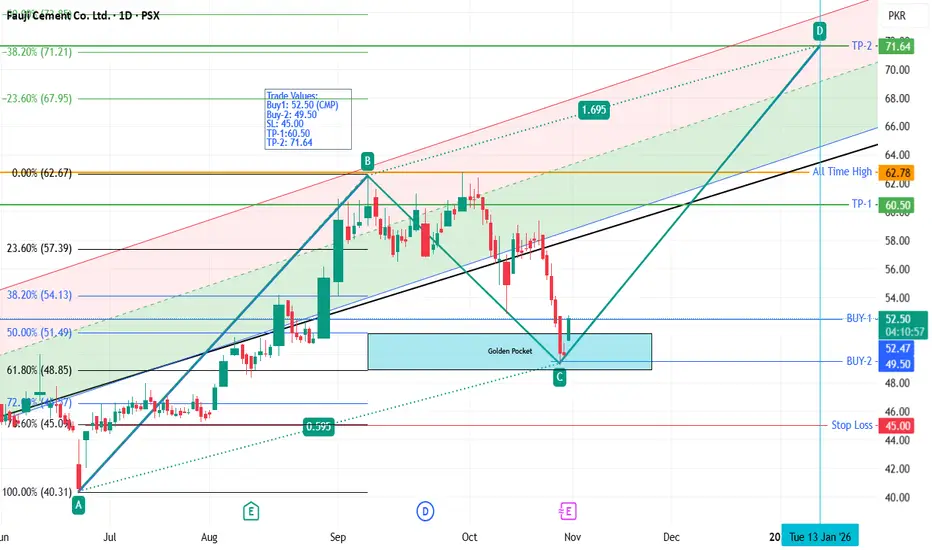
FCCL - PSX - Buy Call - ABCD PatternFauji Cement Co. Ltd. after making substantial retracement has fallen into Golden pocket and now has bounced from there.
AB=CD harmonic pattern has been drawn to arrive to the TP.
Trade Values:
Buy1: 52.50 (CMP)
Buy-2: 49.50
SL: 45.00
TP-1:60.50
TP-2: 71.64
Next report date
—
Report period
—
EPS estimate
—
Revenue estimate
—
5.45 PKR
13.33 B PKR
88.96 B PKR
814.12 M
About Fauji Cement Co. Ltd.
Sector
Industry
CEO
Qamar Haris Manzoor
Website
Headquarters
Rawalpindi
Founded
1992
ISIN
PK0074501013
FIGI
BBG000BYS494
Fauji Cement Co. Ltd. engages in the manufacture and sale of cement. Its products include ordinary portland cement, low alkali ordinary portland cement, and sulphate resistant cement. The company was founded on November 23, 1992 and is headquartered in Rawalpindi, Pakistan.
Related stocks
FCCL – TECHNICAL BUY CALL | 19 SEPT 2025 (1H TIME FRAME) FCCL – TECHNICAL BUY CALL | 19 SEPT 2025 (1H TIME FRAME)
The stock is in an uptrend and recently marked a high of Rs. 62.6, followed by a lateral pullback. The pullback now appears to be over, and the stock is expected to move upward toward multiple quantified displacement targets.

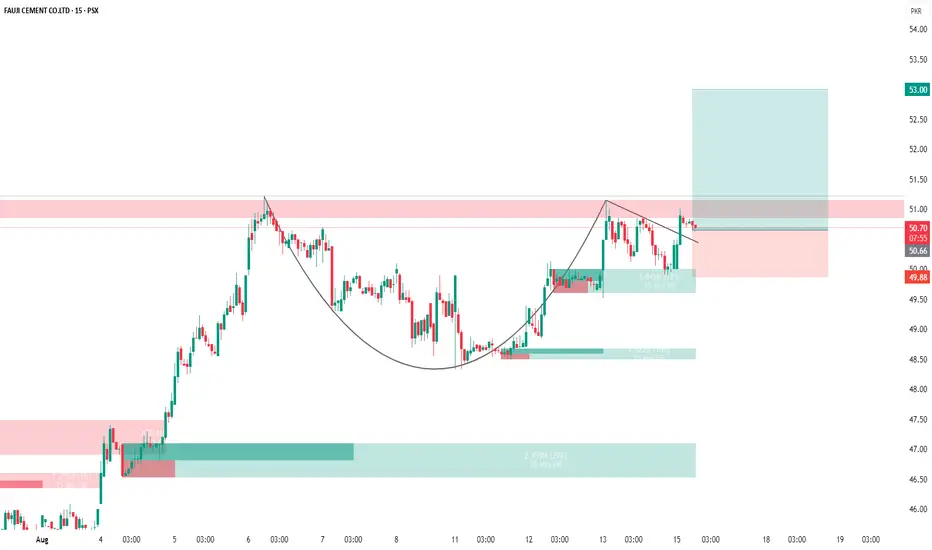
FCCL – Cup & Handle Breakout Setup Towards 53FCCL is forming a bullish cup and handle pattern on the 15-minute chart, with price currently testing the neckline resistance near the 51 level. A breakout above this zone could trigger upward momentum toward the target area around 53, as indicated by the projected move. The handle’s consolidation s
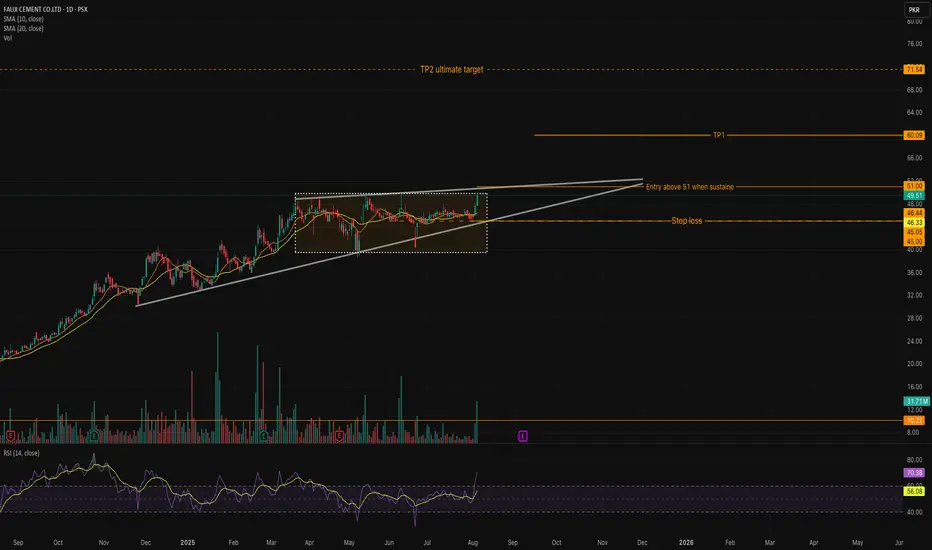
FCCL – Breakout Watch!Pattern: Ascending Triangle | Timeframe: 1D | Sector: Cement
After weeks of consolidation, FCCL is finally knocking on the resistance door. With strong volume and momentum, a breakout could unlock serious upside potential! 📈
🔍 Setup Overview:
✅ Breakout Level: 51.11 – Key resistance to watch. Entr

FCCL Breakout Watch: A Strong Setup Brewing!After months of consolidation within a well-defined ascending triangle, FCCL is showing signs of life again! The stock has just broken out of its horizontal range with a strong bullish candle and surge in volume – signaling momentum may be shifting upward. 💥
🔍 Key Highlights:
✅ Price has reclaimed
FCCL - accumulation phasePositive trend for FCCL in daily, weekly and monthly time periods.
Accumulate FCCL between 51 to 58 range.
Ride EMA 9 till reversal of trend.

PSX: FCCL - Long position - Monthly TFPSX: FCCL All time high projections
Long position in FCCL.
Concerns:
RSI bearish divergence on monthly

FCCL – TECHNICAL BUY CALL (15M TF) | 12 AUGUST 2025FCCL – TECHNICAL BUY CALL (15M TF) | 12 AUGUST 2025
This call overrides all previous calls and higher timeframes.
Accumulation Phases
The stock traded in a yellow accumulation zone and then formed another accumulation phase in a blue channel at the top of the yellow zone.
The blue channel acted a

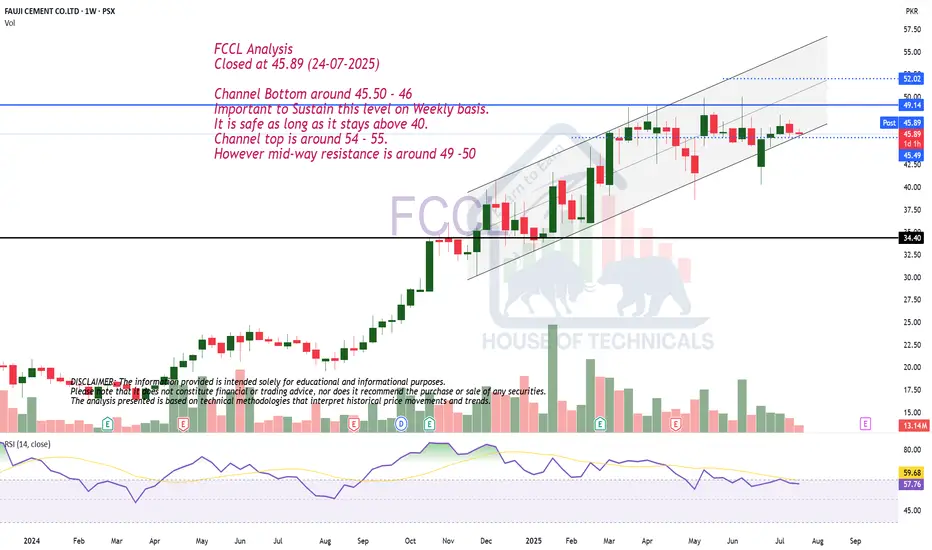
Channel TradingFCCL Analysis
Closed at 45.89 (24-07-2025)
Channel Bottom around 45.50 - 46
Important to Sustain this level on Weekly basis.
It is safe as long as it stays above 40.
Channel top is around 54 - 55.
However mid-way resistance is around 49 -50
FCCL LongGolden cross on weekly time frame. RSI has cooled down and is ready to take off again.
Possible target is 77.

See all ideas
Summarizing what the indicators are suggesting.
Neutral
SellBuy
Strong sellStrong buy
Strong sellSellNeutralBuyStrong buy
Neutral
SellBuy
Strong sellStrong buy
Strong sellSellNeutralBuyStrong buy
Neutral
SellBuy
Strong sellStrong buy
Strong sellSellNeutralBuyStrong buy
An aggregate view of professional's ratings.
Neutral
SellBuy
Strong sellStrong buy
Strong sellSellNeutralBuyStrong buy
Neutral
SellBuy
Strong sellStrong buy
Strong sellSellNeutralBuyStrong buy
Neutral
SellBuy
Strong sellStrong buy
Strong sellSellNeutralBuyStrong buy
Displays a symbol's price movements over previous years to identify recurring trends.
Frequently Asked Questions
The current price of FCCL is 52.75 PKR — it has increased by 1.01% in the past 24 hours. Watch Fauji Cement Co. Ltd. stock price performance more closely on the chart.
Depending on the exchange, the stock ticker may vary. For instance, on PSX exchange Fauji Cement Co. Ltd. stocks are traded under the ticker FCCL.
FCCL stock has fallen by −0.28% compared to the previous week, the month change is a −2.06% fall, over the last year Fauji Cement Co. Ltd. has showed a 64.95% increase.
We've gathered analysts' opinions on Fauji Cement Co. Ltd. future price: according to them, FCCL price has a max estimate of 77.51 PKR and a min estimate of 70.00 PKR. Watch FCCL chart and read a more detailed Fauji Cement Co. Ltd. stock forecast: see what analysts think of Fauji Cement Co. Ltd. and suggest that you do with its stocks.
FCCL reached its all-time high on Sep 30, 2025 with the price of 62.84 PKR, and its all-time low was 4.83 PKR and was reached on Jan 7, 2013. View more price dynamics on FCCL chart.
See other stocks reaching their highest and lowest prices.
See other stocks reaching their highest and lowest prices.
FCCL stock is 1.70% volatile and has beta coefficient of 0.94. Track Fauji Cement Co. Ltd. stock price on the chart and check out the list of the most volatile stocks — is Fauji Cement Co. Ltd. there?
Today Fauji Cement Co. Ltd. has the market capitalization of 128.09 B, it has decreased by −2.42% over the last week.
Yes, you can track Fauji Cement Co. Ltd. financials in yearly and quarterly reports right on TradingView.
Fauji Cement Co. Ltd. is going to release the next earnings report on Feb 25, 2026. Keep track of upcoming events with our Earnings Calendar.
FCCL net income for the last quarter is 3.29 B PKR, while the quarter before that showed 3.92 B PKR of net income which accounts for −16.14% change. Track more Fauji Cement Co. Ltd. financial stats to get the full picture.
Yes, FCCL dividends are paid annually. The last dividend per share was 1.25 PKR. As of today, Dividend Yield (TTM)% is 2.39%. Tracking Fauji Cement Co. Ltd. dividends might help you take more informed decisions.
Fauji Cement Co. Ltd. dividend yield was 2.80% in 2025, and payout ratio reached 23.01%. The year before the numbers were 4.36% and 29.83% correspondingly. See high-dividend stocks and find more opportunities for your portfolio.
As of Nov 28, 2025, the company has 2.33 K employees. See our rating of the largest employees — is Fauji Cement Co. Ltd. on this list?
EBITDA measures a company's operating performance, its growth signifies an improvement in the efficiency of a company. Fauji Cement Co. Ltd. EBITDA is 30.98 B PKR, and current EBITDA margin is 34.33%. See more stats in Fauji Cement Co. Ltd. financial statements.
Like other stocks, FCCL shares are traded on stock exchanges, e.g. Nasdaq, Nyse, Euronext, and the easiest way to buy them is through an online stock broker. To do this, you need to open an account and follow a broker's procedures, then start trading. You can trade Fauji Cement Co. Ltd. stock right from TradingView charts — choose your broker and connect to your account.
Investing in stocks requires a comprehensive research: you should carefully study all the available data, e.g. company's financials, related news, and its technical analysis. So Fauji Cement Co. Ltd. technincal analysis shows the neutral today, and its 1 week rating is neutral. Since market conditions are prone to changes, it's worth looking a bit further into the future — according to the 1 month rating Fauji Cement Co. Ltd. stock shows the buy signal. See more of Fauji Cement Co. Ltd. technicals for a more comprehensive analysis.
If you're still not sure, try looking for inspiration in our curated watchlists.
If you're still not sure, try looking for inspiration in our curated watchlists.