Buy on Breakouts or on dips ,,,FECTC
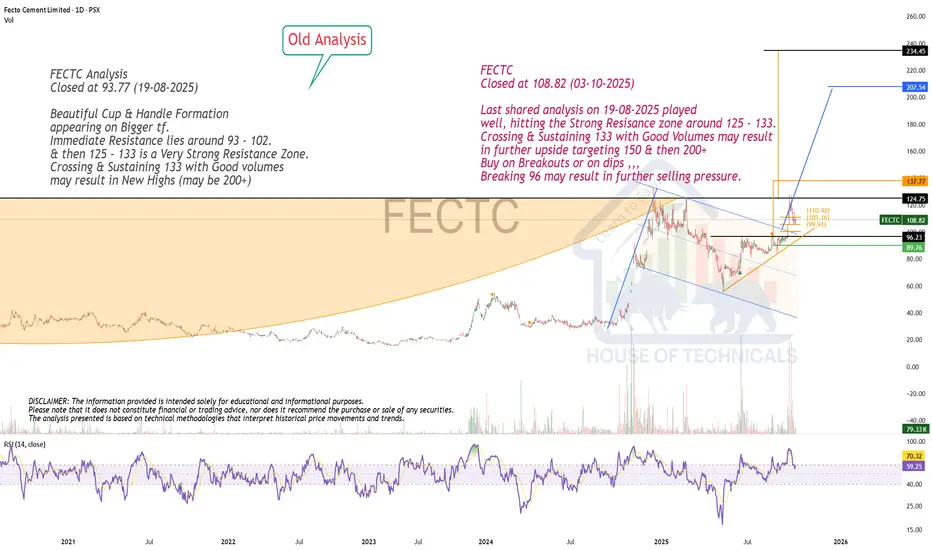
Closed at 108.82 (03-10-2025)
Last shared analysis on 19-08-2025 played
well, hitting the Strong Resisance zone around 125 - 133.
Crossing & Sustaining 133 with Good Volumes may result
in further upside targeting 150 & then 200+
Buy on Breakouts or on dips ,,,
Breaking 96 may result in further selling pressure.
Trade ideas
PSX - Cement Sector ComparissionOn Daily TF, price increase percentage of cement sector has been plotted wef 01 Oct 2025 till date 04 Nov 2025.
Top performers are:-
FECTC: 40.03% gain
THCCL: 26.50% gain
FLYNG: 14.39% gain
Rest all are in negative.
Both FECTC and THCCL are poised to go even further up. However, THCCL is facing a very strong resistance at top and once this resistance will break then we will see sharp increase in its share price. On the other-hand, FECTC is on a roll with cap after cap. Its TP for first profit booking is around 170~178 mark and that is expected in next week.

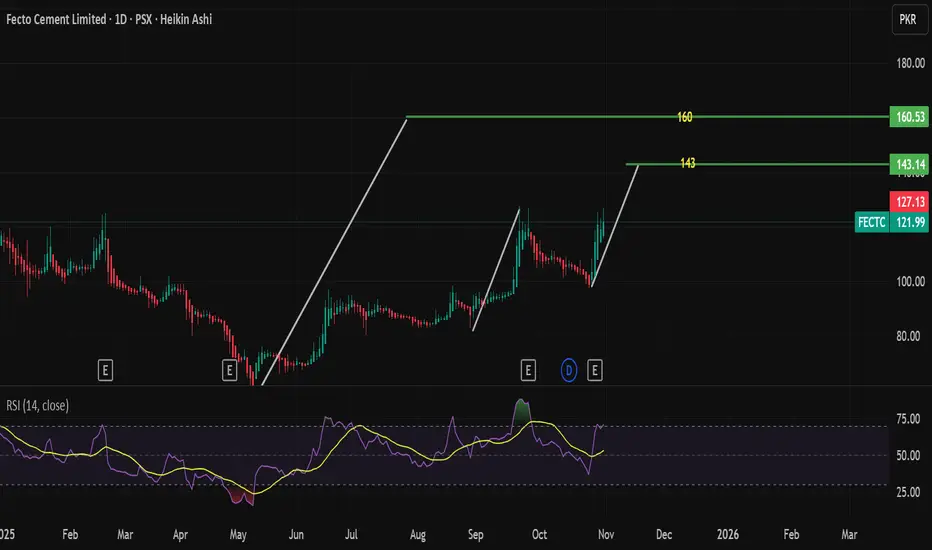
FECTO CementGood ABCD pattern visible on both the daily and weekly charts, with strong upward momentum confirming the structure.
Volume has also spiked significantly, adding conviction to the bullish continuation setup.
Immediate resistance is seen around 143, followed by the next target zone near 160, as highlighted on the chart.
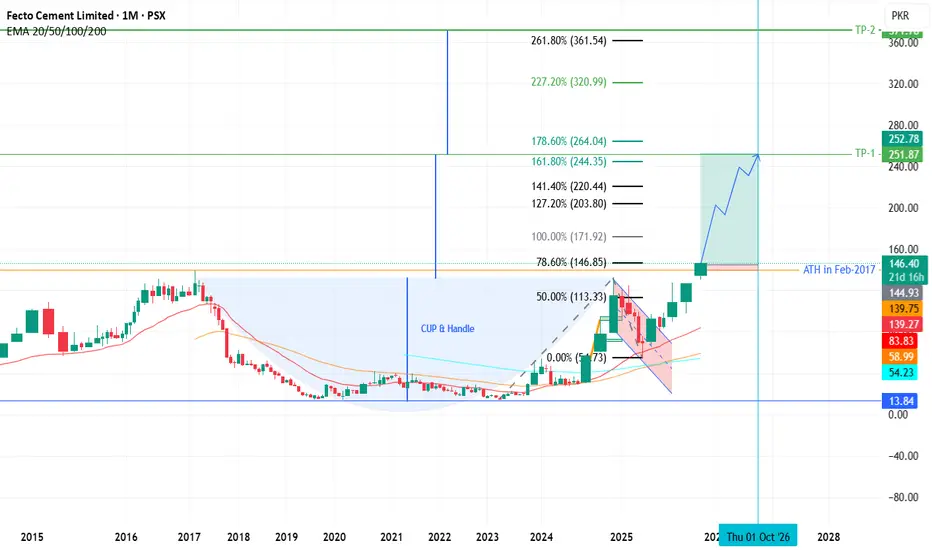
FECTC - PSX - Monthly Tech AnalysisOn monthly TF, Cup & Handle pattern has been drawn. Handle after tracing back to Fib 54% has gone up to break the cup top and ATH as well. Moreover there are substantial volumes as well.
Fib based Extension tool as well as depth of cup has been used to arrive to the TPs.
For Swing trading the price is sitting at a very lucrative price with Stop Loss just below ATH of 140 with possible TP at 251 by end Oct 2026.
FECTC FECTO Cement PSXFECTO Cement PSX 1 Day Chart
Bullish Momentum can push the price Higheir
Company Over All Has good Progress report
Technical chart showing HHs HLs

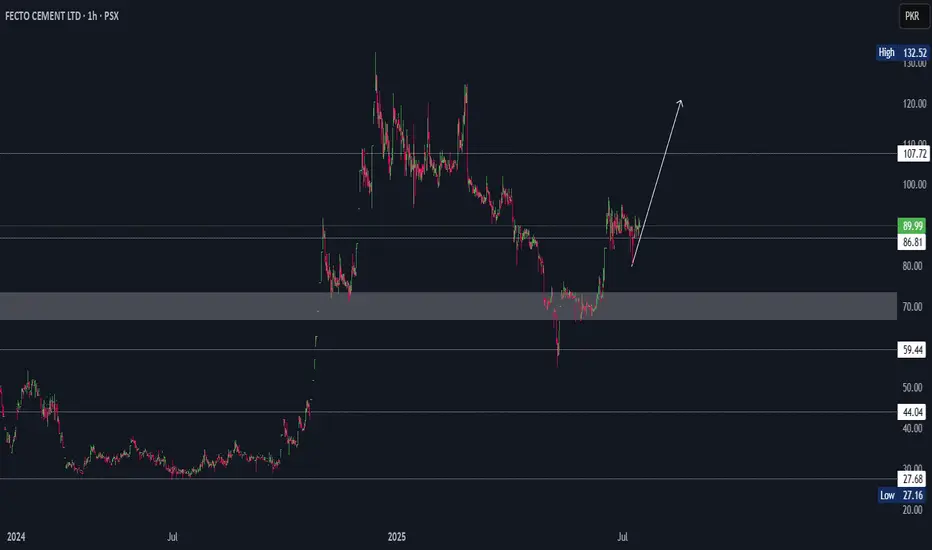
FECTO Cement Bullish FlagFecto has made a good low on 9th May and now hopefully heading towards 107 and 120 with a bullish flag formation.
This could be a good 20%-30% move up.
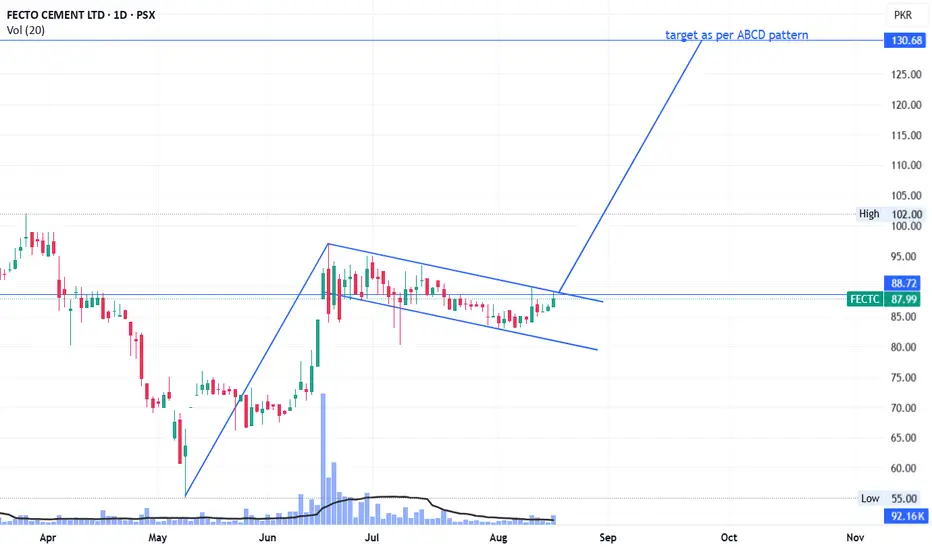
FECTC LongFECTC is forming a bullish flag pattern.
Next target as per ABCD pattern is 131 (on bigger time frame, you can see a cup formation).
Handle will form after that and target of cup and handle will be ~ 220 to 240.
On monthly time frame, golden cross is about to happen which is again a bullish indicator.
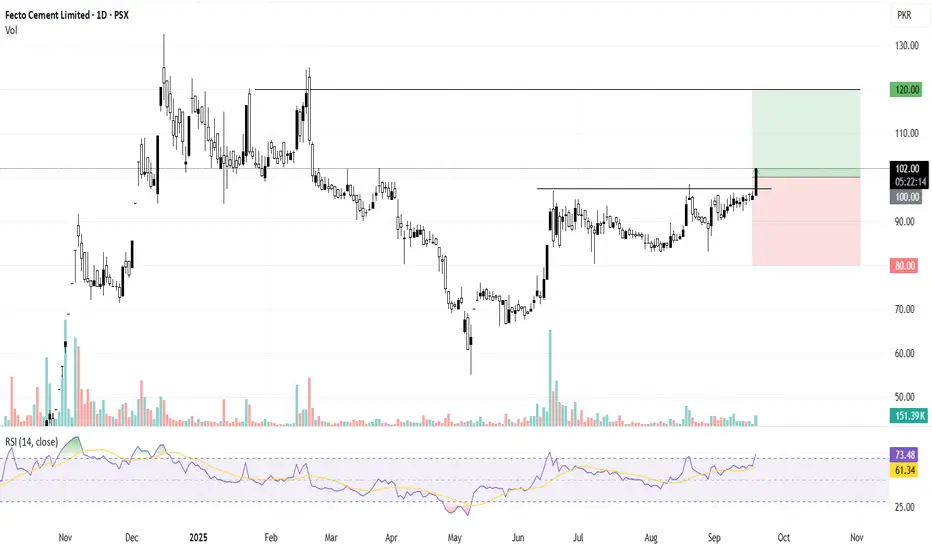
FECTC Targeting Weekly SupplyFECTC has broken the local supply zone and is now targeting the weekly supply area. A stop loss below the recent low is recommended, with targets set at the weekly high.
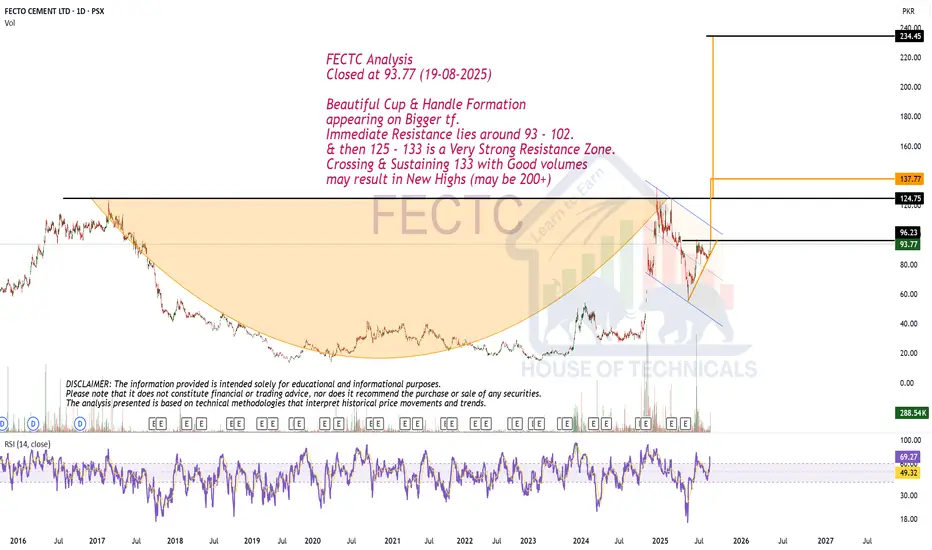
Beautiful Cup & Handle Formation!FECTC Analysis
Closed at 93.77 (19-08-2025)
Beautiful Cup & Handle Formation
appearing on Bigger tf.
Immediate Resistance lies around 93 - 102.
& then 125 - 133 is a Very Strong Resistance Zone.
Crossing & Sustaining 133 with Good volumes
may result in New Highs (may be 200+)
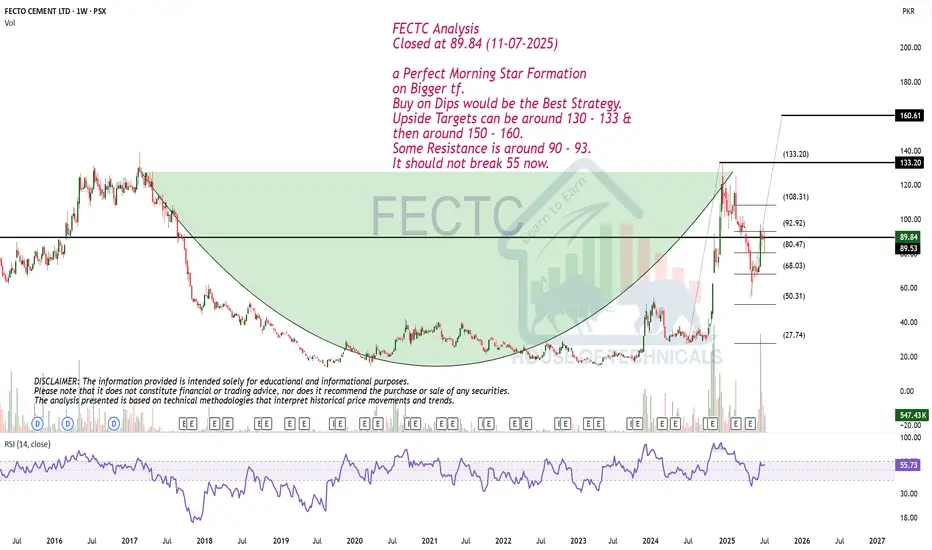
a Perfect Morning Star Formation on Bigger tf.FECTC Analysis
Closed at 89.84 (11-07-2025)
a Perfect Morning Star Formation
on Bigger tf.
Buy on Dips would be the Best Strategy.
Upside Targets can be around 130 - 133 &
then around 150 - 160.
Some Resistance is around 90 - 93.
It should not break 55 now.
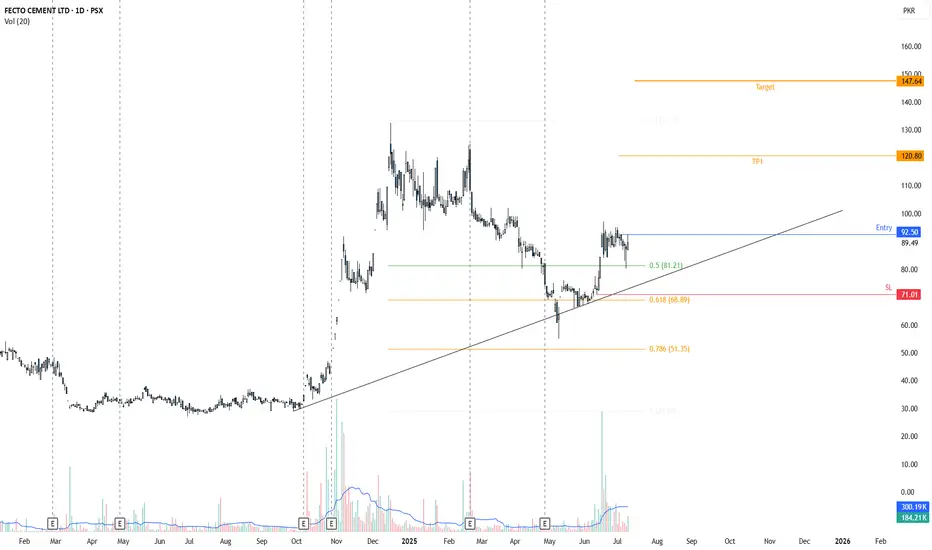
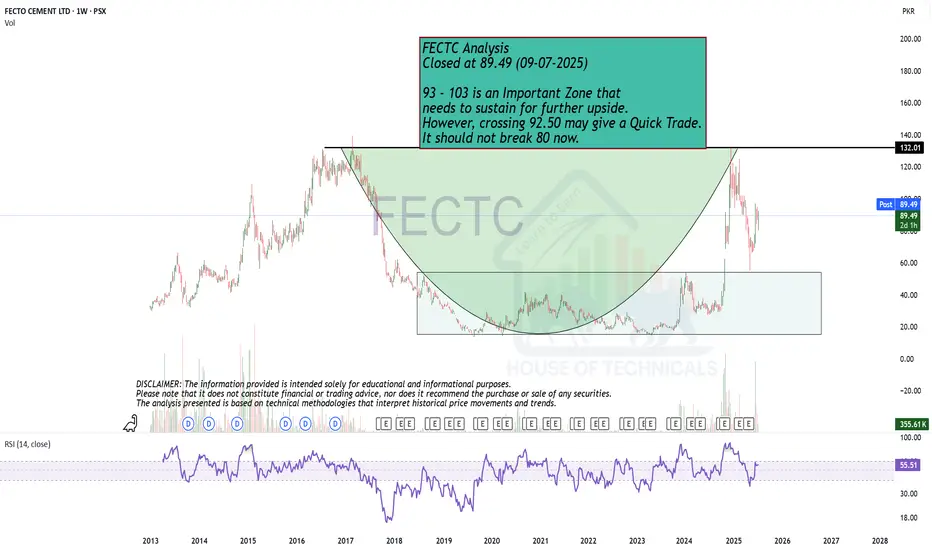
Important ZoneFECTC Analysis
Closed at 89.49 (09-07-2025)
93 - 103 is an Important Zone that
needs to sustain for further upside.
However, crossing 92.50 may give a Quick Trade.
It should not break 80 now.
Strong Bullish Divergence on Bigger tf.FECTC Closed at 76.81 (16-06-2025)
Strong Bullish Divergence on Bigger tf.
Hidden Bullish Divergence also appearing.
Taken Support from 0.618 fib level.
Cup & Handle Formation on Bigger tf.
Upside Resistance is around 126 - 133
Crossing & Sustaining this level may lead it
towards 220 - 240.
However, it should not break 55 now.

FECTC LONG TRADE/INVESTMENT 16-06-2025FECTC Technical Long & Investment Buy Call
Rationale: FECTC broke out of a range in Oct 2024, achieved a target of 132, and then corrected in an ABC pattern. After pulling back to the breakout level, the stock shows good price action with volumes, suggesting a resumption of the uptrend.
🚨 TECHNICAL BUY CALL – FECTEC🚨
- Buy 1: Current level (Rs. 77-76.8)
- Buy 2: Rs. 69.6
- Buy 3: Rs. 62.4
- TP 1: Rs. 97.52
- TP 2: Rs. 113.5
- TP 3: Rs. 129.5
- Long-term Investment TP: Rs. 159.8
Stop Loss- Below Rs. 50.8
Risk-Reward Ratio- 1:5
Caution: Close at least 50% position size at TP1 and then trail SL to avoid losing incurred profits in case of unforeseen market conditions.
PLEASE BOOST AND SHARE THE IDEA IF YOU FIND IT HELPFUL.

FECTC - PSX - Technical AnalysisPrice is just above EMA 21 on Daily TF which indicates that still this script is in the Bull Run. However, if price drop from here then it may drop till 95 and bounce from there. It may even slip to 73 as well. RSI is slightly sliding downwards but there is no divergence present. KVO suggest a balance state.
Moreover, Pole & Flag patterns have been repeatedly printed by this script and right now Pole is about to start.
Trade Values:
BUY-1: 103
BUY-2: 95
SL: 90
TP: 127
TP-2: 159

Fectc is ready to flyFectc is ready to fly
Currently it is near and could
breakout level of 108.76 to go to
its next destiny of 139.7 and 166
Note:
This is not a buy/sell call
Use stop loss whenever trade.

Bullish Divergence on Daily as well as Weekly TF
Fib 0.618 Support (Golden Pocket) around 28.50 - 29.80
Monthly Closing Above 30 will be a +ve Sign

PSX - FECTC OutlookFECTO Cement is consistently out performing against the KSE100 Index while the index is under pressure from last month. CUP & Handle bullish continuation pattern is formed. entry is recommended upon sustaining @52.50
Entry: 52.50
Stop Loss: 45
TP1:60
TP2:67.50
