Feroz (Razia) Resistances (Ghundon) main phans gayi !!Feroze is facing many resistances...
Monthly resistance at 419
Black trendline resistance at ~425
Fib 0.5 level resistance at ~428
Blue trendline resistance at ~440
Bearish divergence on RSI indicating a potential downside.. But this may be resolved if trend is sideways and stock remains at this lev
18.75 PKR
776.54 M PKR
18.86 B PKR
31.54 M
About Ferozsons Laboratories Limited
Sector
Industry
CEO
Osman Khalid Waheed
Website
Headquarters
Lahore
Founded
1954
ISIN
PK0005201014
FIGI
BBG000GMZBZ2
Ferozsons Laboratories Ltd. is a holding company, which engages in the manufacture and sale of pharmaceuticals and other related products. It operates through the following segments: Ferozsons, BF Biosciences, and Others. The Ferozsons segment is involved in the import, manufacture, and sale of pharmaceutical products as well as the distribution of medical devices. The BF Biosciences segment includes the development and provision of pharmaceutical products. The Others segment focuses on offering pharmaceutical and other related products. The company was founded on January 28, 1954 and is headquartered in Lahore, Pakistan.
Related stocks

FEROZ LongTrendline resistance stopping it at 440. Once broken, next targets will be Fib 0.5 level (480) and then Fib 0.618 level (580).

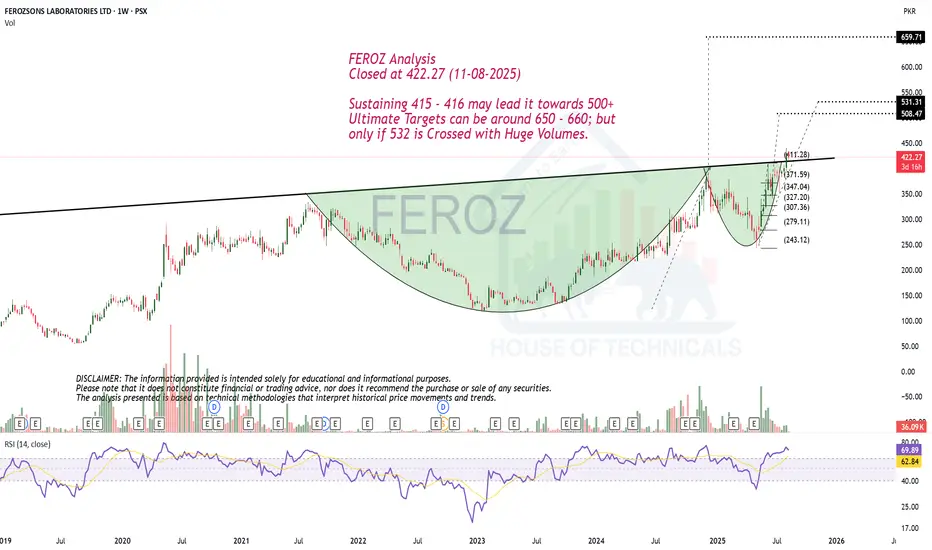
Beautiful Bullish PatternsFEROZ Analysis
Closed at 422.27 (11-08-2025)
Sustaining 415 - 416 may lead it towards 500+
Ultimate Targets can be around 650 - 660; but
only if 532 is Crossed with Huge Volumes.
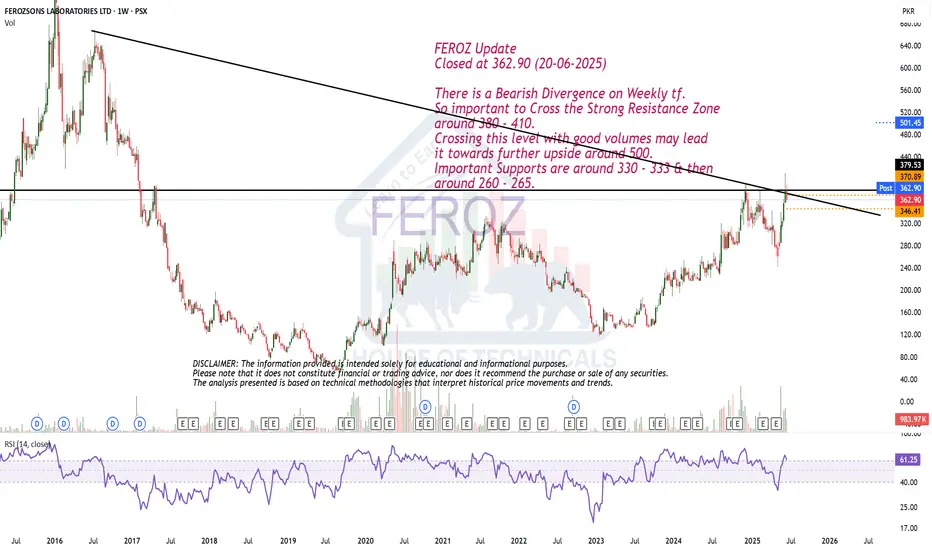
Bearish Divergence on Weekly tf.FEROZ Update
Closed at 362.90 (20-06-2025)
There is a Bearish Divergence on Weekly tf.
So important to Cross the Strong Resistance Zone
around 380 - 410.
Crossing this level with good volumes may lead
it towards further upside around 500.
Important Supports are around 330 - 333 & then
around 260 -
FEROZ LongFEROZ just touched its channel top this month and breaking it (410) will open up its way to further upside targets of 482, 581 and then 722 in medium term.
Further, a beautiful inverse head and shoulders formation is already complete... Breakout expected next month insha Allah.
Its my personal opini

Stock is Bullish but..
Closed at 356.30 (05-06-2025)
Stock is Bullish but closed just below the
weekly resistance.
However, if it gives weekly closing above
354 - 355, that would be OK & it may
give quick gain till 360 - 365.
Otherwise, we may witness 343 -345 &
then around 325 - 330.

Very Good Monthly Closing.
Closed at 323.58 (30-05-2025)
Very Good Monthly Closing.
Seems like Crossing the Resistance of 329-330
this time.
Potential to touch 390 -400 initially & then
500+ if 395 is Sustained.
However, should not break 305 - 307.

Feroz - Long Feroz is making cup and handle formation. Further, it is in an upward trend, breaking which may lead it to go beyond 550 (Exact medium term targets mentioned in chart). In the longer run, (1.5 to 2 years), it may again touch its all time high (900+).

Cup & Handle Formation; Bullish Flag FormationPlan1
Buy1 around 208 - 210 | Sell around 215 then 225
Buy2 around 198 - 201 | Sell around 210 - 215
Stoploss 189 (Closing Basis)
Plan2
Buy Above 242
Sell around 247 - 253 then 280 then 300
Stoploss 239 (Closing Basis)

Feroz Technical Analysis: Potential Buy OpportunityFeroz currently displays a bullish trend supported by key indicators. Price has rebounded from a trendline and is trading above the 89-day EMA, a historically significant support level respected by the price action. A recent support zone bounce and alignment with the Fibonacci Golden Ratio further s

See all ideas
Summarizing what the indicators are suggesting.
Oscillators
Neutral
SellBuy
Strong sellStrong buy
Strong sellSellNeutralBuyStrong buy
Oscillators
Neutral
SellBuy
Strong sellStrong buy
Strong sellSellNeutralBuyStrong buy
Summary
Neutral
SellBuy
Strong sellStrong buy
Strong sellSellNeutralBuyStrong buy
Summary
Neutral
SellBuy
Strong sellStrong buy
Strong sellSellNeutralBuyStrong buy
Summary
Neutral
SellBuy
Strong sellStrong buy
Strong sellSellNeutralBuyStrong buy
Moving Averages
Neutral
SellBuy
Strong sellStrong buy
Strong sellSellNeutralBuyStrong buy
Moving Averages
Neutral
SellBuy
Strong sellStrong buy
Strong sellSellNeutralBuyStrong buy
Displays a symbol's price movements over previous years to identify recurring trends.
Frequently Asked Questions
The current price of FEROZ is 380.71 PKR — it has decreased by −0.83% in the past 24 hours. Watch Ferozsons Laboratories Limited stock price performance more closely on the chart.
Depending on the exchange, the stock ticker may vary. For instance, on PSX exchange Ferozsons Laboratories Limited stocks are traded under the ticker FEROZ.
FEROZ stock has fallen by −5.73% compared to the previous week, the month change is a −6.92% fall, over the last year Ferozsons Laboratories Limited has showed a 13.31% increase.
FEROZ reached its all-time high on Jan 8, 2016 with the price of 901.39 PKR, and its all-time low was 35.69 PKR and was reached on Feb 12, 2013. View more price dynamics on FEROZ chart.
See other stocks reaching their highest and lowest prices.
See other stocks reaching their highest and lowest prices.
FEROZ stock is 2.89% volatile and has beta coefficient of 0.68. Track Ferozsons Laboratories Limited stock price on the chart and check out the list of the most volatile stocks — is Ferozsons Laboratories Limited there?
Today Ferozsons Laboratories Limited has the market capitalization of 16.55 B, it has decreased by −4.06% over the last week.
Yes, you can track Ferozsons Laboratories Limited financials in yearly and quarterly reports right on TradingView.
FEROZ net income for the last quarter is 258.69 M PKR, while the quarter before that showed 206.22 M PKR of net income which accounts for 25.44% change. Track more Ferozsons Laboratories Limited financial stats to get the full picture.
Yes, FEROZ dividends are paid annually. The last dividend per share was 4.00 PKR. As of today, Dividend Yield (TTM)% is 1.05%. Tracking Ferozsons Laboratories Limited dividends might help you take more informed decisions.
Ferozsons Laboratories Limited dividend yield was 1.03% in 2025, and payout ratio reached 22.39%. The year before the numbers were 1.20% and 19.09% correspondingly. See high-dividend stocks and find more opportunities for your portfolio.
As of Nov 30, 2025, the company has 1.56 K employees. See our rating of the largest employees — is Ferozsons Laboratories Limited on this list?
EBITDA measures a company's operating performance, its growth signifies an improvement in the efficiency of a company. Ferozsons Laboratories Limited EBITDA is 3.18 B PKR, and current EBITDA margin is 15.13%. See more stats in Ferozsons Laboratories Limited financial statements.
Like other stocks, FEROZ shares are traded on stock exchanges, e.g. Nasdaq, Nyse, Euronext, and the easiest way to buy them is through an online stock broker. To do this, you need to open an account and follow a broker's procedures, then start trading. You can trade Ferozsons Laboratories Limited stock right from TradingView charts — choose your broker and connect to your account.
Investing in stocks requires a comprehensive research: you should carefully study all the available data, e.g. company's financials, related news, and its technical analysis. So Ferozsons Laboratories Limited technincal analysis shows the sell today, and its 1 week rating is sell. Since market conditions are prone to changes, it's worth looking a bit further into the future — according to the 1 month rating Ferozsons Laboratories Limited stock shows the buy signal. See more of Ferozsons Laboratories Limited technicals for a more comprehensive analysis.
If you're still not sure, try looking for inspiration in our curated watchlists.
If you're still not sure, try looking for inspiration in our curated watchlists.