FFC PSX Chart Analysis 10-Dec-25Stop-Loss: 597 PKR
Sell Stop: 550 PKR
Take Profit 1: 500 PKR
Take Profit 2: 450 PKR
Following a strong bullish trend, a clear RSI divergence has formed, indicating potential weakness in momentum. Based on this signal, we anticipate a bearish move in FFC, with price targets at 500 PKR and 450 PKR.
Fauji Fertilizer Co. Ltd.
No trades
Next report date
—
Report period
—
EPS estimate
—
Revenue estimate
—
58.44 PKR
83.17 B PKR
483.81 B PKR
870.23 M
About Fauji Fertilizer Co. Ltd.
Sector
Industry
CEO
Jahangir Piracha
Website
Headquarters
Rawalpindi
Founded
1978
IPO date
May 25, 1994
Identifiers
2
ISIN PK0053401011
Fauji Fertilizer Co. Ltd. engages in the manufacturing, purchasing and marketing of fertilizers and chemicals. The firm also involves in energy generation, food processing and banking operations. It operates through following segments: Fertilizers, Power and Food. The Fertilizers segment refers to the buying, manufacturing and distributing fertilizers. The Power segment refers to the production and sale of power. The Food segment relates to the fresh and frozen fruits, vegetables, frozen cooked and semi cooked food. Fauji Fertilizer was founded in 1978 and is headquartered in Rawalpindi, Pakistan.
Related stocks

HL is still intact around 581.FFC Analysis
CMP 596.62 & Lower Locked (29-01-2026 02:54PM)
HL is still intact around 581.
If this breaks, next support is around 568 - 570
It may continue its uptrend after crossing 685.

Bullish PennantFFC Analysis
Closed at 650.82 (23-01-2026)
Bullish Pennant Target seems to be around 700+
However, breaking 580 may bring the price towards
550 - 565

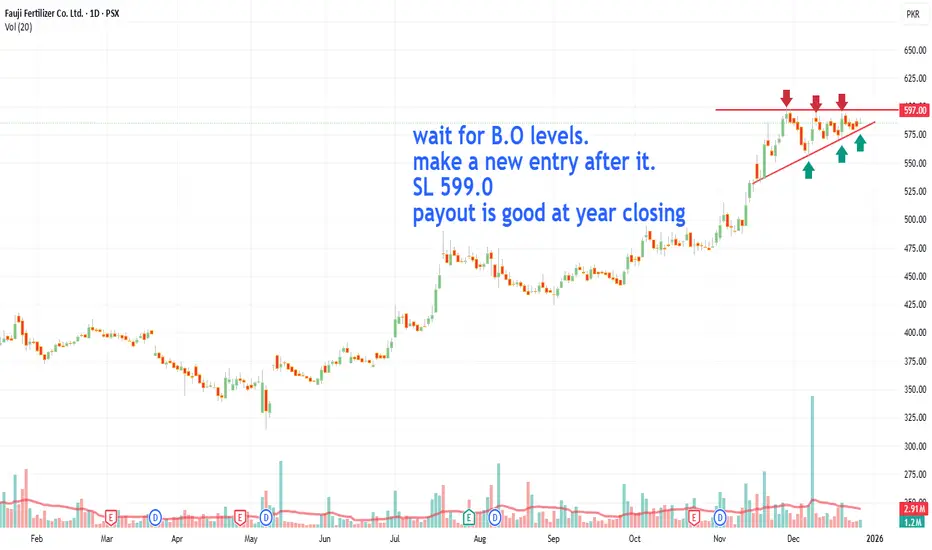
FFCgood paying out stock. history of pay out is regular
wait for break out levels.
accumlate after it.
FFC is already over pricedFFC is already overpriced; it may accumulate at a price range or will come back to our intended price range.
2 possible strategies
1. Buy at the current price and add regularly every week, whether the price comes down or up.
2. Wait for the discounted price. (best buying zone)

FFC Buy ZOneFFE retrace on its all time high zone. And move toward its demand zone.Next buying zone is 550 and keep target for all time high

ffc fauji fertilizer companyI will take trade on these 2 pointed buying zones. First buying zone will be on 533 on 0.38 and second will be on 512 on 0.50.

FFC – TECH BUY CALL | 1H | 25 Nov 2025 | By The Chart Alchemist FFC – TECH BUY CALL | 1H | 24 Nov 2025 | By The Chart Alchemist
FFC is trading inside a higher-timeframe bullish channel. After touching the bottom boundary, the stock formed an expanding triangle and is showing strong signs of reversal. With structure aligned for upside continuation, FFC is expect

FFCFFC moving in a strong ascending channel 📈
Holding above support keeps the bullish structure intact.
📊 Key levels:
Resistance: 515
Long-term AB=CD target: 566
Break above 515 = next leg toward 566 🔥

FFC – TECH BUY CALL | 1H TF | 04 NOV 2025 | By TCAFFC – TECH BUY CALL | 1H TF | 04 NOV 2025 | By The Chart Alchemist
FFC has been re-accumulating within a trading range marked by a light purple channel. After a period of consolidation, the stock broke out of this range and retested the breakout zone, confirming renewed bullish momentum. This struct

See all ideas
Summarizing what the indicators are suggesting.
Neutral
SellBuy
Strong sellStrong buy
Strong sellSellNeutralBuyStrong buy
Neutral
SellBuy
Strong sellStrong buy
Strong sellSellNeutralBuyStrong buy
Neutral
SellBuy
Strong sellStrong buy
Strong sellSellNeutralBuyStrong buy
An aggregate view of professional's ratings.
Neutral
SellBuy
Strong sellStrong buy
Strong sellSellNeutralBuyStrong buy
Neutral
SellBuy
Strong sellStrong buy
Strong sellSellNeutralBuyStrong buy
Neutral
SellBuy
Strong sellStrong buy
Strong sellSellNeutralBuyStrong buy
Displays a symbol's price movements over previous years to identify recurring trends.
Frequently Asked Questions
The current price of FFC is 569.38 PKR — it has decreased by −0.17% in the past 24 hours. Watch Fauji Fertilizer Co. Ltd. stock price performance more closely on the chart.
Depending on the exchange, the stock ticker may vary. For instance, on PSX exchange Fauji Fertilizer Co. Ltd. stocks are traded under the ticker FFC.
FFC stock has fallen by −1.84% compared to the previous week, the month change is a −1.93% fall, over the last year Fauji Fertilizer Co. Ltd. has showed a 46.56% increase.
We've gathered analysts' opinions on Fauji Fertilizer Co. Ltd. future price: according to them, FFC price has a max estimate of 801.00 PKR and a min estimate of 618.00 PKR. Watch FFC chart and read a more detailed Fauji Fertilizer Co. Ltd. stock forecast: see what analysts think of Fauji Fertilizer Co. Ltd. and suggest that you do with its stocks.
FFC stock is 2.83% volatile and has beta coefficient of 0.82. Track Fauji Fertilizer Co. Ltd. stock price on the chart and check out the list of the most volatile stocks — is Fauji Fertilizer Co. Ltd. there?
Today Fauji Fertilizer Co. Ltd. has the market capitalization of 834.03 B, it has decreased by −2.45% over the last week.
Yes, you can track Fauji Fertilizer Co. Ltd. financials in yearly and quarterly reports right on TradingView.
Fauji Fertilizer Co. Ltd. is going to release the next earnings report on Apr 27, 2026. Keep track of upcoming events with our Earnings Calendar.
FFC net income for the last quarter is 21.55 B PKR, while the quarter before that showed 24.53 B PKR of net income which accounts for −12.16% change. Track more Fauji Fertilizer Co. Ltd. financial stats to get the full picture.
Fauji Fertilizer Co. Ltd. dividend yield was 6.26% in 2025, and payout ratio reached 63.31%. The year before the numbers were 9.96% and 61.56% correspondingly. See high-dividend stocks and find more opportunities for your portfolio.
Like other stocks, FFC shares are traded on stock exchanges, e.g. Nasdaq, Nyse, Euronext, and the easiest way to buy them is through an online stock broker. To do this, you need to open an account and follow a broker's procedures, then start trading. You can trade Fauji Fertilizer Co. Ltd. stock right from TradingView charts — choose your broker and connect to your account.
Investing in stocks requires a comprehensive research: you should carefully study all the available data, e.g. company's financials, related news, and its technical analysis. So Fauji Fertilizer Co. Ltd. technincal analysis shows the sell today, and its 1 week rating is buy. Since market conditions are prone to changes, it's worth looking a bit further into the future — according to the 1 month rating Fauji Fertilizer Co. Ltd. stock shows the buy signal. See more of Fauji Fertilizer Co. Ltd. technicals for a more comprehensive analysis.
If you're still not sure, try looking for inspiration in our curated watchlists.
If you're still not sure, try looking for inspiration in our curated watchlists.