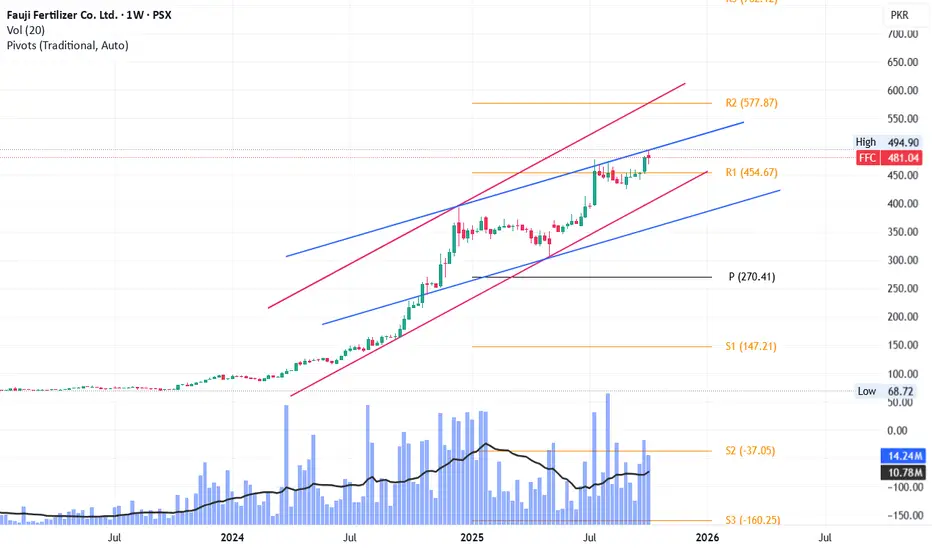
Undecisive about FFCI can see two channels... One with red lines, other with blue.
Which channel FFC will follow is yet to be seen :)
FFC trade ideas
FFC likely to go bearish 1D TFFFC on 1D TF has recently printed a double top pattern along with Bearish Divergence on 14-RSI. If the support area of 425.34-425.34 is broken, it may slide until the TP of 356.12.

FFC-LONGFFC is tranding in a bullish trend,close above its recent high will push price to further upside for 545 and 612

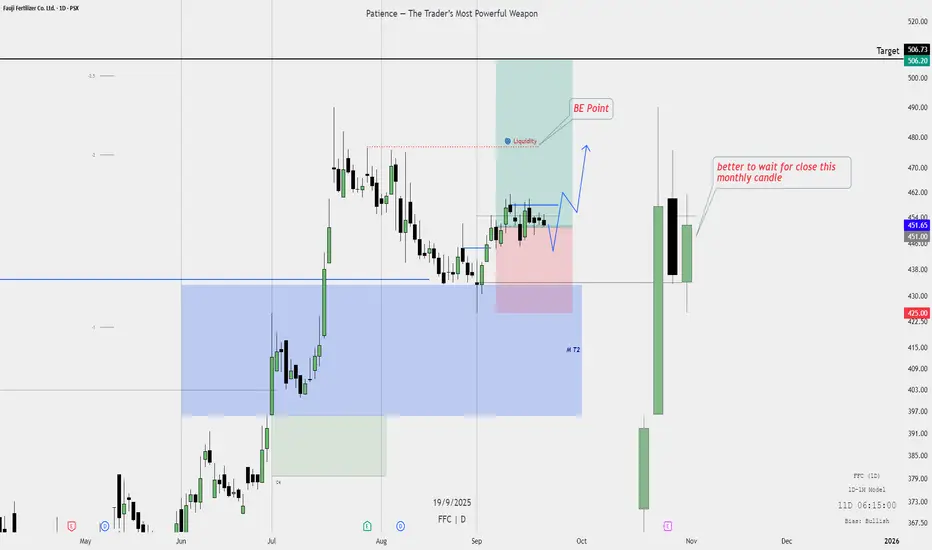
Trade Plan – FFC (Daily Chart)Trade Plan – FFC
Bias: Bullish
Entry: Wait for daily/ monthly candle to close strong bullish.
Stop Loss: Below recent swing low.
Target: 506 area.
Management: After clearing liquidity, move SL to breakeven and hold.
Note: Better to wait for monthly candle close before entry.
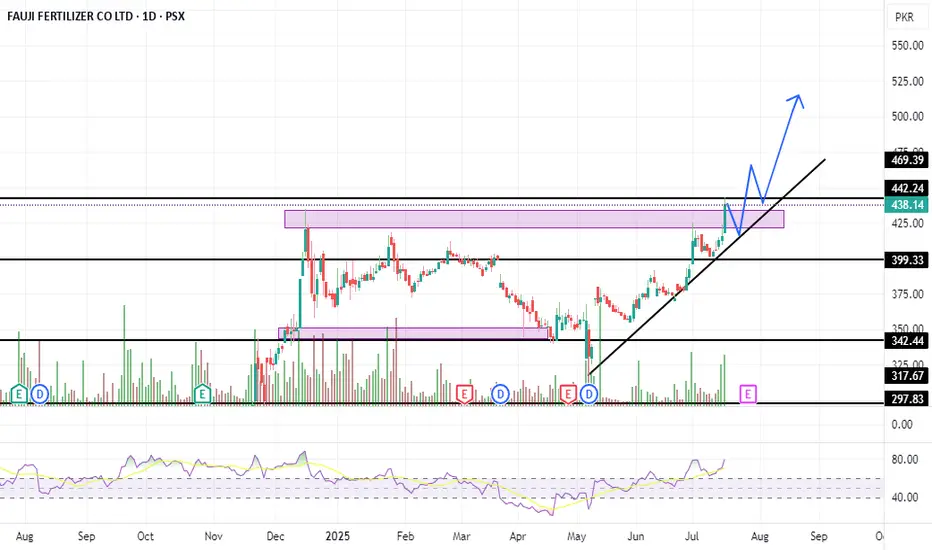
FFC longSuggested plan (example levels based on the chart):
Entry: Buy on a confirmed breakout and close above the short-term resistance (around 470–480). If you prefer more conservative entry, wait for a retest of the breakout zone and buy on support hold.
Stop‑Loss (SL): Place SL below the major support zone — around 420 (safe) or tighter at 440 (closer stop) depending on your risk tolerance.
Take‑Profit (TP):
TP1 (near term): 530–550 (first realistic resistance/target)
TP2 (extended): 600 (ambitious/secondary target if momentum continues)
Risk management: Risk no more than 1–2% of your trading capital on this trade. Size your position so the distance between entry and SL equals that risk.
Entry/exit rules to follow:
Only enter after a clear momentum candle closes above the resistance (or after a successful retest).
Move SL to breakeven once TP1 is reached or when the trade is comfortably in profit.
Scale out: consider selling 30–50% at TP1 and letting the rest run toward TP2 with a trailing stop.
Reminder: This is educational information, not financial advice. Adjust levels to the exact prices on your platform and your personal risk tolerance. If you want, tell me the exact current price you see and how much capital you want to risk and I can calculate position size for you.

FFC – TECHNICAL BUY CALL | 02 SEPT. 2025 FFC – TECHNICAL BUY CALL | 02 SEPT. 2025
The stock broke out of a reaccumulation phase, achieved a high of Rs. 490, pulled back, and now shows signs of completion, potentially resuming its upward move.

FFC Trade PlanDetails shared
1) Bearish Divergence is formed on the weekly chart.
2) Rising Wedge Pattern formed on the daily chart.
I expected RSI to sync the price falls. I have shared my buy levels.

FFCFFC PSX STOCKs breakout Day Level Buy Call
Fundamental Strengths
Robust earnings growth:
FY 2024 net profit ~PKR 64.7 B vs ~PKR 29.7 B (2023) – EPS nearly doubled to PKR 45.49
Pakistan Stock Exchange
+15
StockAnalysis
+15
.
Q1 2025 EPS ~PKR 9.33 (Sep‑Nov on TTM ~PKR 66.6)
Pakistan Stock Exchange
.
Attractive valuation:
TTM P/E ~9.6× (TradingView shows ~6.6×—likely consolidated vs standalone) .
High dividend yield:
~8.7–9.9% yield in 2024, with a ~60% payout ratio
TradingView
.
Diversified portfolio:
Operations across fertiliser, power, food, banking (via Askari Bank), wind generation, phosphate JV – mitigating sector risk
TradingView
+1
+1
Strong ownership:
Backed by Fauji Foundation (~43% owner) – adds stability and governance credibility

FFC Share Buying StrategyFFC Share Buying Strategy
Key Buying Zone:
📍 Buy between PKR 438 – 416
Note: if tomorrow open above 442 then buy don't wait for dip
Stop Loss:
🚫 Place stop loss at PKR 399
Targets:
🎯 Target 1: PKR 464
🎯 Target 2: PKR 500
Extended Strategy:
🔒 If price sustains above PKR 500, hold the position and apply a trailing stop loss to protect profits.
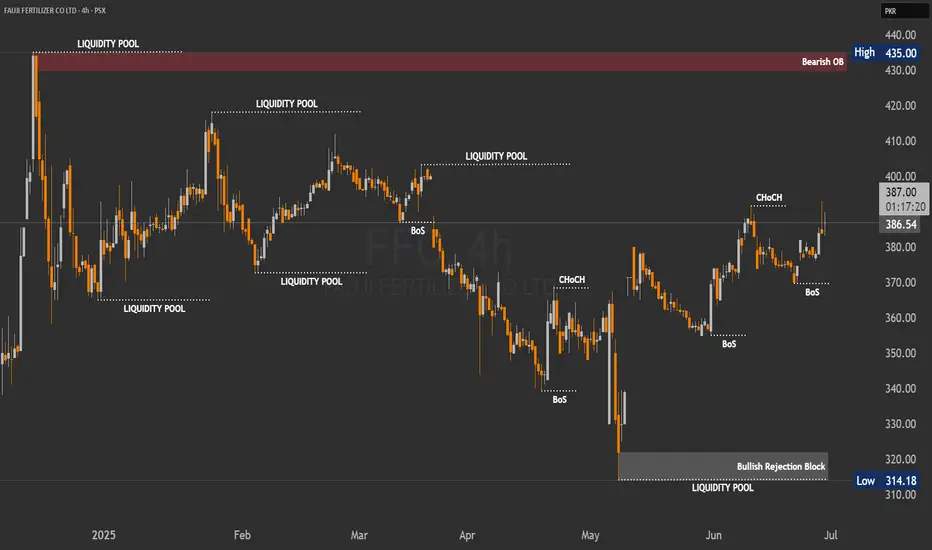
Buy Idea: FAUJI FERTILIZER CO LTD (PSX)🔷 Buy Idea: FAUJI FERTILIZER CO LTD (PSX)
Context:
Price tapped into a discount zone, swept liquidity below the recent lows, and formed a strong bullish engulfing candle. The setup aligns with a low resistance liquidity run toward the higher timeframe distribution zone.
✅ Entry Criteria:
Entry: Above the bullish candle close at ~366
Stop Loss: Below the recent swing low at ~323
Target: Monthly resistance / low resistance area at ~435
RR Ratio: ~1:2.5+
📊 Justification:
Liquidity Sweep: Price swept the previous low (creating inducement)
FVG Reaction: Immediate bullish reaction from the demand/FVG zone
Distribution Zone Targeted: Market is likely to grab liquidity from unfilled sell orders in the upper zone
No major resistance till 435 (clean traffic)
⚠️ Risk Notes:
Confirm daily candle closes above 366 before entry
Monitor any reaction at ~390-400 distribution zone

FFC | Ready for More Upside Before Another Fall?By analyzing the FFC chart on the 4-hour timeframe, we can see that price initially followed our bullish scenario, climbing 23 rupees up to 393. However, after hitting that level, price reversed and currently trading around 389 and eventually finding support around 376.
This area acted as a strong demand zone. Currently, FFC is trading around 389, and as long as price holds above the marked demand zone, we may expect another bullish move towards 390 and 400.
FFC entered into bullish zoneYesterday before closing our custom indicator named SignalsWalaJin generated signal "Khareedo" means buy @358 and it was at 361 at closing. Lets see how much it will rise.
Note: This is not a buy sell trade call. Trade at your own will and use stop loss.

FFC : Bullish Divergence Trading Setup (Hourly Time Frame)A Bullish Divergence has been identified between Price and Momentum indicators on the Hourly chart, signaling a potential Bullish Reversal. This divergence suggests weakening downside momentum and increasing probability of an upward move.
Entry levels and Target Prices (TPs) are clearly marked on the chart.
Traders are advised to consider the Stop Loss (SL) at the level indicated on the chart to manage risk effectively.
This setup favors bullish positioning with calculated risk-reward parameters. Monitor price action around the entry zone for confirmation before execution.

FFC- Deeper Retracement is Expected !Reasons for Deeper Retracements are :
1. 20, 50 & 200 SMAs are converging.
2. RSI on daily TF is below 30 which signifies Bearish Trend
3. Weaker Price Action at Recent Swing High is signalling Profit Taking activity is taking place.
Way Forward:
1. Observe Price Action once price tests 200 SMA and 78.6%% Fib. Level.
2.If a Bullish signal (Engulfing, Pin-Bar with surge in Volume) is observed, a good probability trade is on the cards.

FFC- SHORT TRADEFFC is in distribution phase of Wyckoff Method, it has shown Sign of Weakness after breakdown below 360.
It is expected to retest this area
Short lvl 360-370
TP 301
SL 381

FFCFFC has been consolidating within a symmetrical triangle pattern after a strong bullish rally
Volume: Slightly declining during consolidation
Safe entry zone is marked


Technical Analysis of Fauji Fertilizer Company Ltd (FFC), PSX
Technical Analysis of Fauji Fertilizer Company Ltd (FFC), PSX
Bullish Pennant , Pattern , CMP : 392.81
Date: 11-03-2025
Analysis By : Ali Safwan
Pattern Formation: Bullish Pennant
Potential Targets (TP Levels)
TP-1: Around 450 PKR
TP-2: Near 475 PKR
TP-3: Extended target around 500-525 PKR
Bullish Case:
If the price breaks above 400 PKR with strong volume, it could confirm a bullish breakout, targeting 450-500 PKR.
Bearish Case: If the price fails to break out, it may retest lower support levels at 350 PKR (SMC Discount Zone) or even 310-275 PKR.
Ideal Entry: A breakout above 400 PKR or a dip buy near 350 PKR support.
Stop Loss: Below 350 PKR to manage downside risk.
Disclaimer:
This analysis is for educational and informational purposes only. It represents my personal views based on technical analysis and should not be considered as financial advice or a buy/sell recommendation. Trading and investing involve risk, and past performance does not guarantee future results. Always conduct your own research and consult with a qualified financial advisor before making any trading decisions. You are solely responsible for your own investment choices.


FFCafter posting a bottom FFC IS now ACCUMULATING from last 1 week, Long entry is recommended from this point.

BULLS for FFC Buy from 380-382
sl 375
tp 395.32
key points:
market created strong reversal and entry on 1 hr support
RSI oversold suggests weak bears and inflow of strong bulls
Thankyou

FFC AT ATTRACTIVE LEVELS WITH SUPERB RESULTSThe FFC script is looking at attractive levels trading between the Swing High and Low ... and bouncing from the FIB level.... the financial results declared on 29th January, 2025 is also suggesting a good growth of the firm .....
what are your views ????

FFCFFC Bounced back from 434
and by accumulating reached to 398 and is ready to go its targe of 434 in February 2025 insha Allah.
Its financial results expected 1X to 1.5X results.
So Strong BUY
