GALEntry
Aggressive entry: 555 – 558 (current price region)
Safe entry: on breakout above 565
Stop Loss
Below 548 (below swing C and structure invalidation)
Upside Targets
TP1: 575
TP2: 590 – 598 (primary target)
TP3: 615
TP4: 635
Expected move from C → D aligns perfectly with the projection you marked (2.282 extension).
Trade ideas

GAL Technical Analysis: Bullish Setup in PlayGAL (Ghandhara Automobiles Limited)
Price is trading above the 89 Fibonacci EMA, a level it has historically respected, confirming the overall bullish trend. It is also moving above the upward trendline and recently respected horizontal support since August. Stop loss can be placed aggressively below the horizontal support and 89 EMA on closing basis, or conservatively just below the trendline.
Price has broken out of an ascending triangle, and RSI is in sync with the move, adding further confirmation. The first target aligns with the all-time high, while the second target corresponds to the D point of the AB=CD harmonic pattern. A trailing stop is recommended to ride the trend beyond these levels.
Fundamentals: GAL is a strong company, showing positive revenue growth, operating income, net income, and EPS over recent quarters.
Recommended Levels:
Buy: 560.5 (CMP)
Stop Loss: Closing below 530
Take Profit 1: 620
Take Profit 2: 700
Take Profit 3: Ride the trend with a trailing stop
Potential upside remains as long as price sustains above 89 EMA and upward trendline. Happy trading!

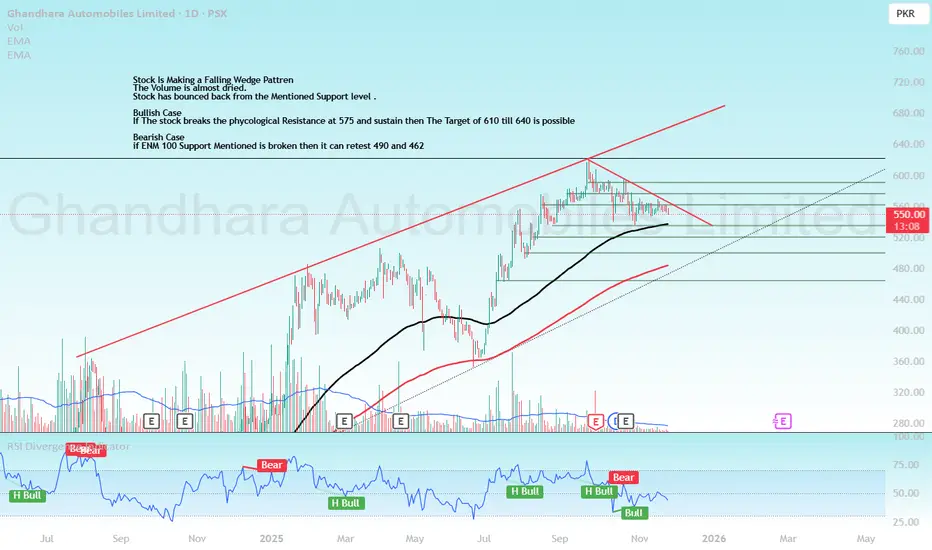
GAL Technical Analysis PSX , PakistanStock Is Making a Falling Wedge Pattren
The Volume is almost dried.
Stock has bounced back from the Mentioned Support level .
Bullish Case
If The stock breaks the phycological Resistance at 575 and sustain then The Target of 610 till 640 is possible
Bearish Case
if ENM 100 Support Mentioned is broken then it can retest 490 and 462
GAL Head & Shoulders Breakdown Ahead? | Smart Money Targeting FAThe Ghandhara Automobiles Limited (PSX: GAL) chart is showing a clear Head and Shoulders reversal pattern at the top of a long-term ascending channel — hinting at potential bearish movement before any new bullish cycle begins.
📊 Technical Insights:
🧩 Head & Shoulders Pattern signaling trend exhaustion.
🟪 IMB Zone (Imbalance) yet to be fully mitigated — price likely to rebalance before continuation.
🔻 Fundamental Area around 400–420 PKR could act as a major demand zone for Smart Money accumulation.
🟢 Long-term channel still intact, suggesting possible rebound after discount pricing.
💡 Outlook:
Expect short-term bearish pressure targeting the IMB and Fundamental Zone before the next potential bullish leg. Patience and confirmation at the lower levels will be key for investors and SMC traders.

Which will Supercede? Bullish Divergence Or Bearish Divergence?GAL Analysis
Closed at 566.12 (27-10-2025)
Continuously making HH HL, but now
Bearish Divergence is appearing on Bigger tf.
Currently seems to be at Support level as
there is also a Bullish Divergence.
Next Important Support seems to be below
500.
In extreme panic, we may witness the price to
enter the blue shaded zone.
The Bullish momentum will continue once
the price crosses 633, targeting around 690 - 700+

GALGAL (Ghandhara Automobiles Ltd – 1W, PSX)**
Pattern:** Rising channel
Price:** 553.23 PKR
Support:** 500–510 (major horizontal + channel support)
Resistance:** 610–620 (upper trendline)
Trend:** Strong long-term uptrend, mild correction phase
Setup:**
Buy zone:** 510–530
Stop-loss:** Below 495
Targets:** 585 / 615
Bias:** Bullish continuation if 500 holds; breakdown below 495 turns trend neutral.

GAL Technical Analysis GAL Technical View 📊
GAL can be bought at current levels, but do note — this is a critical zone. ⚠️
If it breaks below the current level and 550, then there’s a high chance it may drop further towards the 500 range.


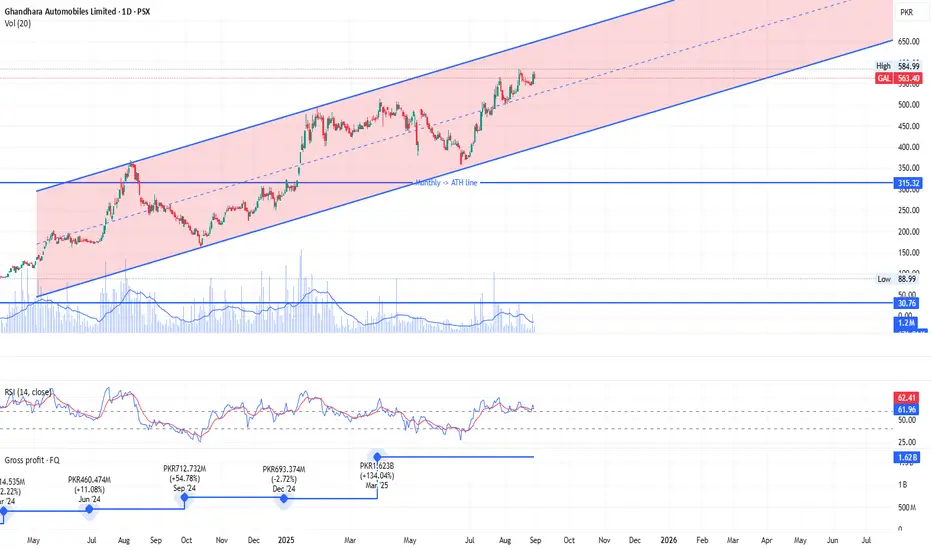
PSX: GAL - Daily TFGAL daily timeframe, moving in a channel
Great fundamentals turnaround - Sales of JAC T-9 Hunter.
GAL – TECHNICAL BUY CALL (15-MIN TF) | 21 AUGUST 2025 GAL – TECHNICAL BUY CALL (15-MIN TF) | 21 AUGUST 2025
The stock was previously in an uptrend, marked a high of Rs. 585, and then pulled back. The pullback now seems to be over at the X line, and the stock is ready to move upward.

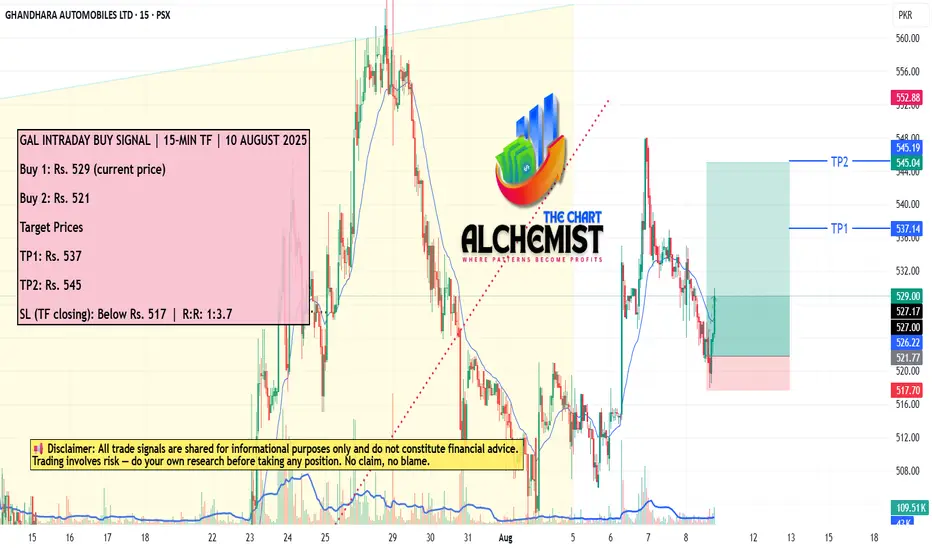
GAL INTRADAY BUY SIGNAL | 15-MIN TF | 10 AUGUST 2025 GAL INTRADAY BUY SIGNAL | 15-MIN TF | 10 AUGUST 2025
The stock made a high of Rs. 548 before entering a pullback. This pullback appears to be over, confirmed by a strong bullish structure signaling a clear upward reversal.
Accumulate .GAL - Closed at 525.88
08-08-2025
Accumulate with a SL of 470
Targeting around 570 & then
600+ Inshaa ALLAH

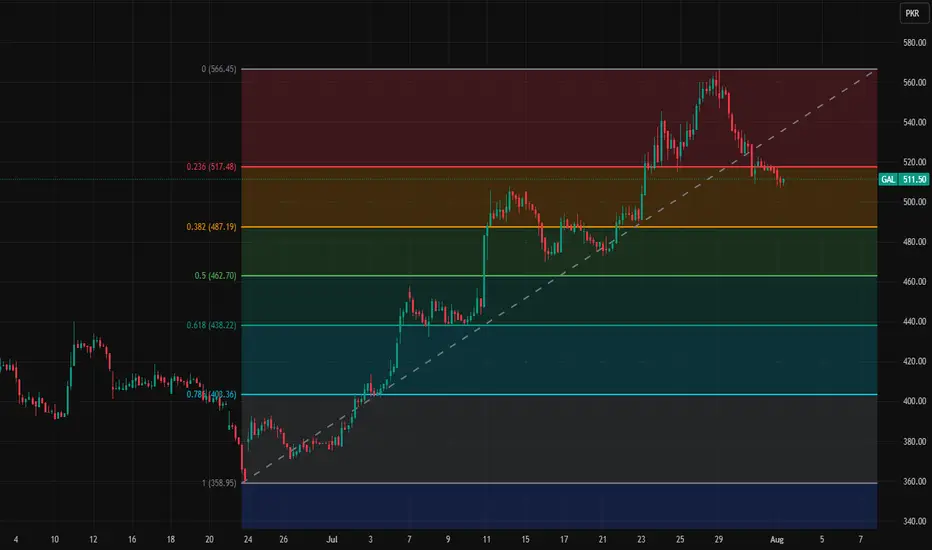
GAL short term key levelsThese are short term key levels on 1h
chart
566.45
517.48
487.19
462.7
438.22
403.36
358.95
GAL on the rise after breakoutgal is rising after submitting breakout on daily charts, currently price has taken a correction which makes it attractive for buying at current price.

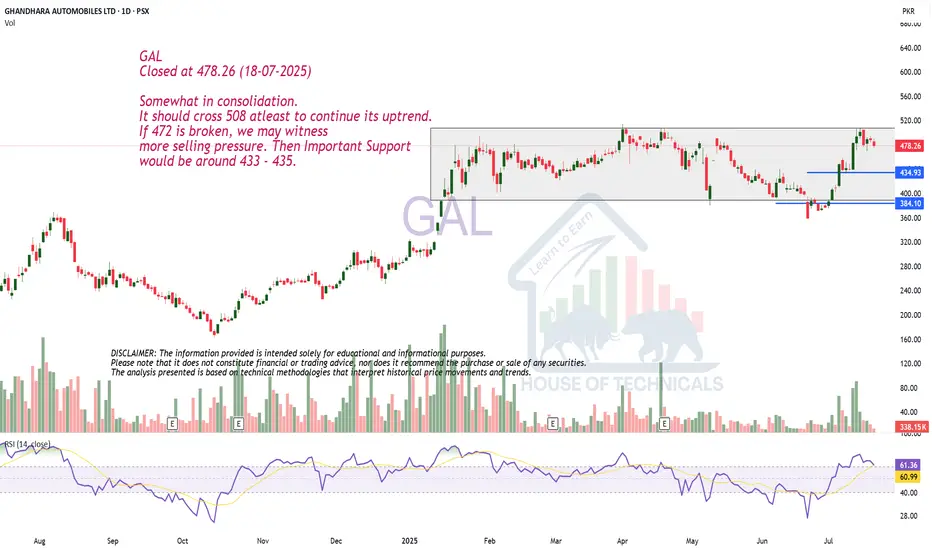
Somewhat in consolidation.GAL
Closed at 478.26 (18-07-2025)
Somewhat in consolidation.
It should cross 508 atleast to continue its uptrend.
If 472 is broken, we may witness
more selling pressure. Then Important Support
would be around 433 - 435.
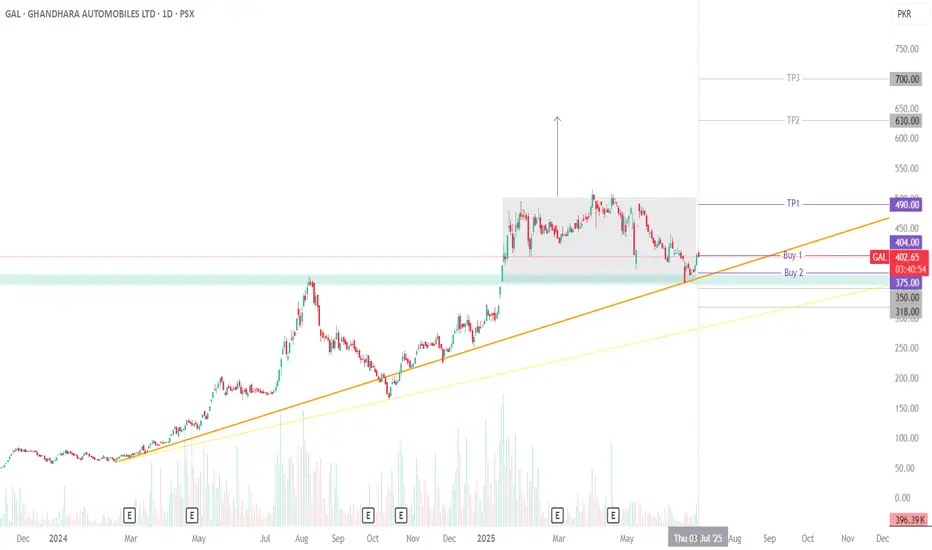
GAL Technical Analysis: Bullish OpportunityGAL (Ghandhara Automobiles Ltd.) is showing a strong bullish setup. Price is holding above its trendline after bouncing off solid horizontal and rectangle support zones. On top of that, GAL has a history of performing well in July, which adds a seasonal boost to the setup.
Fresh entries can be considered at the CMP, while for averaging or pullbacks, 375 and even 350 could offer attractive buy zones if the price dips.
For risk management, there are two stop-loss options: a conservative one below 318 to guard against broader breakdowns or gap fills, or a more aggressive one on a closing basis under 350, just beneath key structure.
Take Profit 1 at 490 lines up with rectangle resistance. A strong close above this opens the door to the next projection around 630. If price manages a firm close above 630, momentum could drive it further, with the AB=CD pattern pointing toward a stretch target near 700.
Trading Recommendations:
Buy 1 (CMP): 404
Buy 2: 375
Stop-Loss (Aggressive): Closing below 350
Stop-Loss (Conservative): Closing below 318
Take Profit 1: 490
Take Profit 2: 630
Take Profit 3: 700
Happy trading!
GAL (WEEKLY): Targeting 600 – 730 by Q1 2026#GAL (WEEKLY): Targeting 600 – 730 by Q1 2026
CMP: 447.89
#GAL seems to follow a cyclical rhythm of ~34–36 weeks (approx. 8–9 months) between impulsive rallies.
After strong rallies from Feb 2024 to Oct 2024, and again Oct 2024 to Jun 2025, a similar cycle is now in motion.
The most recent bounce near trendline support aligns with the next cycle start (June 2025).
Based on the channel’s slope and volume breakout, GAL may attempt a move toward 600–730 by early March 2026 (next cycle completion).
The dotted upper trendline and past Fibonacci-based extensions both validate this upside zone.
If momentum sustains and GAL holds above trendline support (around 400), the chart suggests a third impulsive wave could be underway. While speculative, the pattern rhythm and price geometry point toward 600–730 as a realistic upper zone into early 2026 — barring major macro disruptions.
This analysis is for educational and informational purposes only. It does not constitute investment advice or a recommendation to buy or sell any security. Always conduct your own research or consult with a licensed financial advisor before making investment decisions. Past performance is not indicative of future results. #kse100 #psx #tradeflow #GAL #pakistan

GAL | When To, How To?The weekly chart of GAL shows a strong bullish reversal after a prolonged correction phase. The stock has surged by nearly 19% this week, indicating renewed buying interest and potential trend continuation. Key resistance zones lie at 610 (mid-term target) and 730 (final target), while support rests near the breakout area of 446. Sustaining above this level may lead to further upside, though minor pullbacks could occur as part of healthy profit-taking. Overall, the chart structure favors a bullish outlook with a medium- to long-term perspective.

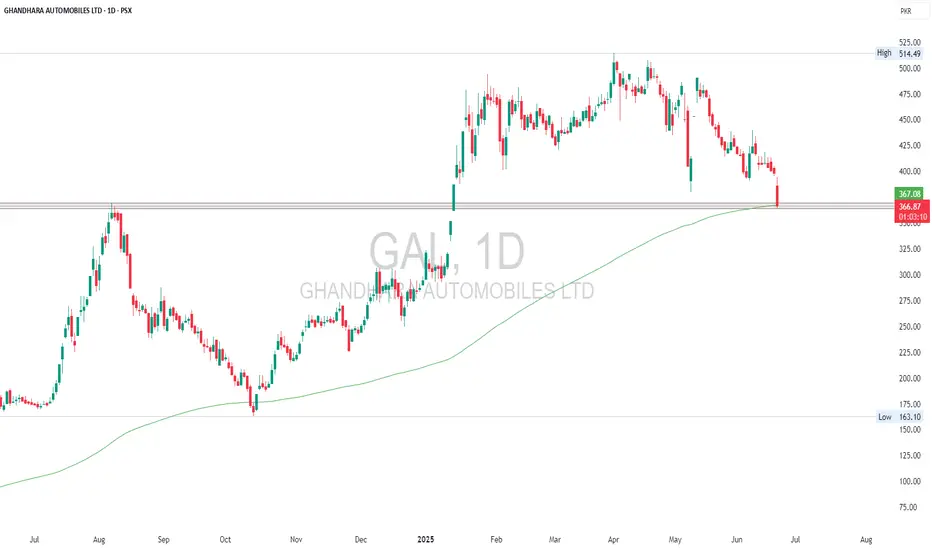
Play on Levels.GAL Analysis
Closed at 408.92 (03-07-2025)
Important Support is around 367 - 382
Resistance is around 433 and then around
450 - 455.
Crossing 460 may lead it towards 500+
However, breaking 365 may bring more
selling pressure towards 340.

GAL | Confluence of Support & ResistanceGAL is currently testing a critical support zone near 366, which aligns closely with the 200-day EMA (367). The stock has seen a sharp drop with increased volume, suggesting strong selling pressure. However, this area also coincides with previous resistance-turned-support, making it a potential bounce zone. Holding above this level could lead to a reversal, but a breakdown below may trigger further downside.
GAL LONG TRADEGAL is in a Consolidation since past 5 months- the simple Rule of Trading Ranges is "BUY LOW AND SELL HIGH". GAL has been trading towards channel bottom and now has shown a significant reversal confirmed by HL, VG and price crossing over EMA-20 on 1H TF.
🚨 TECHNICAL BUY CALL –GAL🚨
🎯 BUY ZONE: Rs. 425-430
📈 TP 1: Rs. 445
📈 TP 2: Rs. 468
📈 TP 3: Rs. 490
🛑 STOP LOSS: Below Rs. 413 (Daily Close)
📊 RISK-REWARD: High Conviction | 1:5
Caution:
Buy in 3 parts within given range - Please close at least 50% position size at TP1 and then follow strict trailing SL to avoid losing incurred profits in case of unforeseen market conditions.
SHARE AND BOOST IF YOU FIND THIS HELPFUL

GAL SHORT TRADEGAL has recently broken down its upward Trendline and posted a Lower Highafter giving Shortening of Thrust
Short Sell GAL 470-490
TP 422
SL 510
