Beautiful Morning Star on Weekly tf.GGL Analysis
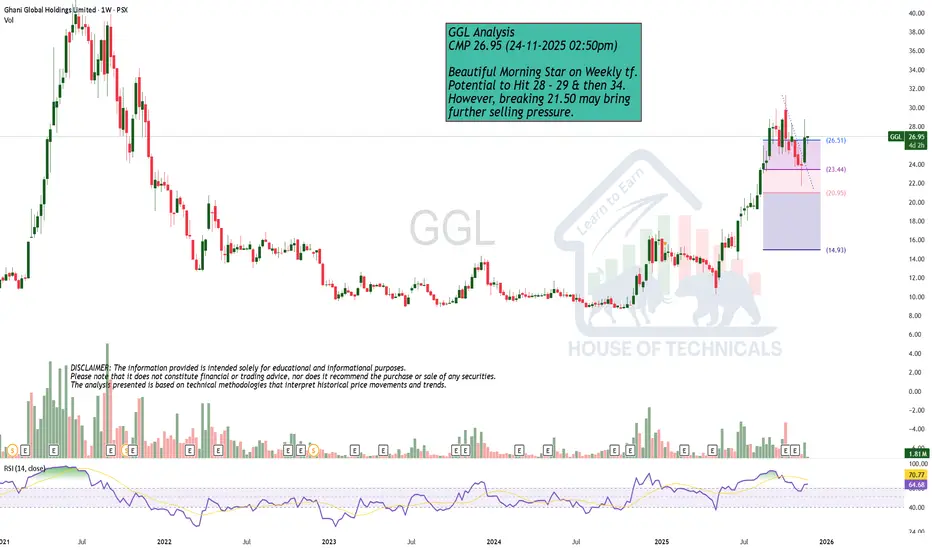
CMP 26.95 (24-11-2025 02:50pm)
Beautiful Morning Star on Weekly tf.
Potential to Hit 28 - 29 & then 34.
However, breaking 21.50 may bring
further selling pressure.
Trade ideas
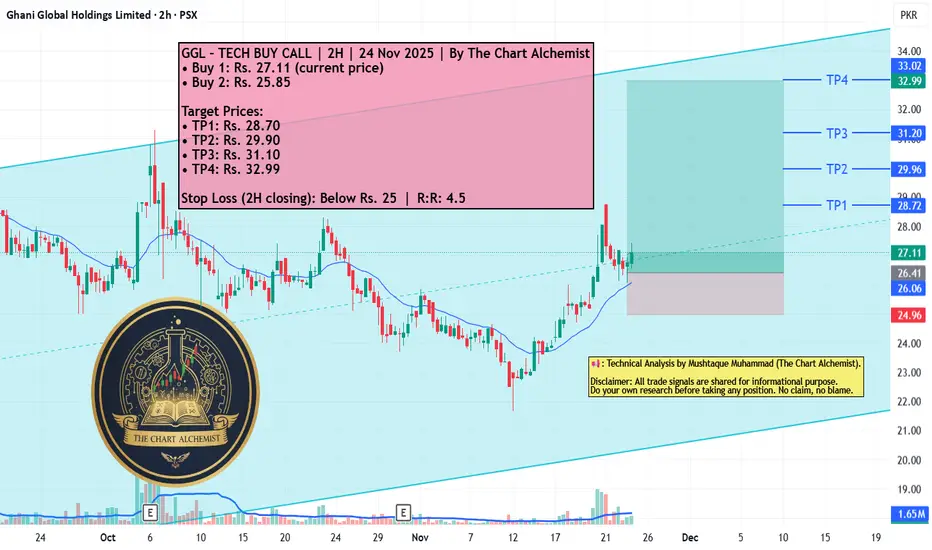
GGL – TECH BUY CALL | 2H | 24 Nov 2025 | By The Chart Alchemist GGL – TECH BUY CALL | 2H | 24 Nov 2025 | By The Chart Alchemist
GGL has been moving within a bullish channel and recently completed its bearish leg at Rs. 21.70. The stock has shown a strong reversal with multiple bullish structures forming, indicating renewed upward momentum toward higher targets.
📢 Technical Analysis by Mushtaque Muhammad (The Chart Alchemist).
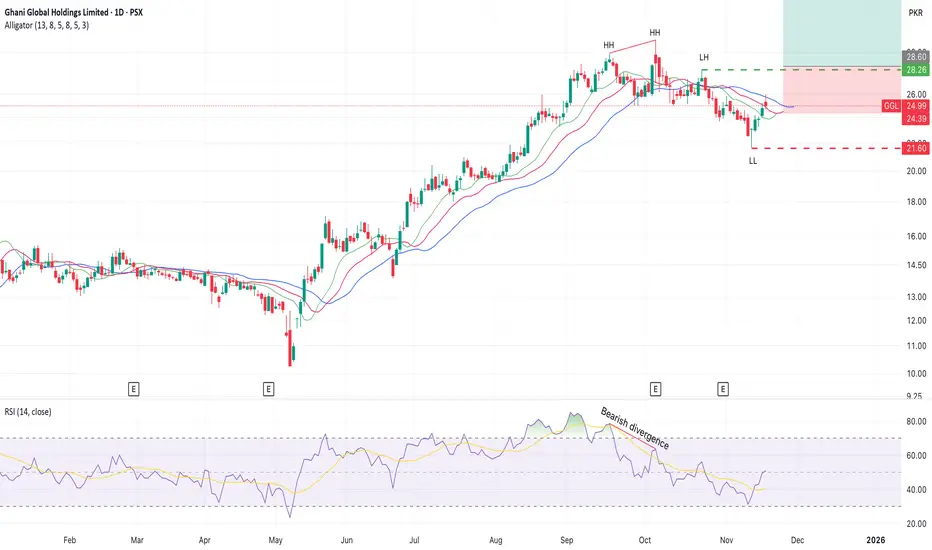
GGL to rally soon...Only Daily charts, already hit LH @ 28.2 but went slightly down.
Had an insider buying of 200K shares @ PKR.10.
Good to buy at 28.2 or current rate (whichever is lower)

GGLThis chart and analysis are shared for educational purposes only.
Nothing here should be taken as financial advice.
Please conduct your own analysis before taking any buy or sell trades.
You are fully responsible for your trading decisions, profits, and losses.

GGL an explosive stock, good fundamentals!Very good fundamentals and OPNP (Net Profit/Operating Profit) ratio of 3.78, making it a very attractive stock to buy for long-term investment.
Entry Point @ 28.6 when it breaks the Lower High and confirms the bullish trend.
GGLGGL bouncing strongly from the 0.618 retracement zone. Structure remains bullish as long as 23 holds. Momentum turning up with RSI recovery — next upside targets sit at 28.5 and 31.
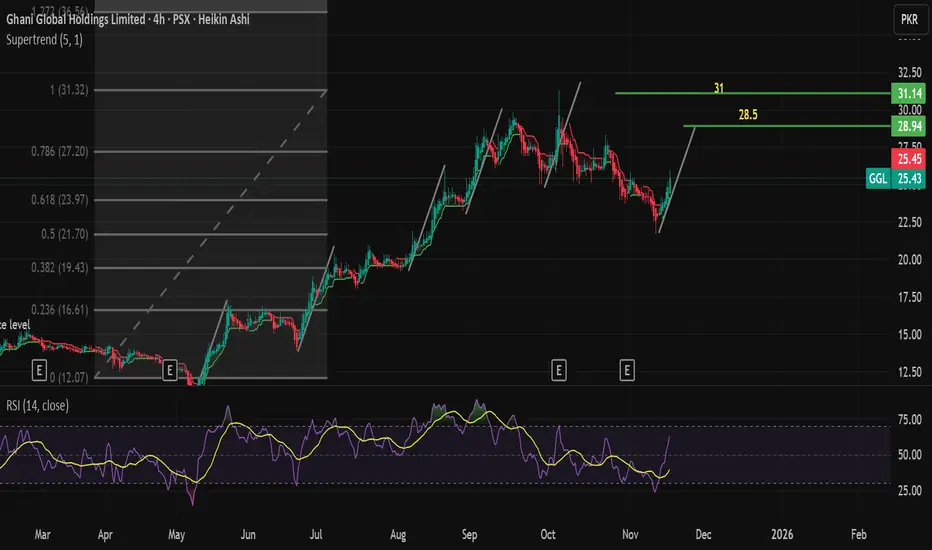
GGLGGL bouncing strongly from the 0.618 retracement zone. Structure remains bullish as long as 23 holds. Momentum turning up with RSI recovery — next upside targets sit at 28.5 and 31.

GGL – BUY TRADE | 2H TF | 22 OCT 2025 | TCA
GGL – TECH BUY CALL | 2H TF | 22 OCT 2025 | By The Chart Alchemist
The stock GGL has been trading within a bullish channel and recently formed a reaccumulation phase. After testing the lower boundary of this phase, the stock has shown a strong upward reversal, indicating the beginning of a fresh bullish leg.
📢 Technical Analysis by Mushtaque Muhammad (The Chart Alchemist).

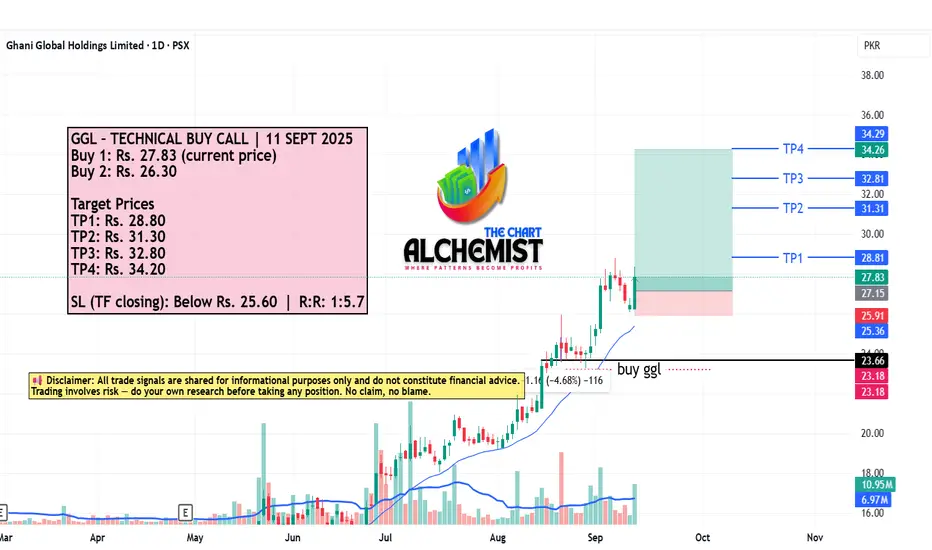
GGL – TECHNICAL BUY CALL | 11 SEPT 2025 GGL – TECHNICAL BUY CALL | 11 SEPT 2025
The stock is in an uptrend, created a bullish spike, and retraced a bullish fair value gap. This setup indicates potential for further upside movement, with defined risk management via stop loss.
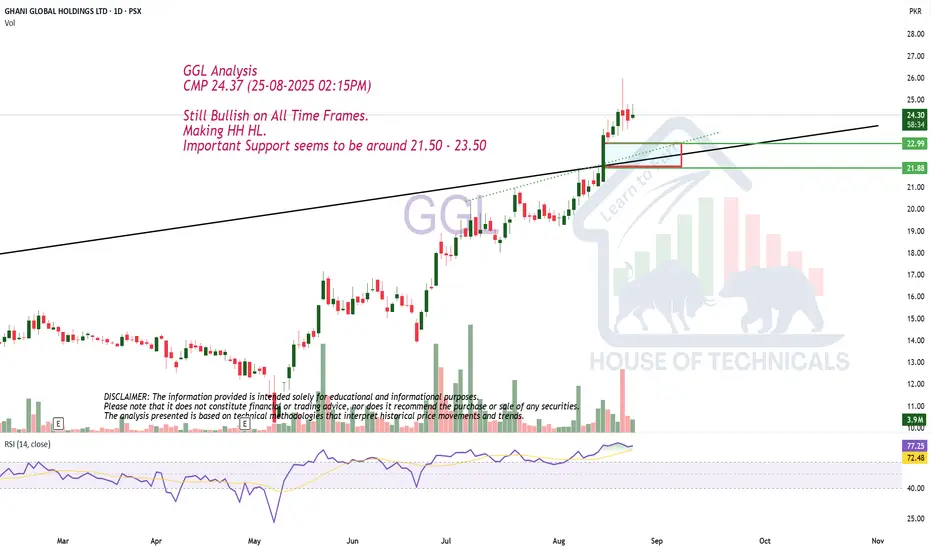
Still Bullish..GGL Analysis
CMP 24.37 (25-08-2025 02:15PM)
Still Bullish on All Time Frames.
Making HH HL.
Important Support seems to be around 21.50 - 23.50
Ghani Global Holdings Ltd. (GGL) Technical Analysis Overall Trend
On the weekly timeframe, the stock has turned bullish, making clear Higher Highs (HH) and Higher Lows (HL).
After a long consolidation phase (sideways box), price has broken out strongly and is trending upwards.
📈 Chart Highlights
Breakout from Consolidation
The stock traded in a sideways range (boxed zone) for nearly two years.
A breakout happened with strong bullish candles, confirming a trend reversal from accumulation to uptrend.
Entry Strategy
Buy instant at current levels (~23.29 PKR).
Or accumulate on pullbacks near 21–18 PKR zone (higher low region).
Stop Loss & Risk Control
Stop Loss: 13.95 PKR (below strong support & structure low).
Target Levels (Take Profit)
TP1: 31.58 PKR (intermediate resistance & previous swing projection).
TP2: 39.96 PKR (major resistance & projected higher move).
📊 Indicators
RSI Divergence Indicator (14):
Currently at 78.73, showing strong bullish momentum.
Earlier bullish divergences supported the breakout from consolidation.
Overbought, but this is often a sign of strength in breakouts on higher timeframes.
Trading View
GGL has moved from a long consolidation into a clear uptrend.
The bullish structure remains valid as long as HL > 18 PKR.
If the price corrects, it may retest 21–20 PKR zone before resuming the rally toward TP1 and TP2.
Summary: Ghani Global Holdings (GGL) on PSX has broken out of multi-year consolidation and is trending bullish on the weekly timeframe. Buy entries are valid around current levels or dips toward 21–18, with stop loss at 13.95. Targets are 31.58 and 39.96, supported by strong momentum and bullish RSI signals.


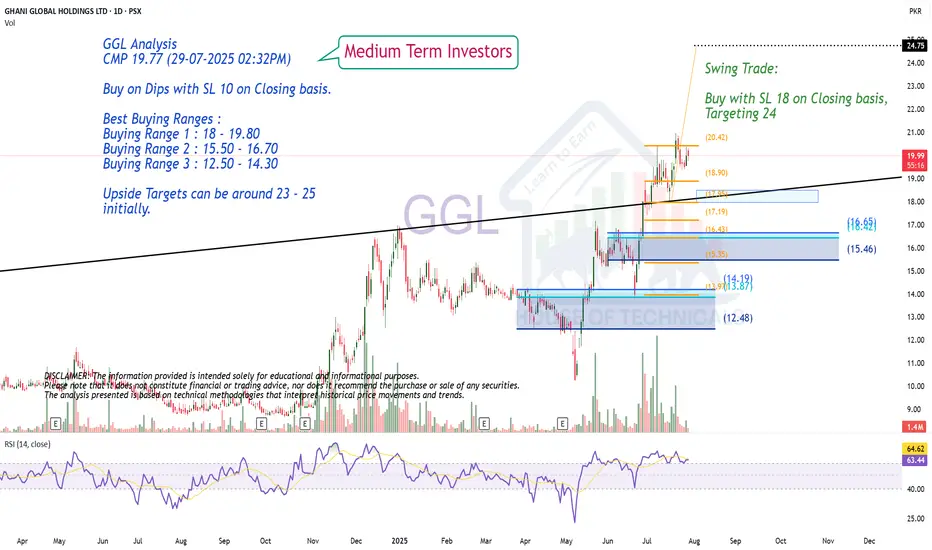
Buy on Dips with Proper SLGGL Analysis
CMP 19.77 (29-07-2025 02:32PM)
Buy on Dips with SL 10 on Closing basis.
Best Buying Ranges :
Buying Range 1 : 18 - 19.80
Buying Range 2 : 15.50 - 16.70
Buying Range 3 : 12.50 - 14.30
Upside Targets can be around 23 - 25
initially.
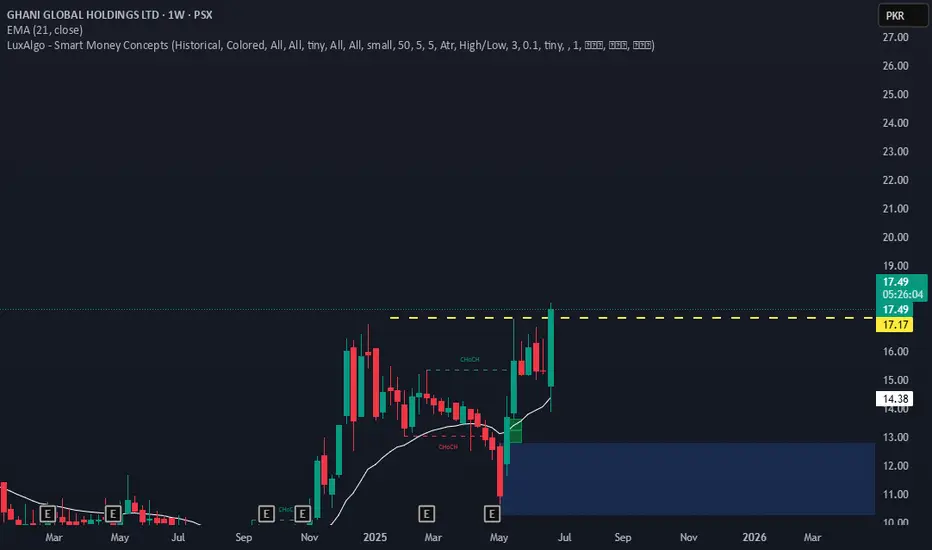
GGL expected Buying Opportunity if this week close above 17.17. we expect bullishness for the next week.
GGL, position TradeBreakout of range, Breakout an retest , price got support of SMA 200 on daily TF.
Profit targets are 23,33 and 40

GGL potential bullish setup GGL in accumulation phase expected breakout is Bullish, entry with a buy stop over the Accumulation box.

Play on LevelsGGL - Closed at 15.67 (23-05-2025)
Ideal Support levels:
S1 around 15.07 - 15.15
S2 around 13.86 - 14
S3 around 12.80 - 13
Upside targets can be around 17-18
if these supports are respected.

GGL SHORT TRADEGGL is in Distribution phase of Wyckoff Cycles
It showed Shortening of Thrust and Lower High
Short Sell GGL if it falls below 12.5
TP1 11.6
TP2 10.9
TP3 10.2
SL 12.7

GGL BULLISHGGL dropped from 16.95 and made a low of 10.26 and now broke and vlosed above Daily Retracement Line and its further Target is 16.90
Bullish

GGL Likely to Touch PKR 20.62 SoonGhani Global Holdings Limited (PSX: GGL) is displaying strong bullish signals, with rising volume and a steady uptrend pushing the price closer to key resistance levels. The stock recently rebounded from support around PKR 12.00 and has been forming higher lows on the daily chart — a classic bullish structure.
Momentum indicators like RSI remain in healthy territory, and a breakout above PKR 16.96 (the 52-week high) could trigger a rally toward PKR 20.62. With improving investor sentiment and positive fundamentals, GGL looks poised to test this level in the short to medium term.
This is not buy or sell call do your own research.

GGL- PSX - Symmetrical TriangleGGL has formed a symmetrical triangle in the 1D time frame. Look for the upward breakout or downward breakdown for bullish or bearish entry accordingly.

Buy on DipsShort to Medium Term ULTIMATE TARGETS CAN BE 25 - 26
& Then 40 -45
Best Buying Price would be around 11 - 12 (if it comes).

GGLGGL has given the strong breakout of almost 2 years accumulation. currently it is holding the breakout firmly. And the good thing is bullish cross over is just ready to happens. If this breakout sustains we can witness the huge rally to the upside.
