GHGL Technical Analysis: Bullish Setup in PlayGHGL (Ghani Glass Limited)
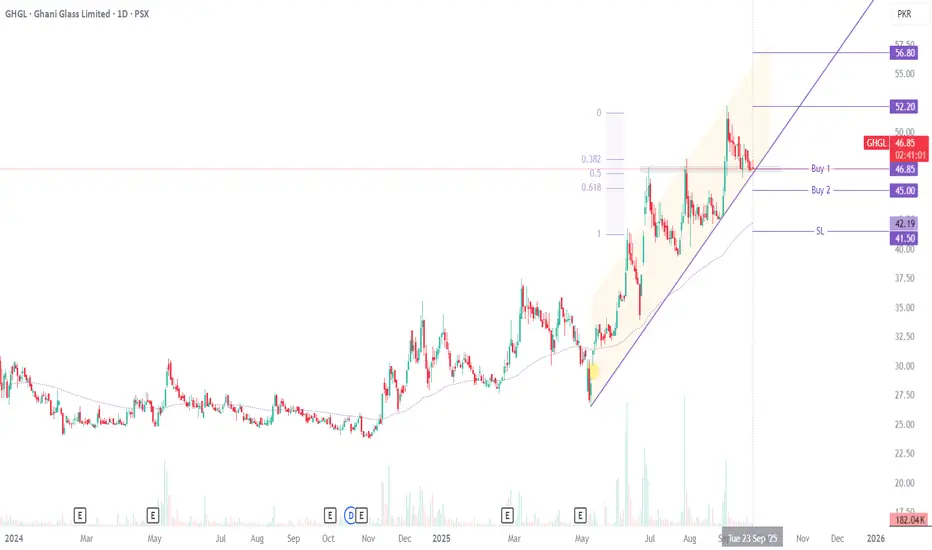
Price is trading above the 89 Fibonacci EMA, a level it has historically respected, reinforcing the bullish structure. Currently, it sits at a strong support zone near the 0.5 Fibonacci retracement, aligning with the ascending channel support. RSI is in sync with the setup, adding further confirmation.
The first buy is positioned at CMP, with Buy 2 placed lower in case of a healthy pullback for a stronger average. TP1 targets the recent higher high/resistance, and TP2 aligns with further upside potential. Stop loss is placed below the previous higher low or a closing below the 89 EMA to define risk.
Recommended Levels:
Buy 1: 46.85 (CMP)
Buy 2: 45.00
Stop Loss: Closing below 41.50
Take Profit 1: 52.20
Take Profit 2: 56.80
Potential upside remains as long as price sustains above the ascending channel support and 89 EMA. Happy trading!
GHGL trade ideas
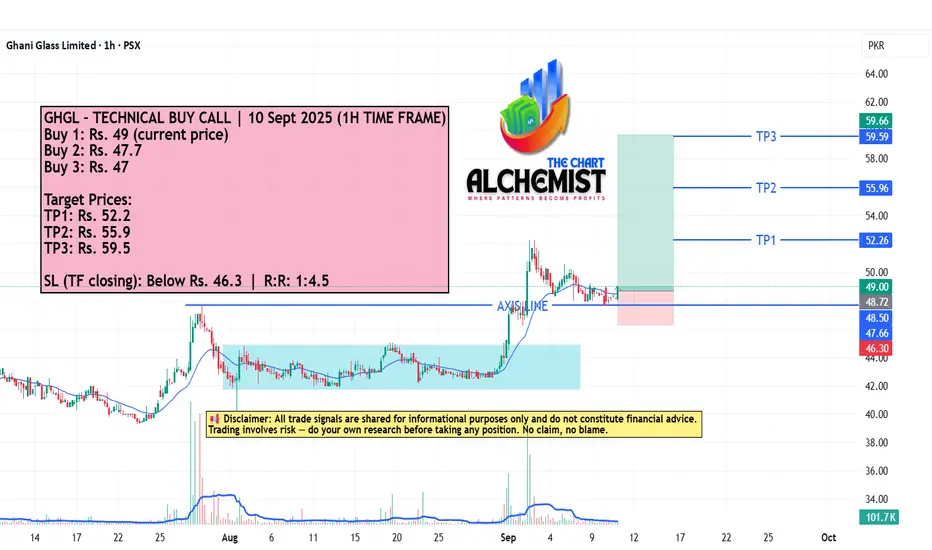
GHGL – TECHNICAL BUY CALL | 10 Sept 2025 (1H TIME FRAME) GHGL – TECHNICAL BUY CALL | 10 Sept 2025 (1H TIME FRAME)
The stock broke out of a trading range, posted a high of Rs. 52.3, and is now expected to move upwards after a pullback.
LONG GHGLLonged GHGL. Bought spot shares here. Entry, Stop Loss and Exit all there. Worth a punt!
Manage your risk! #DYOR

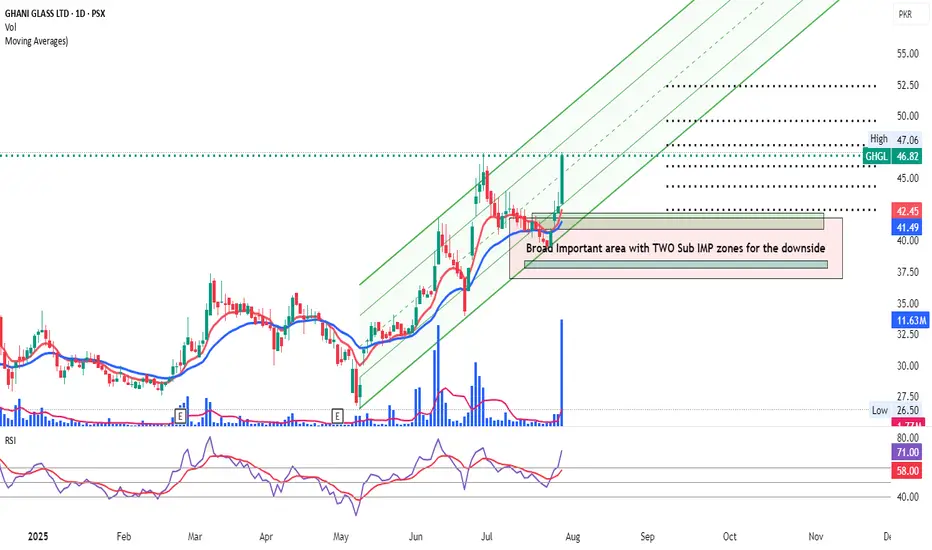
GHGL on the daily TFWith SnR Price levels marked on chart and TWO imp zones highlighted on the downside in case scrip changes it mood....
With the adv to do take in to account Index considerations as it is precarious, currently and we all need to exert due care to avert getting dented.
Bullish on All Time Frames.GHGL Closed at 39.61 (13-06-2025)
Bullish on All Time Frames.
Important Support Level seems
to be around 39 & then 34 - 36.
Breaking 33 may result in further
selling pressure.

Long...Immediate Resistance is around 28.70 - 29
which needs to be Sustained to reach 32
initially.
Next Target can be around 36 - 37 & then 40 - 41.
On the flip side, Immediate Support is around
26 - 26.35
However, it should not break 23.50 now.

GHGLA symmetrical triangle is a chart pattern used in technical analysis that is characterized by two converging trend lines connecting a series of sequential peaks and troughs. The trend lines converge to form a triangle that slopes symmetrically, indicating that neither buyers nor sellers are in control. Here's a breakdown of the key points:
Characteristics of a Symmetrical Triangle:
1. **Converging Trend Lines**: The upper trend line is formed by connecting a series of lower highs, and the lower trend line is formed by connecting a series of higher lows.
2. **Symmetry**: Both trend lines converge towards each other, creating a shape that looks symmetrical.
3. **Volume**: Typically, the volume decreases as the pattern progresses and the price moves towards the apex of the triangle.
4. **Breakout**: A breakout typically occurs before the price reaches the apex of the triangle. This breakout can be in either direction – upwards or downwards – and is often accompanied by a significant increase in volume.
5. **Continuation or Reversal**: This pattern can signal either a continuation of the existing trend or a reversal, depending on the direction of the breakout.

GHGL is BullishGHGL has given a breakout from the accumulation phase by breaking previous lower high. This could mark the beginning of a bullish rally. Targets are mentioned on the chart.


PSX: GHGL VITAL SIGNS ARE TRANSFORMING IN TO STRENGTH SIGNALSOn 3rd of November it was pointed out that script is gaining strength subsequently it hit all its targets.
now after retracement it has started showing the signs of vitality. This time the plan has been prepared in 2hrs time frame. Risk and reward ratio is very good.
Entry levels are more than one.
1. Current level is for aggressive traders.
2. Suggested level 34.75 is for cautious traders.
3. HH i.e. 36.75 is who want to be extremely cautious.

PSX: GHGL VITAL SIGNS BECOMING STRONGER After a long downtrend, which began in 2021, the script is trying to get some foothold from the June of this yeare. These effors seems to be taking some ground.
In this process the script has completed the Harmonic pattern and (PRZ ) potential reversal zone has been established and it is suggested to place the stop loss below this point.
We can use the R-1 and R-2 as our Target Prices.
Another hidden factor, which is not visible on the chart is the two bottoms of harmonic pattern forms "bullish divergence" on weekly chart.
