HGFA – BUY TRADE | 1D | 11 OCT 2025 | TCAHGFA – TECH BUY CALL | 1D | 11 OCT 2025 | By The Chart Alchemist
After reaccumulating in a trading range (marked light purple), the stock broke out, achieving a high of Rs. 15.5 and forming multiple bullish structures. Following a sharp pullback, HGFA completed its second upper leg, reaching Rs. 21.4. The stock is now taking support from the 20-EMA, suggesting that the recent pullback may be complete and an upward move may resume.
📢 Technical Analysis by Mushtaque Muhammad (The Chart Alchemist).
Trade ideas

HGFA – TECHNICAL BUY CALL | 03 SEPT 2025 HGFA – TECHNICAL BUY CALL | 03 SEPT 2025
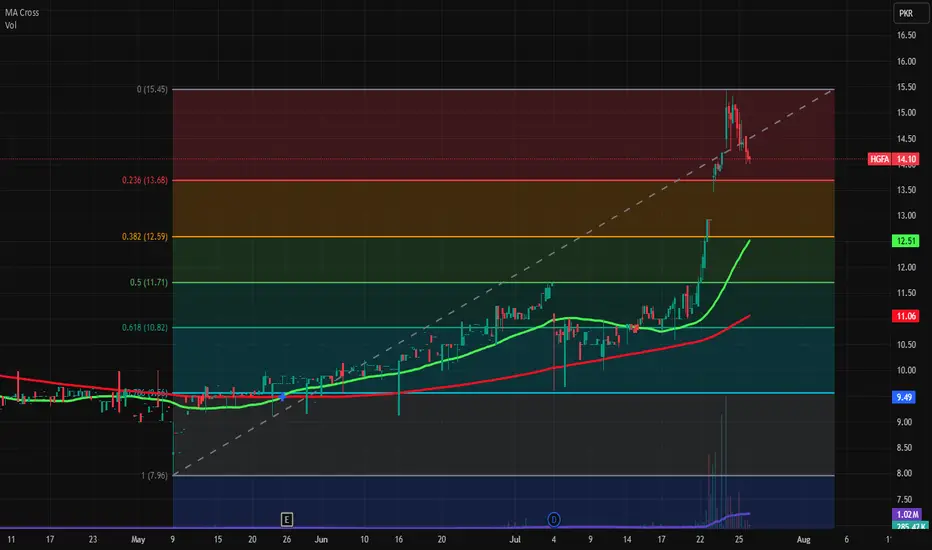
The stock broke out of an accumulation phase, achieved a high of Rs. 15.43, pulled back, and now seems poised to continue upward.

HGFA zonesWith strong fundamentals it was grown rapidly in last few days. Today it was in bearish trend but with very less volume, we can say it correction, profit taking of rollover week and month closing.
These are key levels
15.45
13.68
12.59
11.71
10.82