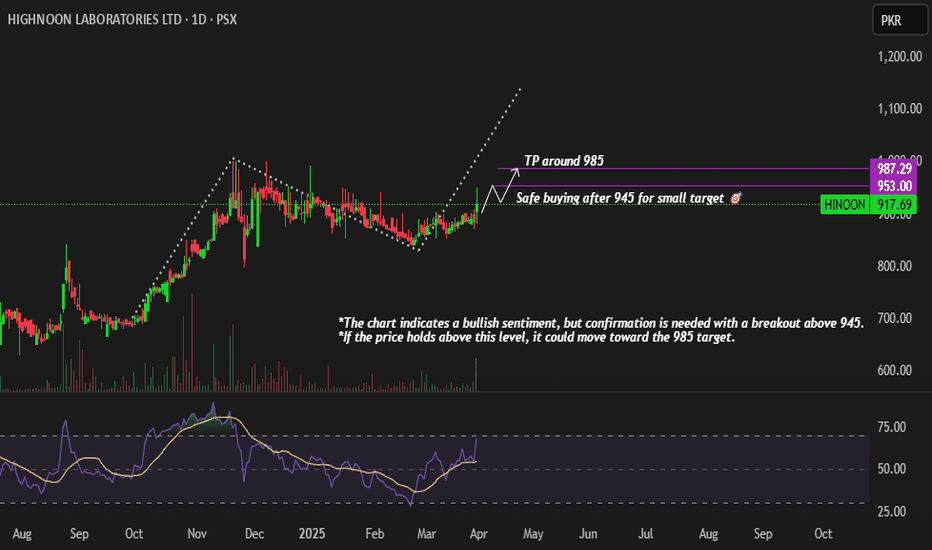
HinoonPSX HINOON 1D chart
Stock forming a bullish flag setup after a strong impulsive rally.
Breakout confirmation expected with expanding volume.
Overall structure remains bullish continuation.
📊 Fundamentals
✅ Pros:
Strong revenue and profit growth.
Well-managed pharma company with export potential.
Healthy balance sheet and consistent dividend.
⚠️ Cons:
Slightly high valuation compared to peers.
Regulatory and currency risks in pharma sector.
Verdict: Fundamentally strong, technically poised for bullish continuation once breakout confirms.
Trade ideas
HINOON: Flag and Pole pattern on 1D TF. Potential rally likelyHINOON is in uptrend printing HHs and HLs on 1D timeframe. Recently the chart has formed a Flag and Pole pattern. It is likely that break of previous LH (941.62) shall result in another rally that may take the price upto level of 1207.30. SL is placed below lowest point of the flag (831.72).
It is pertinent to mention that previous all time high of 1,000.00 may act as a major resistance and we may need to be careful for any reversal indications at this point. However, at this point there is no apparent indication of reversal from current price level.
TPs may be broken as per following:
TP1=1051.52
TP2=1161.42
TP3=1207.30


