IMAGE (PSX: IMAGE) – Weekly ChartPrice is retracing towards the 50% Fib (27.37) after a strong bullish breakout.
As long as it holds above the 25–27 PKR zone, the uptrend may continue.
🎯 TP: 35–36 PKR
🛑 SL: 25 PKR (below 61.8% Fib)
Trade ideas

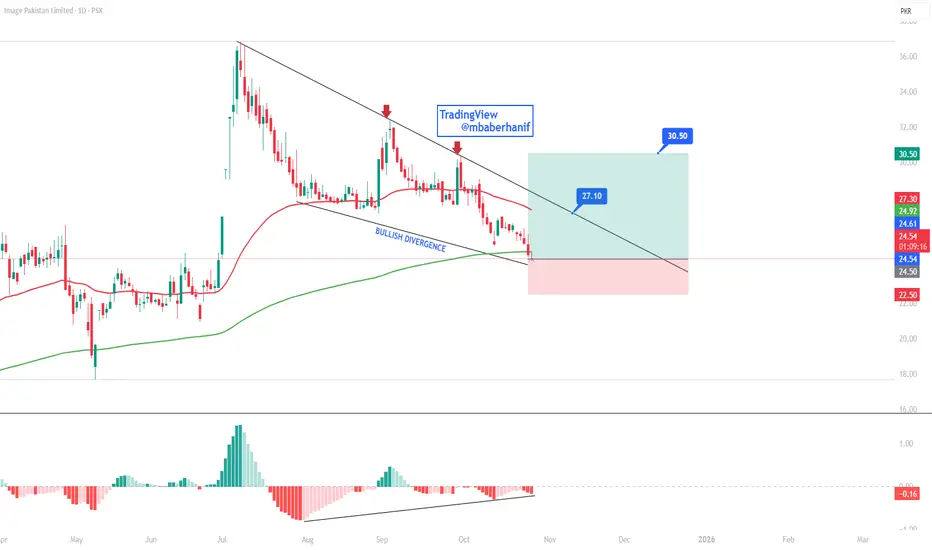
IMAGE Showing Strong Divergence SetupThe stock is currently trading near its lower trendline support within a descending channel. A bullish divergence is observed between price action and the MACD histogram, indicating potential reversal momentum. If the price sustains above current levels and breaks the descending trendline, it may target PKR 27.10 initially and PKR 30.50 subsequently. However, a decline below PKR 22.50 would invalidate this bullish setup.
ImageIMAGE (Image Pakistan Ltd – 1D, PSX)**
Pattern:** Rising channel with Fibonacci retracement zones
Price:** 24.76 PKR
Support:** 24.2–24.5 (channel base + horizontal demand)
Resistance:** 27.3–27.5 (Fib 0.5 level)
Trend:** Medium-term bullish channel, currently testing lower support
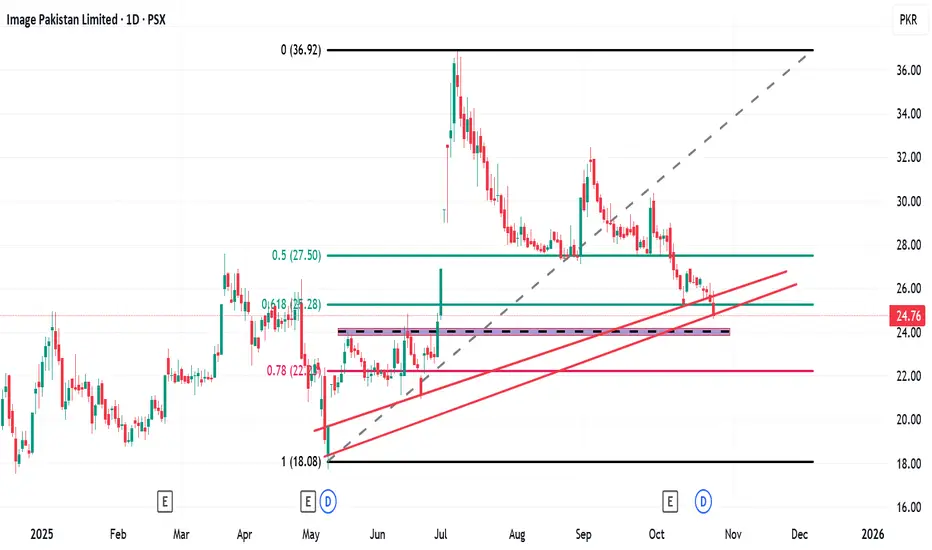
IMAGE LONGBullish breakout
Enter 29.29 & 30.65 PKR
Target @ 36.36
Core Business: Designs, manufactures and retails embroidered fabrics and ready‑to‑wear women’s garments under the Image brand
Key Financials (latest quarterly / Q3 2025): Sales ~PKR 1.00 bn
Share‑Price Performance :
Strong corporate earnings, robust revenue growth in retail apparel.
Expansion of distribution and e‑commerce channels.

PSX - IMAGE - Long PositionTrend: Bullish
Print: HH/HLs
Supported: Tested
Divergence: No
Candle Pattern: Engulfing Candle
Trade Plan:
Entry: CMP
SL: 17.57
TP: 45.75
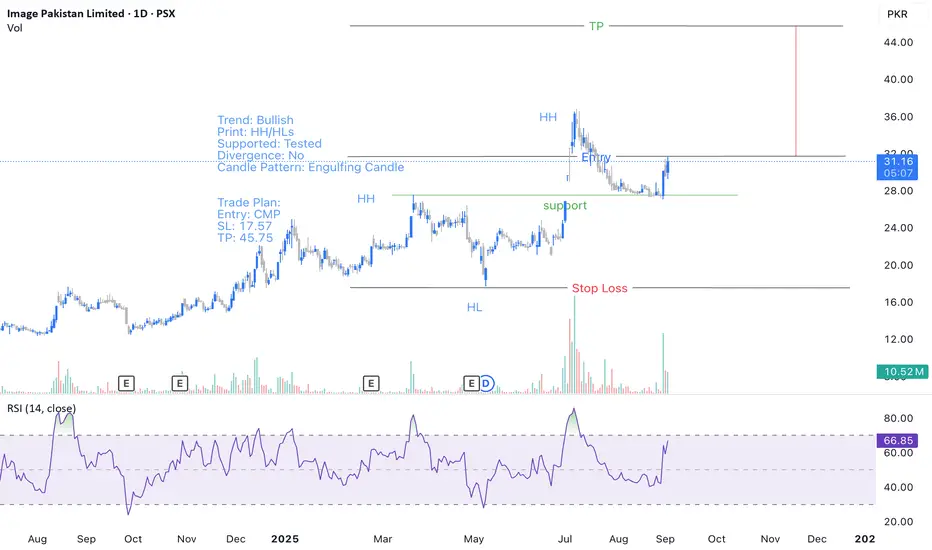
IMAGE Technical Analysis: Bullish OpportunityImage Bullish Setup:
Price is moving in a bullish trend and recently bounced from the 0.5 Fib level, which coincides with a previous resistance, now acting as support. Volumes are strong, showing healthy buying interest. RSI is in sync with price, confirming bullish momentum. Fundamentally, this is a strong stock, which adds more weight to the bullish bias.
Recommended levels:
Entry (CMP): 28.75
Stop Loss: Close below 26 (or below the rising trendline / 89 EMA that the stock respects)
Take Profit 1: 32.35
Take Profit 2: 36.30
Happy trading!

IMAGE – TECHNICAL BUY CALL | 27 AUGUST 2025 (1D TF) IMAGE – TECHNICAL BUY CALL | 27 AUGUST 2025 (1D TF)
The stock broke out of a reaccumulation phase, marked a high of Rs. 37, pulled back, and now seems to be resuming its journey.

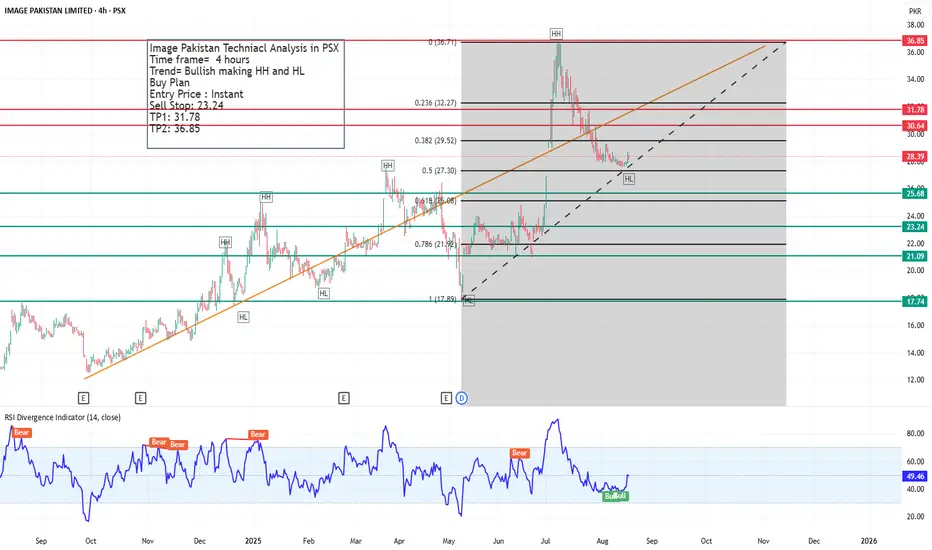
Image Pakistan (PSX) Technical AnalysisOverall Trend
The stock is in a bullish structure, forming Higher Highs (HH) and Higher Lows (HL) on the 4-hour timeframe.
Currently, the price is holding above recent support and showing a possible continuation of the bullish trend.
📈 Chart Highlights
Trendline Support & Fibonacci Retracement
Price retraced from the 36.71 PKR peak and found support near the 0.618 retracement (25.86 PKR).
It respected the trendline support and bounced, confirming higher low (HL) formation around 28 PKR.
Entry & Risk Management
Entry: Instant (current level ~28.39 PKR).
Stop Loss (Sell Stop): 23.24 PKR (below trendline & key Fib level).
Target Levels (Take Profit)
TP1: 31.78 PKR (near 0.236 Fib resistance).
TP2: 36.85 PKR (previous swing high / top).
📊 Indicators
RSI Divergence Indicator (14-period):
Currently at 49.46, near the neutral zone.
Recent Bullish Divergence has been printed, suggesting possible momentum shift upward.
🔑 Trading View
The stock is in a bullish continuation phase unless it breaks below 23.24 PKR.
Above 29.50 PKR (Fib 0.382), strength will increase toward TP1 and TP2.
If the price consolidates near current levels, it can attract more buyers for the next rally.
✅ Summary: Image Pakistan Limited on PSX is technically bullish, forming HH & HL. A buy setup is active with TP1 = 31.78 and TP2 = 36.85, while keeping 23.24 as the protective stop loss. RSI also supports the bullish view.
Hidden Bullish Divergence on Bigger tf.IMAGE
Closed at 21.94 (27-05-2025)
Hidden Bullish Divergence on Bigger tf.
Monthly Closing above 20.70 will be a
positive sign.
Upside Targets can be around 26 - 26.50
On the flip side, 20.50 - 20.68 is a Good
Support zone and then around 19.
Should not break 17.30, otherwise we may
witness nd Reversal.

IMAGE PAKISTAN LONG TRADE IDEAImage pakistan Swing trade plan ..
Multiple Confluence Target with one price

IMAGE Share Buying StrategyIMAGE Share Buying Strategy
Here's a breakdown of the PIAHCLA trading strategy:
Key Points:
1. Buy Range: 28-30
2. Stop Loss: 27
3. Target1: 34
4. Target 2: 36
Strategy:
The strategy involves buying IMAGE Pakistan when the price is between 28 and 30, with a stop loss set at 27 to limit potential losses. The target price range is 34 to 36, indicating a potential upside of around 13% - 24% from the buy range.
Risk Management:
The stop loss at 27 would limit the potential loss to around 3%-5% from the buy range.
Would you like more information on trading strategies or risk management?
hold if sustain above 36 are use trailing stop loss

IMAGE LONG TRADEIMAGE has been trending in perfect uptrend channel.
Though it broke down from the channel but that behavior signifies impending bullish move for three reasons.
1. Price has created Spring or Bear Trap through its recent support level of 18.80 and rebound
sharply upwards in a Liquidity Sweep manner to shake off weak hands
2. Price also took support from major Bullish Breaker Block at 18
3. Wave Volumes support the impending up move
BUY IMAGE 19-22
TP1 25.50
TP2 29.50
SL 17.20

ABCD still intact..Couple of Green candles above 20
would trigger more positivity.
Upside targets are intact 27-28 &
then 30+
Should not break 17 now.

IMAGE LONG TRADEIMAGE is in upward trend, it has completed ABC corrective move and a Bear Trap on 9/5/25.
This bear trap/spring highly suggests start of final upward leg of the scrip before major correction after testing/exceeding recent highs
BUY IMAGE 18-20
TP1 22.8
TP2 25.5
TP3 29.5
SL 16

Approaching important Support Zone..Important to take Support from
this Level ( 21.30 - 22.50).
Otherwise more selling pressure
will be observed.

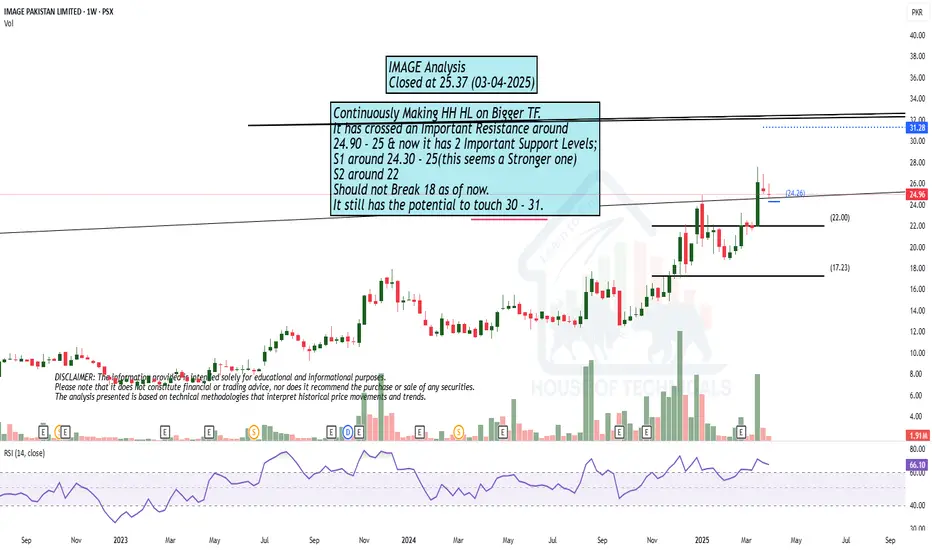
Continuously Making HH HL on Bigger TF.Continuously Making HH HL on Bigger TF.
It has crossed an Important Resistance around
24.90 - 25 & now it has 2 Important Support Levels;
S1 around 24.30 - 25(this seems a Stronger one)
S2 around 22
Should not Break 18 as of now.
It still has the potential to touch 30 - 31.


still Bullish on all Time frames.Evening Star formation on Daily TF.
However, it is still Bullish on all Time frames.
It is currently at Make-it or Break-it sitaution.
Next Support is around 17.90 - 18.50
On the flip side, 24.50 is an immediate resistance.

ImageImage breaking out to all time highs. Leading the way as other big textile companies are yet to breakout.


Image-Buyin entire 2024, Image traded in consolidation box. at the same time a cup & handle pattern also appeared on the chart. Now recently, it gave breakout of consolidation Box and cup & handle pattern with excessive volumes which shows strength of Bulls.
Buy at current Price
Target Price: Projection of Consolidation Box and Cup & Handle Pattern
SL: last LL.
