Meezan Bank Limited Technical analysisTrend Structure:
The stock was in a strong uptrend within a well-defined ascending channel from March through October, reaching a peak around 500 PKR. However, it has since broken down from this channel.
Current Situation:
Price is currently at 426.41 PKR, down 0.46%
Trading below both channel support lines
The breakdown suggests potential trend reversal or deeper correction
Key Levels:
Strong support zone around 350-360 PKR (2.618 Fibonacci extension marked)
Previous resistance-turned-support around 400-420 PKR being tested
Upper channel resistance now around 440-460 PKR
Volume:
Volume has been declining recently, showing weakening momentum after the breakdown.
Outlook:
The chart shows bearish bias after the channel breakdown. If 420 PKR support fails, the stock could retest the 350-360 PKR zone. A recovery back above 440 PKR would be needed to regain bullish momentum. The overall structure suggests the uptrend may be exhausted, at least temporarily.
Risk: The breakdown from a long-term ascending channel is typically a significant bearish signal.
Trade ideas

MEBL - PSXPrice is between weekly channel
Price is on it’s strong weekly support
Price is still in its bullish trend
Currently price is in accumulation from 425 to 465
Vol are in down trend
Buying at 425 can give profit of 40 at 465

Meezan Bank Limited (PSX)Current Situation
Price: 454.47 PKR (down 28.76 or 6.76%)
Trend: Trading within an ascending channel that has been in place since May
Key Technical Observations
Support & Resistance:
The stock is currently testing the lower boundary of the ascending channel around 440-450 PKR
Major support level at 350.66 PKR (marked horizontal line) - this was the breakout point
Upper channel resistance is around 520-530 PKR
Recent Price Action:
After reaching near 500 PKR in October, the stock has pulled back significantly
Currently consolidating in the 440-470 range
Today's 6.76% drop is notable but volume appears moderate
Volume Analysis:
Recent volume is lower compared to the strong accumulation seen in May-June and August
This could indicate a healthy consolidation rather than distribution
Trading Scenarios
Bullish Case:
If the stock holds the lower channel support (440-450), this could be a buying opportunity
Target would be a retest of 500 PKR and potentially the upper channel line
Risk/reward appears favorable at current levels
Bearish Case:
A break below the ascending channel (sub-440) would be concerning
Next major support would be around 400 PKR
A breakdown could lead to a test of the 350-360 PKR support zone
Conclusion
The stock remains in a broader uptrend but is currently at a critical juncture. Watch for how it responds to the channel support - a bounce would confirm bullish continuation, while a breakdown would suggest further downside.

Meezan Bank Limited (Daily chart analysis):Current Situation: 📊
Price: 442.74 PKR, down 2.12% 📉
Volume: 1.03M (low volume day)
Another banking stock showing weakness after parabolic rally! ⚠️
The Big Picture: 🎯
Meezan Bank had an epic run from 200 in late 2023 to 510 in September 2025 - that's a 155% gain! Now showing classic signs of exhaustion after hitting the channel top. Similar pattern to Hub Power and BOP we analyzed earlier. 🚀➡️🛑
Key Technical Levels: 🎯
Support Zones:
Immediate: 430-440 (current breakdown zone) ⚠️
Strong: 410-420 (previous consolidation + channel support) 💪
Critical: 390-400 (channel midpoint + round number) 🛡️
Major: 360-370 (2.618 Fib extension) 🏰
Deep: 330-340 (lower channel boundary) ⚓
Resistance Zones:
Immediate: 460-470 (recent breakdown area) 📊
Strong: 490-500 (recent highs before collapse) 🔴
Major: 510-520 (all-time high zone) 🏔️
Extension: 605 (3.618 Fib - unrealistic now) 🚫
Chart Pattern: 📐
Rising channel from May 2025 to October 2025 (white lines) 📈
Price touched upper channel line and rejected hard 💥
Potential channel breakdown in progress! ⚠️
Similar topping pattern as Hub Power - watch out! 😰
Multiple Fibonacci extensions mapped from earlier rally
Fibonacci Analysis: 📏
From the 2023-2024 rally base:
0.786 (128.47) - Far below, not relevant
1.0 (144.45) - Historical support
1.618 (202.69) - Breakout zone in 2024
2.618 (350.65) - Key support if major correction ⚠️
Volume Behavior: 📊
Multiple volume spikes throughout the chart (circled)
Recent volume declining during rally = Weak demand 📉
Today's low volume on red day = No panic yet, but concerning
Distribution pattern potentially forming at the top 🚨
Trend Analysis: 📈
Long-term: Bullish (but weakening) 🐂
Medium-term: Neutral to Bearish 😐📉
Short-term: Bearish (broke support) 🐻
Channel support at 410-420 is critical next test 🎯
Break below channel = Major trend change! ⚠️
Technical Outlook: 🔮
Bearish Case (65% probability): 🐻
Fails to reclaim 450-460 quickly
Tests channel support at 410-420 (8% downside) 📉
If channel breaks: 390-400 then 360-370 possible 😰
Banking sector weakness continues
Similar pattern to Hub Power's correction 🔴
Neutral Case (25% probability): 😐
Bounces from 430-440 current zone
Choppy consolidation between 430-470 for weeks
Eventually resolves higher or lower
Time-consuming sideways action ↔️
Bullish Case (10% probability): 🐂
Quick V-recovery above 460-470
Resumes uptrend toward 510 retest
Would need strong catalyst or sector rotation 📰
Low probability given channel rejection 📊
Trading Strategy: 💡
For Current Holders: 😰
Yellow flag raised! Pattern looks concerning ⚠️
Stop loss: Below 420 (channel support) 🛑
Or tighter stop: 430 to preserve gains
Consider taking partial profits if profitable
Don't let a big winner become a loser! 💔
For New Buyers: 🤔
Wait for channel support test at 410-420 ✋
Better entry: 390-400 if deeper correction
Best entry: 360-370 (channel bottom - patient buyers) 🎯
Current levels are NO MAN'S LAND - avoid! 🚫
Set alerts and be patient ⏰
For Traders: 📈
Short-term bounce to 450-460 possible (risky trade)
Swing traders: Short from 460 targeting 410-420
Day traders: Watch for volatility but respect trend
Risk/reward favors downside here 📉
Comparison with Banking Peers: 🏦
Hub Power: Already correcting hard ✅
Bank of Punjab: Similar weakness pattern ✅
Banking sector showing synchronized weakness 📉
Follow the sector trend - don't fight it! 💪
Risk Assessment: ⚖️
🟡 MEDIUM-HIGH RISK 🟡
Channel rejection is significant warning 🚨
Volume patterns show distribution
Banking sector under pressure
Could be healthy correction or trend change
Risk/reward not favorable at current levels ❌
What Could Go Right: ✅
Banking sector fundamentals improve 📰
Market-wide rally lifts all boats 🌊
Finds support at 410-420 and stabilizes
Earnings or policy news provides catalyst
Quick recovery to channel mid-point
What Could Go Wrong: ❌
Channel breaks decisively below 410 🚨
Banking sector continues weakening
Corrects 20-30% like Hub Power 😱
Gets stuck in prolonged consolidation
Overhead resistance at 460-510 too heavy
Key Levels to Watch: 👀
460: Reclaim = Short-term bullish 🟢
430: Current support - holding or breaking? 🟡
410-420: Channel support - CRITICAL! 🔴
390-400: Major support if channel breaks ⚠️
Time Horizon: ⏰
Short-term (1-2 weeks): Test 410-420 likely 📉
Medium-term (1-3 months): Consolidation 390-470 range 😐
Long-term (6-12 months): Eventually resume uptrend to 500+ 🐂
Bottom Line: 🎯
Meezan Bank is showing similar warning signs as Hub Power and BOP - channel rejection after parabolic rally. The 410-420 channel support zone will be critical. If that breaks, expect deeper correction toward 360-390. Current levels offer poor risk/reward - either wait for channel support test or deeper correction. This is a "wait and see" situation, not a buying opportunity yet! 🧘♂️
Banking sector as a whole seems to be taking a breather. Patience will be rewarded with better entries! 💎
Verdict: 🚦 AVOID at current levels | WAIT for 410-420 | Watch channel support!

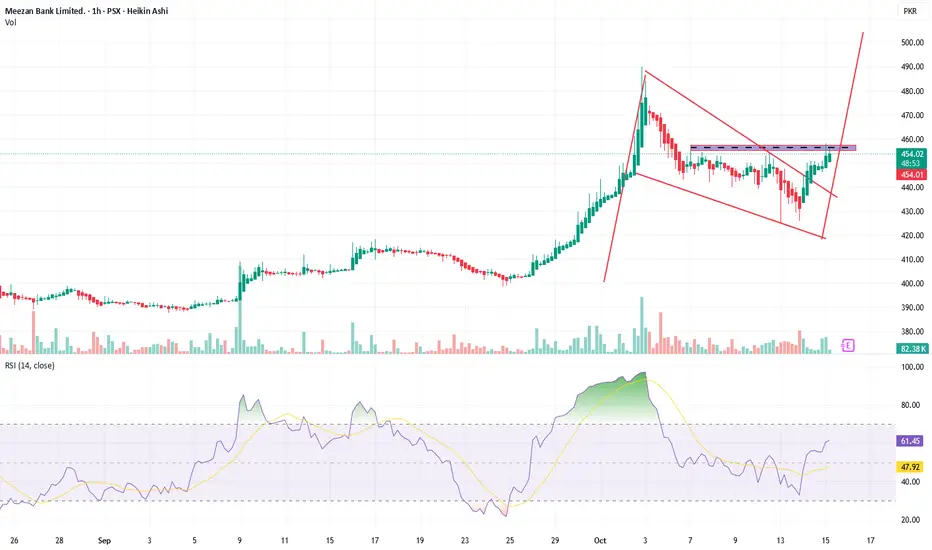
MEBLFalling Wedge Pattern, which is typically a bullish reversal formation.
The price has been consolidating downwards within two converging trendlines.
It has now broken above the upper wedge resistance, signaling a potential bullish breakout.
The neckline around 455 PKR (highlighted zone) acts as an immediate confirmation level.
MEBL UndecisiveIt can come to the bottom of Red channel and can also hit the top of it...
Keep an eye on price movement

MEBL Bullish Continuation SetupMEBL is in a continuous bullish trend, forming higher highs and higher lows. The price has currently retraced to the 0.5 Fibonacci level, aligning with support from the 13 EMA . A buy can be attempted at the current level, with a stop loss below the last low and take profit targets around the recent top and the ABCD projection.

MEBL buying StrategyMEBL buying Strategy
MEBL current price 435
buying on weakness around 428-418
stop loss 416
target 476

MEBL – TECHNICAL BUY CALL | 13 SEPT 2025 MEBL – TECHNICAL BUY CALL | 13 SEPT 2025
The stock broke out of a reaccumulation phase, achieved a high of Rs. 2,431, and after a pullback that now seems to be over, it looks ready to resume upward movement.

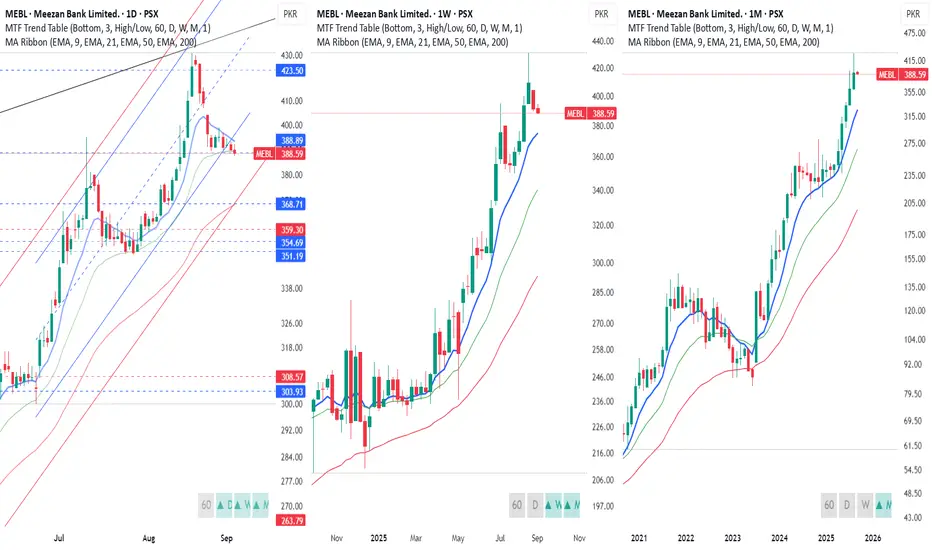
MEBL - S&R - Dow TheoryMEBL - S&R - Dow Theory
Charts prepared to represent Dow Theory and support & resistances for daily, weekly and monthly time periods

MEBL - accumulate between 355 and 390Positive trend on daily, weekly and monthly times periods.
Start accumulating MEBL between 355 to 390.
Ride the trend using EMA 9.
Expected to cross 500 by early October.
MEBL 1D LONGBullish Trend Continuation,
Entry on potential HL and SL below last established HL
TP 445.76

MEBL crosses 500 by end of September 2025If MEBL follows the monthly channel and repeats its trend then it is poised to cross 500 by end of Sep 2025

MEBL - 26 Aug 2025MEBL touching lower side of Daily channel and started to move up.
Buy at current price.

MEBL - PSX - Technical AnalysisMEBL is in sideways for almost seven months now. It is very much likely to continue in that fashion as interest rates cut is expected further.
Therefore, buy on parallel channel's bottom and sell on its top is recommended.
GANN support & Resistance fanes and Fib retracement tools have been used. Price has honoured both GANN and Fibonacci for this SCRIPT. Therefore, one can draw confluence while taking trades in this SCRIPT.
RSI is at a mid-range emphasizing on continuation of small uptrend and then fall down. KVO is also a bit bullish (above Zero), but KVO indicator line has crossed its trigger line as well which may hint at price going up.
Trade Values
Scenario ONE:
Buy-1 (Mkt): 246.64
TP: 271.75
Scenario TWO:
Buy-2: 284 (If price breaks the resistance)
TP-2: 327
Stop Loss: 207


AB=CD Pattern in MEBL IN 4 Hourly Timeframe MEBL showing AB=CD Pattern in 4 hourly timeframe
instant Buy ,stop loss defined with TP1 , TP2


MEBL : AB=CD PatternMEBL: An ABCD pattern spotted on the daily chart indicates a potential bullish move toward the Target Price (354.51)provided the price sustains and closes above the entry level price (263.86). Stop loss is defined at 205.82

MEBL Meezan Bank could drop to 220 and 210 levelsMeezan Bank could drop to 220 and 210 levels and could bounce back to 264 level.
Note: Use Stop Loss and trade at your own will, This is not a buy/sell call.

MEBL, Bullish Rally ExpectedStarting with Bullish channel
Rectangular consolidation
After bearish Divergence, Consolidation is almost completed
Divergence diluted and RSI Synced
Seasonals Support Bullish moment as NOV is bullish 9/12 Times
Entry on break of rectangle
Stoploss below 235
A new bullish rally is expected
