Meezan Bank Advance AnalysisUptrend Restart
Buy Signal:
Start buying at 212
Stop loss: 210
Take Profit: 224
Note: This is a short call, so wait and observe before taking action.
Boost: If you want more analysis, feel free to ask!
Other Company Analysis: If you'd like analysis on a different company, please mention it in the comment box.
Trade ideas

MEBL : Hourly time frame, Bullish Reversal PatternDivergence between price and momentum depicting a probability of bullish reversal movement.


MEBL-PSXSHORT SELL
break the daily suupport and and also went out from channel
next buying zone is 210 Rs
MEBL - SUPPORT S3 ON DAILY PIVOTMEBL is currently on the S3 Level of Daily Pivot and has taken support at this level. It has also retraced more than 0.786 Fib level. if it is not able to sustain the current Price level then expected to go further down, levels given. on the contrary, for upside, levels also given.

MZN Bank PSXAfter consolidation for few weeks, meezan bank is looking bullish and ready for breakout.

MEBL PSXPrice is following up trend, marking HH, HL
After HH price is consolidation and taking support from Internal Trendline.
Expected potential upside marked as TP 1, TP 2.
SL also defines.

Meezan Bank Limited (MEBL)Recommendation: Buy
Target Price (Jun-25): 340.2 PKR
Last Closing: 240.0 PKR
Upside (%): 41.8%
Key Points: Strong financial performance
, strategic focus on low-cost deposits, robust
profitability, and well-managed risk profile

MEBLCurrently MEBL is consolidating in a range, can buy after breakout of Rs. 248 with good volumes and expect continution of trend.
TP: RS 270
SL: Rs 231
MEEZAN BANK PSXMeezan Bank has touched the channel bottoms, indicating a potential buying opportunity. The recommended Entry level is 244, with a Stop loss set at 218 to manage risk. The Take profit target is 270, suggesting a favorable risk-reward ratio. 📈💼
Happy trading! 🚀💰

MEBL Technical Analysis: Breakout and Reversal Opportunities.Meezan Bank Ltd (MEBL) Technical Analysis Commentary
Current Price: 237.50 PKR
Resistance Levels:
- Primary Resistance: 260 PKR
- Secondary Resistance: 280 PKR
- Tertiary Resistance: 300 PKR
Support Levels:
- Primary Support: 190 PKR
- Intermediate Support: 210 PKR
Trend Analysis:
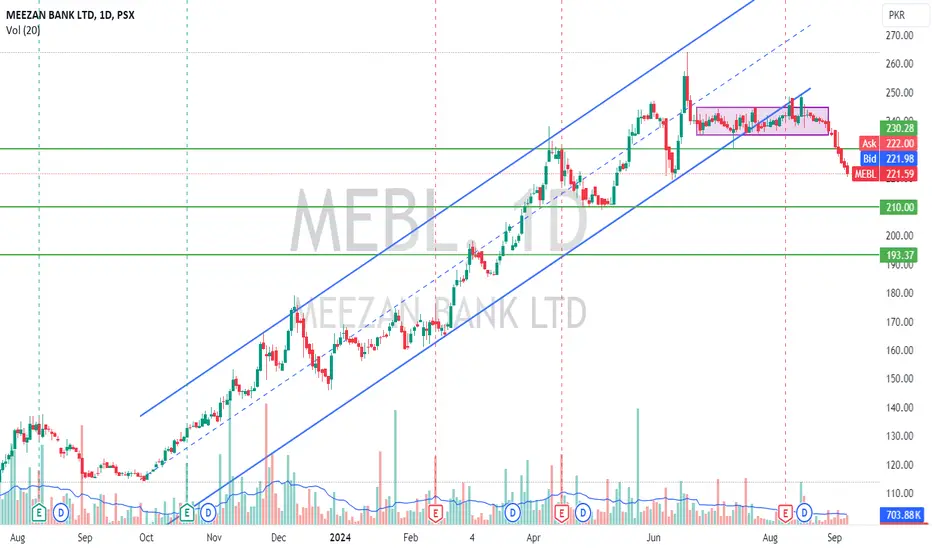
Meezan Bank Ltd (MEBL) is currently exhibiting a strong uptrend, having shown significant price appreciation over recent months. The stock is consolidating in the range of 230 PKR to 250 PKR, suggesting a potential setup for a breakout.
Trade Strategy:
1. Breakout Trade:
- Entry: 261 PKR
- TP1: 280 PKR (7.28%)
- TP2: 300 PKR (14.94%)
- SL: 250 PKR (4.21%)
- RR Ratio: 1.73 (TP1), 3.55 (TP2)
2. Reversal Trade:
- Entry: 210 PKR
- TP1: 230 PKR (9.52%)
- TP2: 250 PKR (19.05%)
- SL: 200 PKR (4.76%)
- RR Ratio: 2 (TP1), 4 (TP2)
Key Trade Confirmation Points:
- Volume: Look for increased volume on breakout above 261 PKR or on dip buying at 210 PKR.
- Candlestick Patterns: Bullish reversal patterns near support levels or strong bullish candles on breakout levels.
- Market Sentiment: Monitor overall market trends and any news specific to the banking sector or MEBL.
Fundamental Catalyst:
- Upcoming Earnings: MEBL is set to announce its earnings on 8th August 2024. Positive earnings results could act as a catalyst for a breakout, while any negative surprises may test support levels.
Confluences:
- Sector Performance: The banking sector’s relative strength supports a bullish outlook.
- Dividend Announcements: Positive dividend announcements can boost investor confidence and drive the stock higher.
- Technical Indicators: Confirming signals from RSI, MACD, or moving averages can enhance trading decisions.
In conclusion, MEBL presents a balanced opportunity for both breakout and reversal strategies, with strategic entry and exit points providing favorable risk-reward ratios. Monitoring key technical levels and upcoming earnings will be crucial for successful trades.

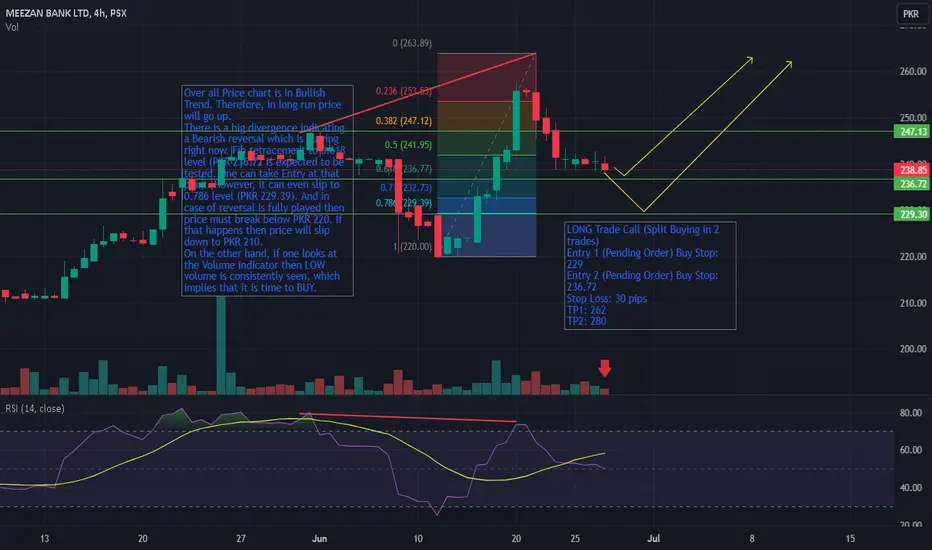
MEBL- 4h - LONG Trade CallOver all Price chart is in Bullish Trend. Therefore, in long run price will go up.
There is a big RSI divergence indicating a Bearish reversal which is playing right now.
Fib retracement to 0.618 level (PKR 236.72) is expected to be tested. One can take Entry at that point.
However, it can even slip to Fib 0.786 level (PKR 229.39).
Finally, in case The Reversal is fully played by the Divergence, then price must break below PKR 220. If that happens then price will slip down to PKR 200 or below as well.
On the other hand, if one looks at the Volume indicator then LOW volume is consistently seen, which implies that it is time to BUY.
PSX index is on a Bull run as well, which also means that full reversal is not likely to happen. It is just Institutional Buyers are taking profit at the moment.
My Trade values:-
LONG Trade Call (Split Buying in 2 trades)
Entry 1 (Pending Order) Buy Stop: 229.00
Entry 2 (Pending Order) Buy Stop: 236.72
Stop Loss: 30 pips
TP1: 262
TP2: 280
Note 1:- Once TP1 is reached then move Stop Loss of second trade to TP1 price to safeguard the profits.
Note 2: Before TP2 is reached, and if uptrend is still going on remove TP2, and then use Trailing Stop of 20 PIPS.
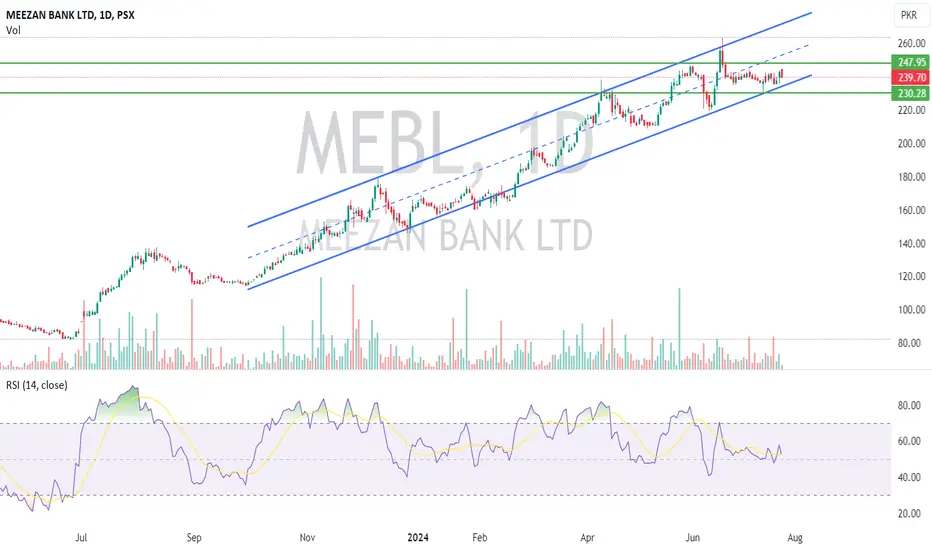
Bearish divergence in MEBLA bearish divergence is observed in MEBL in a daily timeframe. There is a possibility that the current uptrend might reverse into a downtrend. If the last HL is broken and a new LH is formed, then taking a short position will be a good point.


Week 9 strategy 1: AB=CD MEBLMEBL has been in a strong uptrend since June 22, 2023, when it was priced at Rs. 81.84. This bullish trend has continued, and as of February 2024, the stock has begun to form an AB=CD pattern, which is currently incomplete. Based on technical analysis, the completion of this pattern is projected around Rs. 273.
Trade Recommendation:
Action: Instant Buy
Stop Loss: Rs. 206
Target Price: Rs. 273
Rationale:
The ongoing uptrend and the formation of the AB=CD pattern suggest that the stock has significant upward momentum. The target price of Rs. 273 is based on the expected completion of the AB=CD pattern. However, traders should be aware that upon reaching this level, the stock may encounter a potential reversal zone.
Trading Strategy:
Enter the trade at the current price around Rs. 241.
Set a stop loss at Rs. 206 to manage downside risk.
Aim for the target price of Rs. 273, where the pattern completion is anticipated.

MEBL - Bullish Trade We will enter the trade at the breakout of HH.
At this point, buyers will remain in control.
No bearish divergence is observed.

MEBL - BULLISH FLAG MeBL is in CONTINUATIONAL trend, there is no divergence but due to the formation of bullish flag pattern a upside move is expected if it breaks the pole , long entry is recommendend then.

MEBL (Buying On Dip).MEBL (Buying On Dip). is recommended at the level of 213-216, and sells at 225 as tp 1 and 235 as tp 2. As 215 has been channel bottom with good support lying on it . place Sl below the recent support line.

Week 3 Line Charts Idea 3: MEBL RSI analysisThis analysis combines RSI (Relative Strength Index) analysis with Fibonacci retracement levels on the MEBL line chart to formulate a comprehensive trade plan.
Trade Plan:
Entry Price/Buy Limit: 209.02
Stop Loss: 194.40
Lot Size: 68
Take Profit Targets (TP):
TP1: 223.64 with Risk-Reward Ratio (RR) 1%
TP2: 238.26 with RR 2%
RSI indicates that there is no divergence, as it is parallel with the bullish trend. This supports the continuation of the trade plan based on Fibonacci retracement.

Week 3 Line Chart Idea 2: MEBL with Fib RetracementThis analysis employs Fibonacci retracement levels on the MEBL line chart to formulate a trading plan.
Trade Plan:
Entry Price/Buy Limit: 209.02
Stop Loss: 194.40
Lot Size: 68
Take Profit Targets (TP):
TP1: 223.64 with Risk-Reward Ratio (RR) 1%
TP2: 238.26 with RR 2%

Week 3 Trendlines Idea 1: MEBL Line Chart Analysis The chart depicts a bullish trend marked by consistent higher highs and higher lows, indicative of potential upward momentum.
Trade Plan:
Entry Price/Buy Limit: 205.86
Stop Loss: 194.40
Lot Size: 87
Take Profit Targets (TP):
TP1: 217.32 with Risk-Reward Ratio (RR) 1%
TP2: 228.78 with RR 2%

Week 2 Candle Stick Pattern Idea 3: MEBLOn July 7, 2023, the MEBL chart displayed an inverted hammer candlestick pattern, indicating potential bullish reversal. Here's a trade setup based on this pattern:
Entry Point: 99
Stop Loss: 86
Take Profit Targets:
TP1: 112 (Risk-Reward Ratio 1%)
TP2: 125 (Risk-Reward Ratio 2%)
TP3: 138 (Risk-Reward Ratio 3%)
TP4: 151 (Risk-Reward Ratio 4%)
The inverted hammer candlestick pattern is characterized by a small body and long upper shadow, suggesting a shift from bearish to bullish sentiment. Traders can consider entering a long position at the specified entry point with a stop loss set below the pattern's low to manage risk.
On April 3, 2024 , MEBL chart displayed a Bullish Hammer candlestick pattern. Here's a trade setup based on this pattern:
Entry Price: 213
Stop Loss: 195
Lot Size: 55.56 on Rs100,000 account
Take Profit Targets:
TP1: 231 (Risk-Reward Ratio 1%)
TP2: 249 (Risk-Reward Ratio 2%)

MEBL - BULLISHMEBL shows uptrend following HH'S and HL's, forming bullish candlestick patterns on Higher Lows.
