NETSOL – TECH SHORT SELL SET-UP | H | 15 JAN 2026 | By TCANETSOL – TECH SHORT SELL SET-UP | H | 15 JAN 2026 | By The Chart Alchemist
Note: Prices mentioned are of the regular market.
Please adjust accordingly for futures contracts.
• Short Sell Range: Rs. 127 – 129
Target Prices:
• TP1: Rs. 124
• TP2: Rs. 120
• TP3: Rs. 114
SL (H closing): Above Rs. 1
Netsol Technologies Limited
No trades
15.49 PKR
1.39 B PKR
9.91 B PKR
27.79 M
About Netsol Technologies Limited
Sector
Industry
CEO
Salim Ullah Ghauri
Website
Headquarters
Lahore
Founded
1995
IPO date
Jul 19, 2005
Identifiers
2
ISIN PK0084201018
Netsol Technologies Ltd. engages in the provision of automated and information technology enabled solutions. It operates through the following segments: Global Leasing and Financial Solutions (NFS), Information Security (IS) and Software Services and Solutions (SSS), and Business Process Outsourcing (BPO). The Global Leasing and Financial Solutions segment sells licenses of its NetSol Financial Suit, its customization and maintenance. The IS and SSS segment offers a full range of information security services and software solutions to help companies safeguard and confidentiality, veracity, and accessibility of information regarding its assets. The BPO segment provides information technology related outsourcing services mainly in the USA and European regions. The company was founded by Salim Ullah Ghauri in 1995 and is headquartered in Lahore, Pakistan.
Related stocks

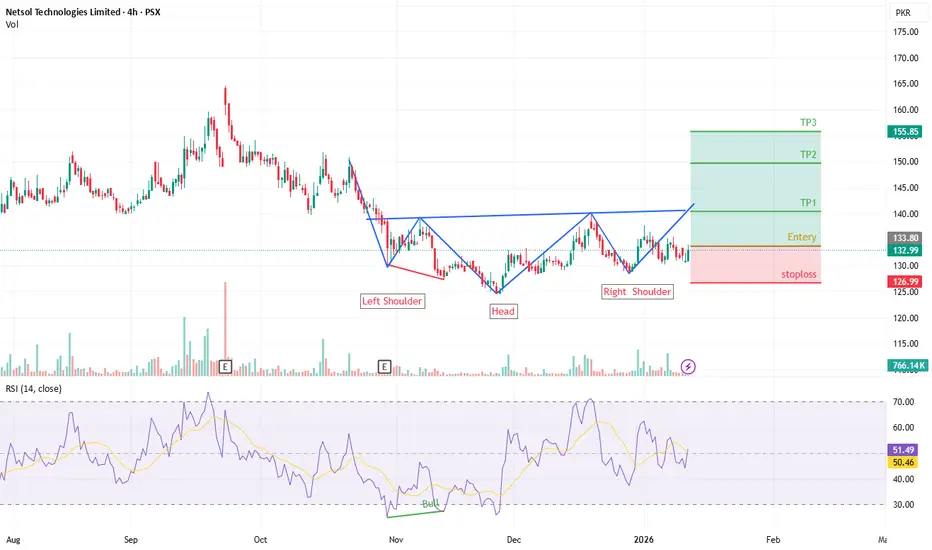
NETSOL – Inverse Head & Shoulders Breakout SetupNETSOL Technologies has formed a clear Inverse Head & Shoulders pattern on the 4H timeframe.
Price is approaching the neckline breakout zone, signaling a potential trend reversal and bullish continuation.
RSI is stabilizing above mid-levels, supporting upside momentum if the neckline is sustained.
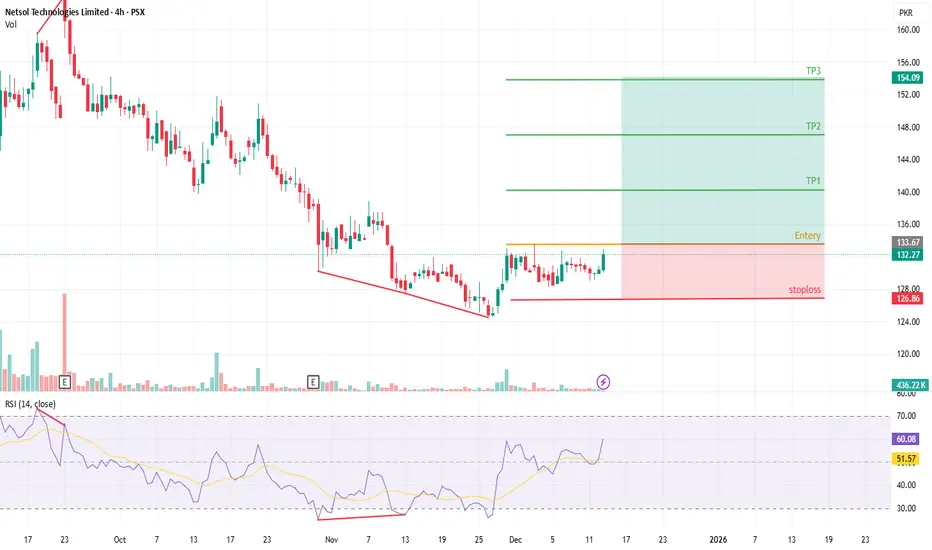
NETSOL – Bullish Reversal Setup! 1:3 Risk/Reward Play Awaits VolNetSol Technologies (NETSOL) is forming a bullish reversal pattern on 4H — and the reward potential is huge!
Entry zone: 133.67 - 135.67
TP1: 140.35
TP2: 146.93
TP3: 154.09 (+17% upside)
Risk/Reward = 1:3 — exceptional for swing trade
Key Condition: Wait for high volume on breakout or retest — no
NETSOL LongNetsol taking trendline resistance. Once broken (~165 level), next target will be 173 and then 190.... Abhi k liye itna bohat hai... long term targets doosray idea main bataye huay hain
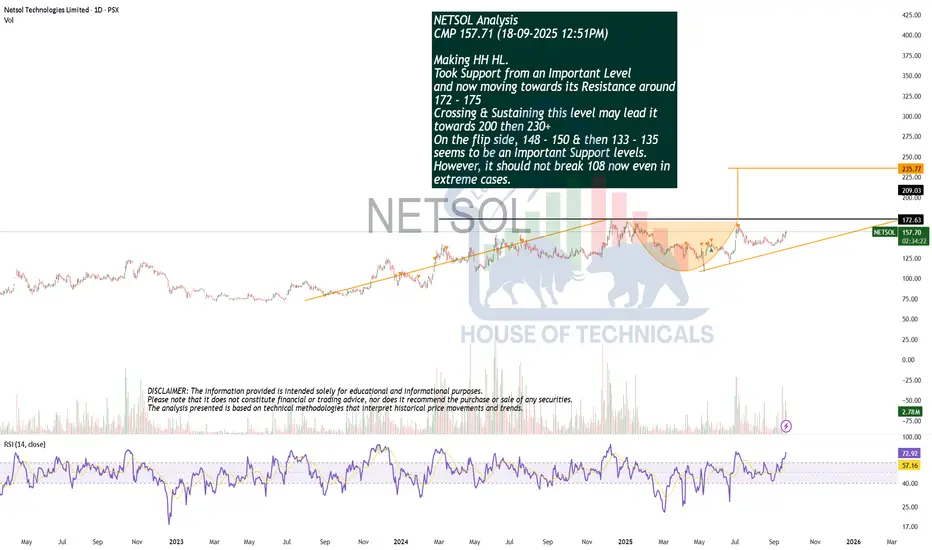
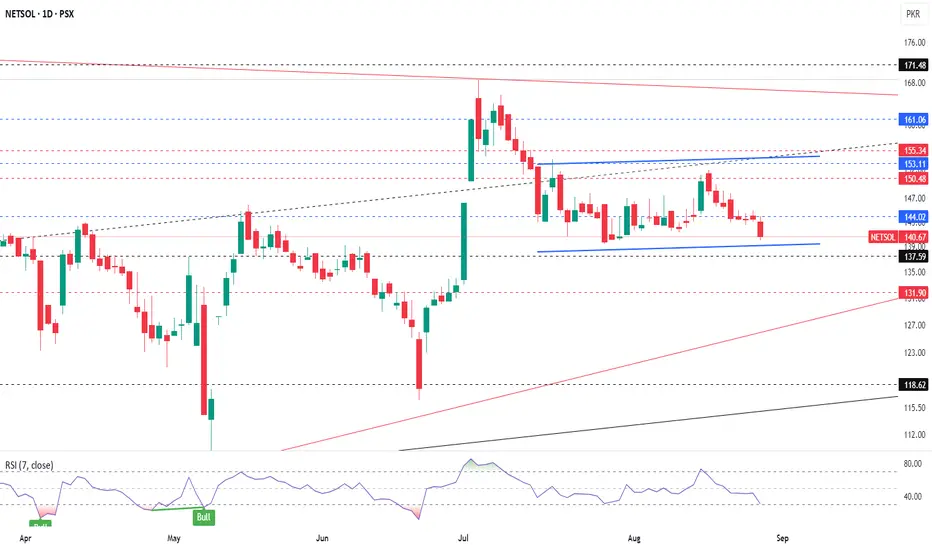
Making HH HL.NETSOL Analysis
CMP 157.71 (18-09-2025 12:51PM)
Making HH HL.
Took Support from an Important Level
and now moving towards its Resistance around
172 - 175
Crossing & Sustaining this level may lead it
towards 200 then 230+
On the flip side, 148 - 150 & then 133 - 135
seems to be an Important Support
NETSOL - NETSOL : buy when RSI > 50 and starts to move up after touching the lower edge of the Daily channel (blue)
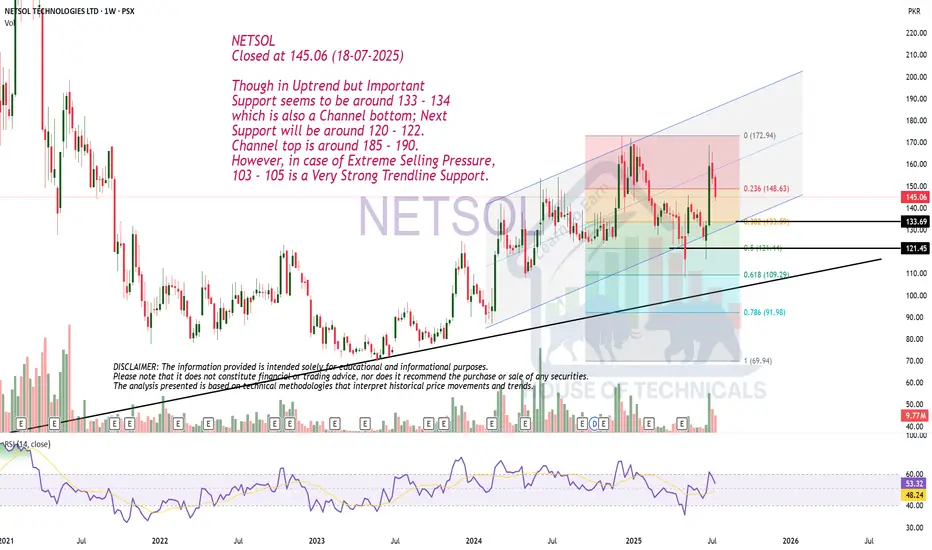
Though in Uptrend but..NETSOL
Closed at 145.06 (18-07-2025)
Though in Uptrend but Important
Support seems to be around 133 - 134
which is also a Channel bottom; Next
Support will be around 120 - 122.
Channel top is around 185 - 190.
However, in case of Extreme Selling Pressure,
103 - 105 is a Very Strong Trendline Suppor
NETSOL – LONG TRADE | 12 JULY 2025NETSOL – LONG TRADE | 12 JULY 2025
The stock is trading within a range marked by a blue channel. After touching the resistance area, the stock has created several bullish structures, indicating potential upside beyond the current range.

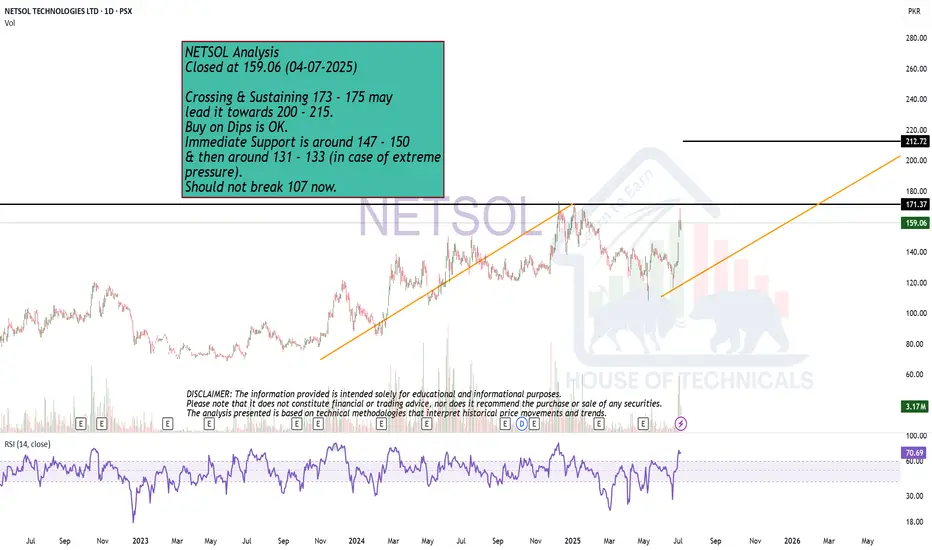
ABCD Pattern NETSOL Analysis
Closed at 159.06 (04-07-2025)
Crossing & Sustaining 173 - 175 may
lead it towards 200 - 215.
Buy on Dips is OK.
Immediate Support is around 147 - 150
& then around 131 - 133 (in case of extreme
pressure).
Should not break 107 now.
NETSOL | Swing Trade SetupTrading Note: NETSOL Technologies Ltd. (NETSOL) - Long Position Recommendation
Date: June 13, 2025
Subject: Potential Long Opportunity from Major Support Level
Overview:
This note recommends considering a long position on NETSOL from its significant major support level around 125. Recent price

See all ideas
Summarizing what the indicators are suggesting.
Oscillators
Neutral
SellBuy
Strong sellStrong buy
Strong sellSellNeutralBuyStrong buy
Oscillators
Neutral
SellBuy
Strong sellStrong buy
Strong sellSellNeutralBuyStrong buy
Summary
Neutral
SellBuy
Strong sellStrong buy
Strong sellSellNeutralBuyStrong buy
Summary
Neutral
SellBuy
Strong sellStrong buy
Strong sellSellNeutralBuyStrong buy
Summary
Neutral
SellBuy
Strong sellStrong buy
Strong sellSellNeutralBuyStrong buy
Moving Averages
Neutral
SellBuy
Strong sellStrong buy
Strong sellSellNeutralBuyStrong buy
Moving Averages
Neutral
SellBuy
Strong sellStrong buy
Strong sellSellNeutralBuyStrong buy
Displays a symbol's price movements over previous years to identify recurring trends.
Frequently Asked Questions
The current price of NETSOL is 124.02 PKR — it has decreased by −1.16% in the past 24 hours. Watch Netsol Technologies Limited stock price performance more closely on the chart.
Depending on the exchange, the stock ticker may vary. For instance, on PSX exchange Netsol Technologies Limited stocks are traded under the ticker NETSOL.
NETSOL stock has risen by 0.02% compared to the previous week, the month change is a −5.58% fall, over the last year Netsol Technologies Limited has showed a −19.62% decrease.
NETSOL reached its all-time high on Feb 23, 2021 with the price of 304.75 PKR, and its all-time low was 15.09 PKR and was reached on Jan 16, 2013. View more price dynamics on NETSOL chart.
See other stocks reaching their highest and lowest prices.
See other stocks reaching their highest and lowest prices.
NETSOL stock is 2.24% volatile and has beta coefficient of 1.35. Track Netsol Technologies Limited stock price on the chart and check out the list of the most volatile stocks — is Netsol Technologies Limited there?
Today Netsol Technologies Limited has the market capitalization of 10.59 B, it has decreased by −1.92% over the last week.
Yes, you can track Netsol Technologies Limited financials in yearly and quarterly reports right on TradingView.
NETSOL net income for the last quarter is 74.73 M PKR, while the quarter before that showed 1.11 B PKR of net income which accounts for −93.25% change. Track more Netsol Technologies Limited financial stats to get the full picture.
Yes, NETSOL dividends are paid annually. The last dividend per share was 3.00 PKR. As of today, Dividend Yield (TTM)% is 2.42%. Tracking Netsol Technologies Limited dividends might help you take more informed decisions.
Netsol Technologies Limited dividend yield was 0.00% in 2025, and payout ratio reached 0.00%. The year before the numbers were 2.21% and 21.90% correspondingly. See high-dividend stocks and find more opportunities for your portfolio.
As of Feb 7, 2026, the company has 1.22 K employees. See our rating of the largest employees — is Netsol Technologies Limited on this list?
EBITDA measures a company's operating performance, its growth signifies an improvement in the efficiency of a company. Netsol Technologies Limited EBITDA is 1.99 B PKR, and current EBITDA margin is 11.49%. See more stats in Netsol Technologies Limited financial statements.
Like other stocks, NETSOL shares are traded on stock exchanges, e.g. Nasdaq, Nyse, Euronext, and the easiest way to buy them is through an online stock broker. To do this, you need to open an account and follow a broker's procedures, then start trading. You can trade Netsol Technologies Limited stock right from TradingView charts — choose your broker and connect to your account.
Investing in stocks requires a comprehensive research: you should carefully study all the available data, e.g. company's financials, related news, and its technical analysis. So Netsol Technologies Limited technincal analysis shows the strong sell today, and its 1 week rating is sell. Since market conditions are prone to changes, it's worth looking a bit further into the future — according to the 1 month rating Netsol Technologies Limited stock shows the neutral signal. See more of Netsol Technologies Limited technicals for a more comprehensive analysis.
If you're still not sure, try looking for inspiration in our curated watchlists.
If you're still not sure, try looking for inspiration in our curated watchlists.