Monthly Support...?OCTOPUS
Closed at 51.64 (09-10-2025)
This seems to be a Strong Support
but it needs to give monthly closing above this
black trend line (51).
But breaking this would trigger more negativity.
Upside important resistance is around 53 - 55.
Trade ideas

Octopus⚖️ Risk-to-Reward (RRR)
Entry 55.5 → Stop 54.5 → Risk ≈ 1.0
Target 61.0 → Reward ≈ 5.5
RRR = 1:5.5 (very favorable)
Bias: Bullish continuation (as long as above 55).
Strategy: Buy the dip on support → Ride breakout targets.
Caution: If closes below 54.5 with volume, exit immediately (bearish fake-out risk).

Octopus* ✅ **Trend:** Broke out of long-term downtrend, now moving in an **ascending channel**.
* ✅ **Wave Count:** Elliott Wave structure targeting **Wave 5** uptrend.
* ✅ **Supports:** 57–58 (immediate), 52–53 (critical).
* ✅ **Resistances / Targets:** 64–65 (first target), 73–75 (major Wave 5 target).
* ✅ **Volume:** Strong breakout volume confirms buying strength.
* ✅ **Trading Plan:**
* Entry: 57–58 (current) or 52–54 (on dip).
* Stop-loss: Below 50.
* Targets: 64 → 73–75.
* Risk-Reward: \~2:1 to 2.5:1.
📈 **Bias:** Bullish as long as price holds above 52–53.

OCTOPUS Share Buying StrategyOCTOPUS Share Buying Strategy
Key Buying Zone:
📍 Buy between PKR 57 – 54
Note: if Monday open above 57 then buy don't wait for dip
Stop Loss:
🚫 Place stop loss at PKR 52
Targets:
🎯 Target 1: PKR 60
🎯 Target 2: PKR 64
Extended Strategy:
🔒 If price sustains above PKR 64, hold the position and apply a trailing stop loss to protect profits.

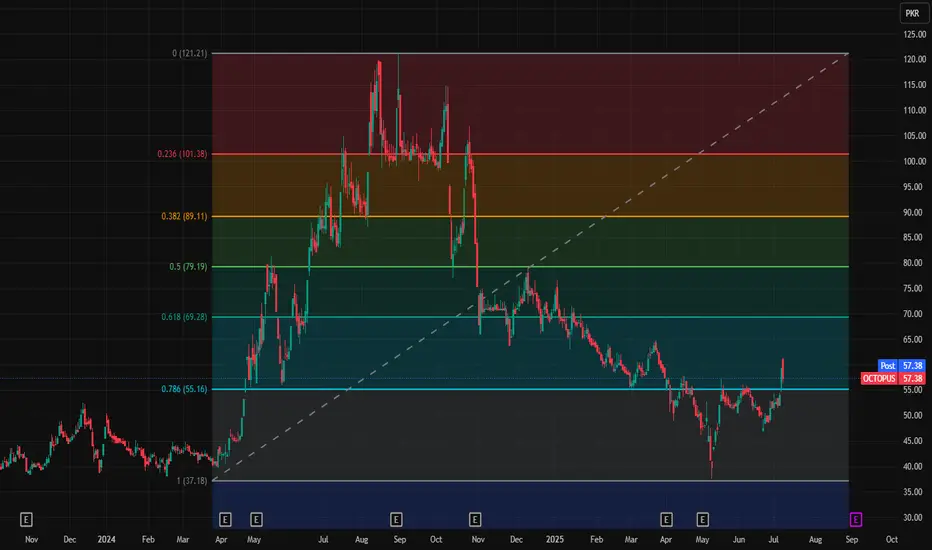
Fresh entry for OctopusOctoous is near to its support of 55.16 and if it fall below it and again cross above it then fresh entry is possible with SL of 37.18 and TPs are 69.28 and 79.19.
Note: This is not a buy/sell trade call.
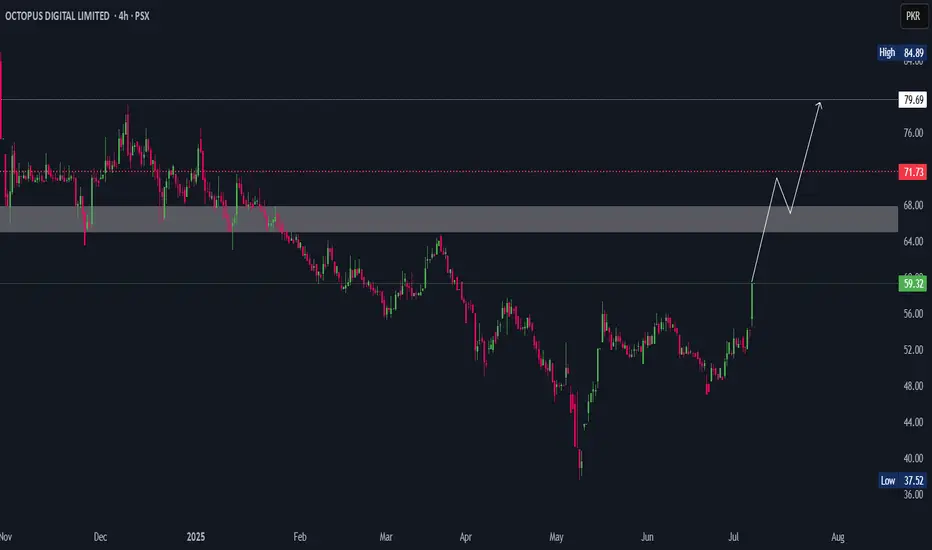
OCTOPUSOctopus has broken out of its long term bearish cycle and is now ready to retest 65 and maybe 80. lets see if today's momentum continues.
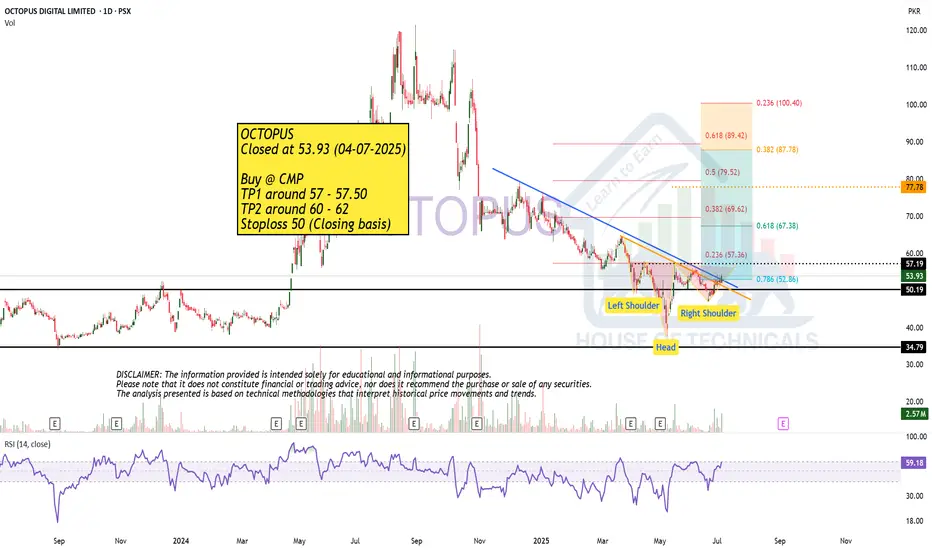
Buy CallOCTOPUS
Closed at 53.93 (04-07-2025)
Buy @ CMP
TP1 around 57 - 57.50
TP2 around 60 - 62
Stoploss 50 (Closing basis)

OCTOPUS - PSX - Technical AnalysisOn daily TF, OCTOPUS is in a sideways channel since Nov 2024. Although it has broken out of downwards parallel channel but has actually not gotten into bull run.
Therefore, one can initiate trade in sideways channel as well as once it breaks out of the sideways channel.
KVO is in sideways and just below zero level, but Klinger line is above the trigger line. Which may move up. Similarly, RSI is also around 50, therefore, there is enough space to move up.
Trade Values
Buy-1: 68.10
TP-1: 77.34
Buy-2: 80.52
TP-2: 100
SL: 62.07

Octopus is attractive to Buy at these levels Offering 117% GainsThe stock after breaking out its accumulation zone enters the bullish territory and printed a Cup and Handle formation on weekly chart. The stock has successfully broke out the Cup and Handle but went into consolidation after posting bearish divergence. Currently, retraced till 71.8% as per FIB levels and being accumulated for another bullish ride where it can double the investment within next 6 months.
One can start accumulate atleast 25% allocation at these levels with SL at 55. Confirmation to the Target price will be given once weekly closing above 100 is given by the stock where it will validate the journey towards final target price of 165 which is the projection of Cup and Handle formation.

OCTOPUSOCTOPUS faced some strong selling pressure from august.
Currently the price is showing some good buying momentum from daily support level.
And price is broke to upside on macro structure.
If the 73 level holds, the upside rally could be extend to 100 level.

It is Bearish on all Time Frames.It is Bearish on all Time Frames.
But Currently it is at 38.20 % fib level; we need
to wait for a Bullish Signal (at least on hourly basis)
for fresh entry here.
If this Support is broken, we may witness 63 &
then 55 - 56 as it would also be a Double Bottom
area.

Octopus - Buy - High risk SetupOctopus is hitting lower locks since last 3 days and now at strong support zone at OB zone. Buy with strict loss at 61.94 and TP at previous support turned resistance 77.6 RR ratio 1:1.5

OCTOPUS | Bearish Divergence**OCTOPUS** - Sell Recommendation
Technical Analysis: The current price action is displaying a bearish divergence pattern, suggesting an imminent sell-off or profit-taking phase. The Relative Strength Index (RSI) has reached overbought territory and is currently signaling a potential downside movement. Additionally, the Moving Average Convergence Divergence (MACD) has indicated a crossover, further indicating exhaustion among buyers and the potential for bearish momentum to emerge.

OCTOPUS ANALYSIS 1.0
🚀 Trade Alert: OCTOPUS Bullish Flag Pattern 🚀
We have identified a bullish setup in OCTOPUS, highlighted by the following pattern:
Bullish Flag Pattern 🚩
Technical Indicators:
Previous High: Broken, confirming bullish momentum
Bearish Divergence: Previously present but neutralized after a significant drop
Current Divergence: Formed after the flag formation, indicating the continuation of the bullish trend
Entry Point:
Buy: At 88.55
Target Prices (TP):
TP 1: 96.00 📈
TP 2: 104.00 🥇
Stop Loss (SL):
SL: 81.00 to manage risk
Trade Summary:
Buy: At 88.55
TP 1: 96.00
TP 2: 104.00
SL: 81.00
Trade Type: Long Swing 🎢
Good Luck! 🍀
Stay informed and trade smart! 📊

OCTOPUS is BullishBears seem to be exhausted as the price broke previous lower high and printed a higher high. A bullish rally is expected to be triggered from here. Targets are mentioned on the chart.

