PACE – SHORT / EXIT SET-UP | 2H | 10 FEB 2026 | By TCAPACE – SHORT / EXIT SET-UP | 2H | 10 FEB 2026 | By The Chart Alchemist
• Short-Sell 1: Rs. 15.40 (current price)
• Short-Sell 2: Rs. 16.77
• Short-Sell 3: Rs. 17.85
Target Prices:
• TP1: Rs. 13.80
• TP2: Rs. 11.65
• TP3: Rs. 9.00
SL (2H closing): Above Rs. 19.00 | R:R: 1:3.6
(Prices are for regu
Pace Pakistan Ltd.
No trades
−1.52 PKR
−317.77 M PKR
1.60 B PKR
193.09 M
About Pace Pakistan Ltd.
Sector
Industry
CEO
Aamna Taseer
Website
Headquarters
Lahore
Founded
1992
IPO date
Feb 26, 2007
Identifiers
2
ISIN PK0088601015
Pace Pakistan Ltd. engages in the development of real estate properties. It focuses on commercial, residential, and multi-use projects. The company was founded in 1992 and is headquartered in Lahore, Pakistan.
Related stocks

Pace Key levelsThese are key levels
9.61
10.24
10.89
11.56
12.25
12.96
13.69
14.44
15.21
16.00
16.81
17.64
18.49
19.36
20.25
21.16
22.09
23.04
24.01


Pace is showing strong bullish intent#PACE 🚀 is showing strong bullish intent — the bullish marubozu after a healthy pullback signals buyers are back in control. As long as price holds above 21.8–22, momentum favors continuation toward 25–28 and more higher.
Not the full moon yet, but on a half, launch pad is active 👀🚀

Pace levelsThese are important levels for Pace
Entry possible at above 20.25
TP 1 is 21.2
TP 2 is 22.6
SL 19.05
Note this is not a buy or sell trade call, it is an analysis.

PACE – TECHNICAL BUY CALL | 11 SEPT 2025 PACE – TECHNICAL BUY CALL | 11 SEPT 2025
The stock broke out of a trading range and is now poised to move upwards after a pullback. This setup indicates potential for upside movement, with defined risk management via stop loss and supported by volumetric distribution.

PACE LONG TRADE 16-06-2025PACE LONG TRADE
Rationale
PACE recently completed an ABC correction within a bearish channel, which acted as a bull flag. The stock broke out of this channel with significantly high volumes (5x) and strong follow-through, indicating potential upside.
🚨 TECHNICAL BUY CALL – PACE🚨
- Buy 1: Current le

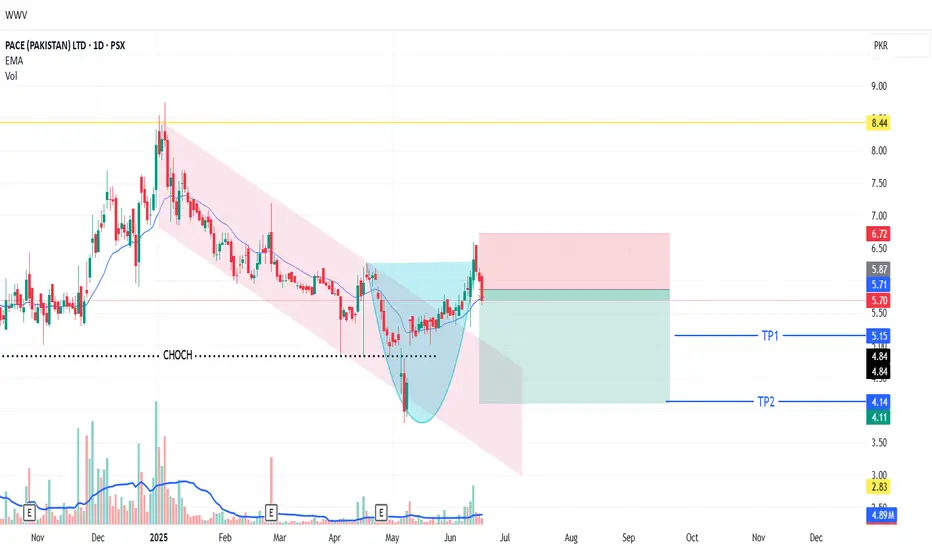
PACE SHORT SELL TRADE 19-03-2025 (FLIP TRADE SET-UP)PACE Flip Trading Setup (Short Sale):
After breaking out from a downward channel, PACE created an upthrust and retraced back, indicating potential for a downward move. We're flipping our position to capitalize on this reversal.
*Short Sale Levels:*
- *Short Sale 1:* PKR 5.7 (current level)
- *Shor
PACE SHORTSELL TRADEPACE been in DOWNTREND since JAN 2025.
Recent up leg has been mostly due to across the board Bullish Sentiments because of improvement in Geo Political Environment.
Current Up Move is also just a healthy Pullback in overall Downtrend.
There's strong Bearish Breaker Block overhead current levels whic

Pace is in ideal buying zonePace is near to 4.88 a strong support level. it is ideal zone for buy it. Currently at 5.02 level and it could reach its strong resistance level of 5.62 and 6.36 level.
Note: This is not a buy/sell trade call. trade at your own will and analysis.

See all ideas
Summarizing what the indicators are suggesting.
Oscillators
Neutral
SellBuy
Strong sellStrong buy
Strong sellSellNeutralBuyStrong buy
Oscillators
Neutral
SellBuy
Strong sellStrong buy
Strong sellSellNeutralBuyStrong buy
Summary
Neutral
SellBuy
Strong sellStrong buy
Strong sellSellNeutralBuyStrong buy
Summary
Neutral
SellBuy
Strong sellStrong buy
Strong sellSellNeutralBuyStrong buy
Summary
Neutral
SellBuy
Strong sellStrong buy
Strong sellSellNeutralBuyStrong buy
Moving Averages
Neutral
SellBuy
Strong sellStrong buy
Strong sellSellNeutralBuyStrong buy
Moving Averages
Neutral
SellBuy
Strong sellStrong buy
Strong sellSellNeutralBuyStrong buy
Displays a symbol's price movements over previous years to identify recurring trends.
Frequently Asked Questions
The current price of PACE is 15.14 PKR — it has decreased by −1.61% in the past 24 hours. Watch Pace Pakistan Ltd. stock price performance more closely on the chart.
Depending on the exchange, the stock ticker may vary. For instance, on PSX exchange Pace Pakistan Ltd. stocks are traded under the ticker PACE.
PACE stock has fallen by −7.33% compared to the previous week, the month change is a −23.55% fall, over the last year Pace Pakistan Ltd. has showed a 141.08% increase.
PACE reached its all-time high on Nov 7, 2025 with the price of 31.00 PKR, and its all-time low was 0.75 PKR and was reached on Sep 27, 2019. View more price dynamics on PACE chart.
See other stocks reaching their highest and lowest prices.
See other stocks reaching their highest and lowest prices.
PACE stock is 3.68% volatile and has beta coefficient of 0.84. Track Pace Pakistan Ltd. stock price on the chart and check out the list of the most volatile stocks — is Pace Pakistan Ltd. there?
Today Pace Pakistan Ltd. has the market capitalization of 4.33 B, it has increased by 2.97% over the last week.
Yes, you can track Pace Pakistan Ltd. financials in yearly and quarterly reports right on TradingView.
PACE net income for the last quarter is 323.45 M PKR, while the quarter before that showed −529.94 M PKR of net income which accounts for 161.04% change. Track more Pace Pakistan Ltd. financial stats to get the full picture.
No, PACE doesn't pay any dividends to its shareholders. But don't worry, we've prepared a list of high-dividend stocks for you.
Like other stocks, PACE shares are traded on stock exchanges, e.g. Nasdaq, Nyse, Euronext, and the easiest way to buy them is through an online stock broker. To do this, you need to open an account and follow a broker's procedures, then start trading. You can trade Pace Pakistan Ltd. stock right from TradingView charts — choose your broker and connect to your account.
Investing in stocks requires a comprehensive research: you should carefully study all the available data, e.g. company's financials, related news, and its technical analysis. So Pace Pakistan Ltd. technincal analysis shows the sell today, and its 1 week rating is neutral. Since market conditions are prone to changes, it's worth looking a bit further into the future — according to the 1 month rating Pace Pakistan Ltd. stock shows the buy signal. See more of Pace Pakistan Ltd. technicals for a more comprehensive analysis.
If you're still not sure, try looking for inspiration in our curated watchlists.
If you're still not sure, try looking for inspiration in our curated watchlists.