PAEL is in rising channelPAEL is in a rising channel, undervalued.
It can easily hit the mentioned target.
PAEL trade ideas

PAEL Long positionReasons for long position
Monthly EMA 200 breakout
First time Lower High broken on weekly chart
Profitability continuously improving from the last 5 quarters
These are initial targets, not the final ones.
TP1: 44
TP2: 56
SL1: 36
SL2: 29

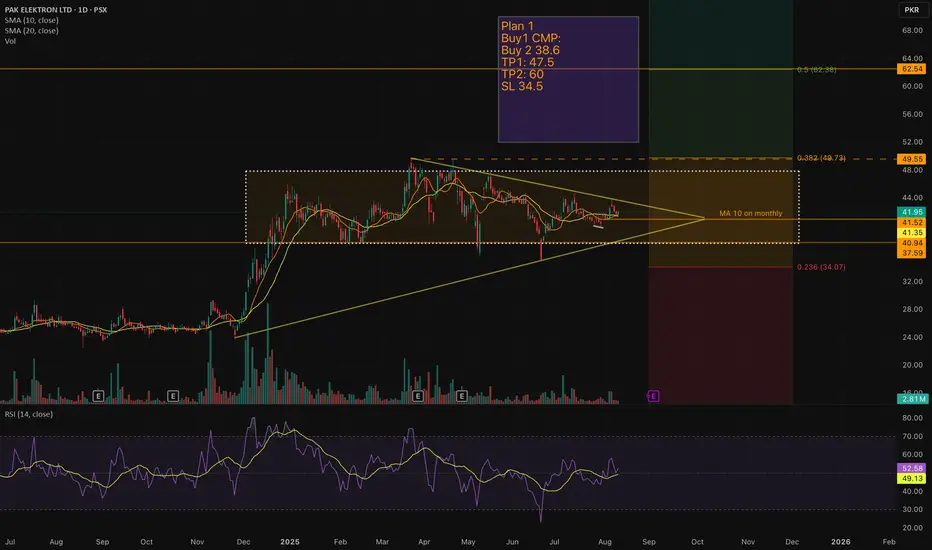
PAEL – Symmetrical Triangle Breakout Loading?PAK Elektron Ltd (PSX: PAEL) has been consolidating for months inside a symmetrical triangle, with price hugging the 10 & 20 SMA zone. The breakout could be just around the corner.
📊 Technical Outlook:
Pattern: Symmetrical triangle within a larger consolidation box.
Current CMP: 41.95
MA10 on monthly: Acting as dynamic resistance.
Volume: Noticeable spikes during upswings, showing accumulation.
RSI: Neutral zone at 52 – plenty of room for momentum in either direction.
📝 Trading Plan:
Buy 1: CMP (41.95)
Buy 2: 38.6 (on dip if retest happens)
TP1: 47.5 (near 0.382 Fib level)
TP2: 60 (major Fib retracement level 0.5)
SL: 34.5
⚡ Why Interesting?
Price has been coiling, reducing volatility – a breakout can trigger strong moves.
Weekly & Monthly structure shows alignment for a potential uptrend continuation.
Above 49.5, momentum could accelerate toward 62+.
🔍 Watch Levels:
42.50 breakout confirmation zone
38.50 retest support
49.5 major resistance
Disclaimer: This is not financial advice – just my personal trade setup based on technical analysis. Always do your own research before entering any trade.
PAK ElECTRON LONG (PAEL)Technical:
Bullish breakout
Enter 43-42 PKR
Targets @ 46.80 & 49.25
Sentiment :
Positive Exports/Earnings Upgrades
Fundamentals :
Strong Growth/Attractive Valuations/ Manageable Debt

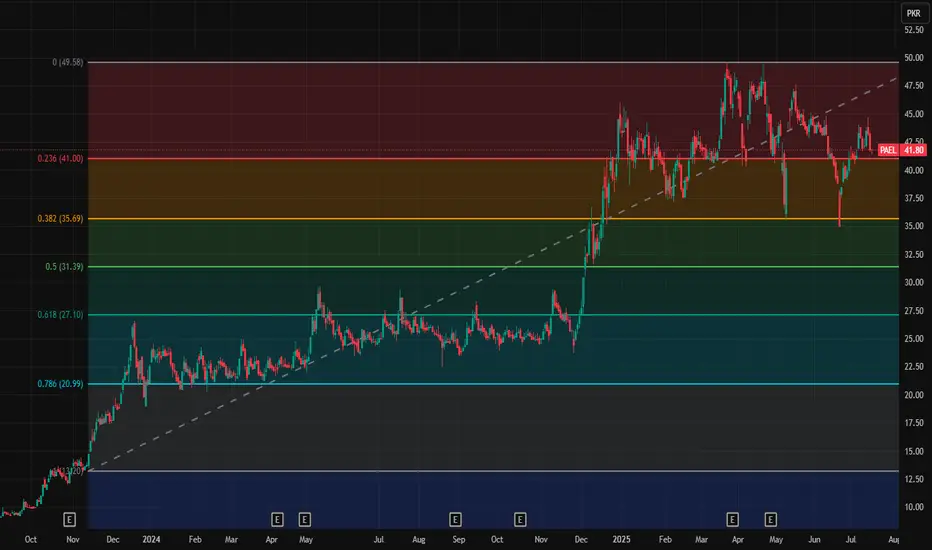
Pael Key LevelsThese are Pael key levels
31.39
35.69
41
49.58
Note: This is not a buy/sell trade call. It is an analysis.
Fresh entry is possible in PAELPael is still in bullish zone and fresh entry is possible on current price 43 and SL should be at red line, TP is green lines.
Note: This is not a buy/sell trade call.
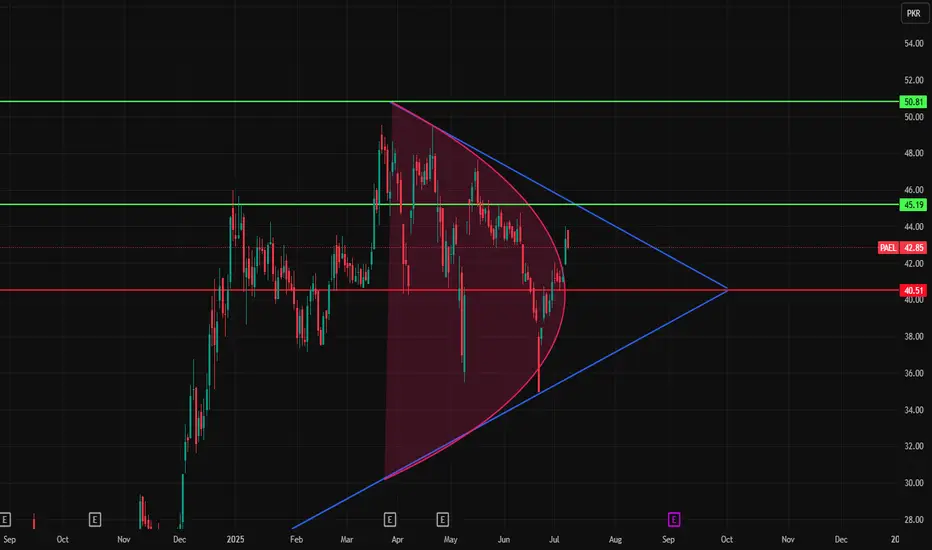
Bullish on Bigger tf but ..PAEL
Closed at 40.96 (03-07-2025)
Bullish on Bigger tf but seems sideways
at the moment.
Also, Channel Bottom is around
38 - 40
49 - 50 is a very important resistance,
& Crossing this level with Huge volumes may
lead it towards 60.


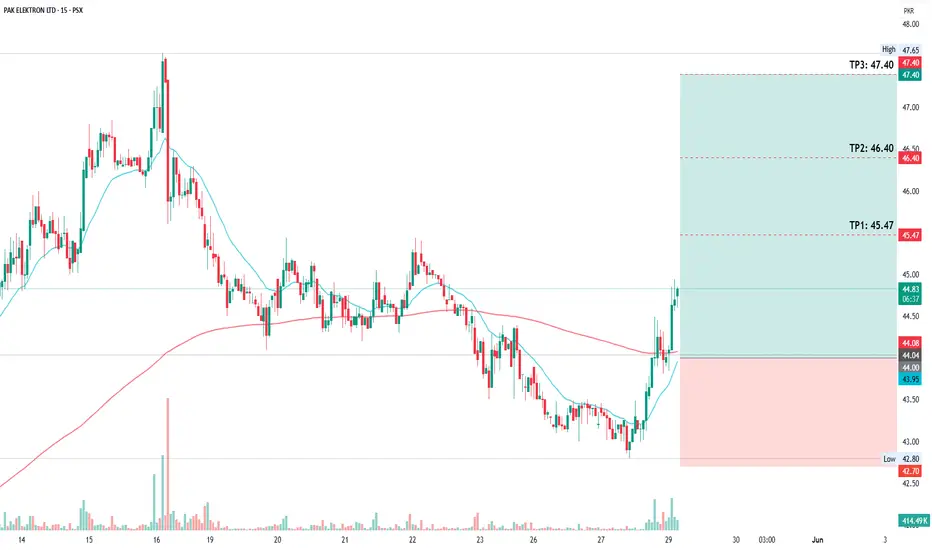
Bullish Breakout in PAEL: Buy on Dip for Short-Term GainsPAEL on the 15-minute timeframe shows a bullish setup with a recent breakout above the 20 EMA and 200 EMA, supported by a noticeable increase in volume—indicating strong buying interest. The current price is around PKR 44.70, and a "buy on dip" strategy is recommended within the 44.00–44.20 range. This setup offers a favorable risk-to-reward ratio, with a stop-loss placed at PkR42.70 and three take-profit targets at PkR 45.47, 46.40, and 47.40. The price has rebounded strongly from the recent low of 42.80, forming a potential trend reversal. Traders should monitor the 44.00 support zone closely, as a sustained hold above it could confirm the continuation toward higher targets.
Wait for the Resistance to Cross!hidden Bullish divergence.
but there is a bearish div. so wait for the resistance to break first.

PAEL SETUP ONCE AGAINPAEL is currently at its orderblock zone where the liquidity is resting if volumes come in at this level then we can expect a bounce again if the orderblock fails and there is no liquidity in OB then wait for downside levels and if the weekly ema 21 is broken then i see 30 level coming but still we will look into some more levels for now just focus on this orderblock
the previous supply is completed here

HH HL on bigger Tf but now..HH HL on bigger Tf but now
Bearish Divergence appearing also.
50 is the Resistance for now.
Those who are already holding it should
keep their stoploss at 40 (in extreme case).


#Pael is above green sky (strong bullish zone)Hcar is now above green sky (Strong bullish zone). It is expected to cross 50 and 60 level.
Note: This is not a buy or sell call, trade at your own will. Use stop loss as per your strategy.

Weekly Closing not Good but..Weekly Closing not Good but
the Stock is Still Bullish on Bigger
Time Frames.
Price dropped with Low Volumes.
Weekly Important Support seems to
be around 42.50 - 44.10
49-50 is an Important Resistance as
of now.

PAEL | Flag PatternThe stock displays a bullish flag pattern on strong volume, trading confidently above both the 20 and 200-day EMAs, suggesting robust upward momentum. Previous session shows a break out of the flag and price closed +3% above it. Initial resistance lies around 46 which is the formation of double top pattern from where short term rejection can be seen. However, a decisive break above the resistance level will confirm the continuation of the bullish trend and flag projection lies around 55.

Still BullishRetested the Previous Breakout Level
around 37 - 38.
Immediate Support is around 46 - 46.50 now.
Monthly Closing above 48.20 would be
very healthy sign; targeting around 55.
& then around 60.

PAEL - THE BEST SETUPPAEL has always been my favorite stock as it plays very well on price action and technical.
Right now the trending accumulation has ended and its time for a move.
if we take the simple and basic previous demand copy. It gives the target of 60 which everyone is expecting. but there might be some trick played to take out the retails. so be careful around 55 and 59 level you might see the trend slowdown in short term due to divergence on RSI.
right now if you want to accumulate more wait for the intraday retest levels around 46 to 44.
I HAVE ALREADY ENTERED THIS SETUP AROUND 43.
THE TAKE PROFIT IS 55 AND THEN 58 TO 59 ACCORDINGLY.

BULLISH FLAG PATTERN FOR THE PAEL LOVERS The script of PAEL looks in a good shape and forming bullish flag pattern. The price has triggered the breakout and now it seems it will touch the Rs. 60 mark soon.
The share is also fundamentally very strong and in the favorable time of the year to ride the trend.

Earnings, Trendlines, & Cyclic Momentum: PAEL at a Turning PointPre :
PAEL has shown strong financial growth, with Q1 2024 net profit surging 1,090% YoY to PKR 444.9 million, driven by eased import restrictions and market stability. For the nine months ending September 2024, profit after tax rose 97% YoY to PKR 1.863 billion, supported by a 35% revenue increase due to higher sales volumes and price adjustments.
Post :
the stock is trading in rising wedge pattern with support levels at PKR 43.58 and 40.50 and RSI indicates near overbought levels, potential short-term volatility. Main future outlook depends on government upcoming energy policies, increasing home solar systems market demand will intact,
Key on eyes upon 46-levels breaks above levels rally towards 54-58 PKR, aligning with the projected 15-20% gain.

Bullish on All Time Frames.Bullish on All Time Frames.
Breakout above 46.50.
Already re-tested the Previous Breakout
around 38.
Immediate Support is around 42.50 - 44
Immediate Targets can be around 49 - 50
However, It has the potential to touch 59 - 60.
It should not Break 40 now.

PAEL formed bullish flag patternpael has submitted breakout on daily time frame formed bullish flag pattern which indicates bullish momentum, buying is recommended at current levels.

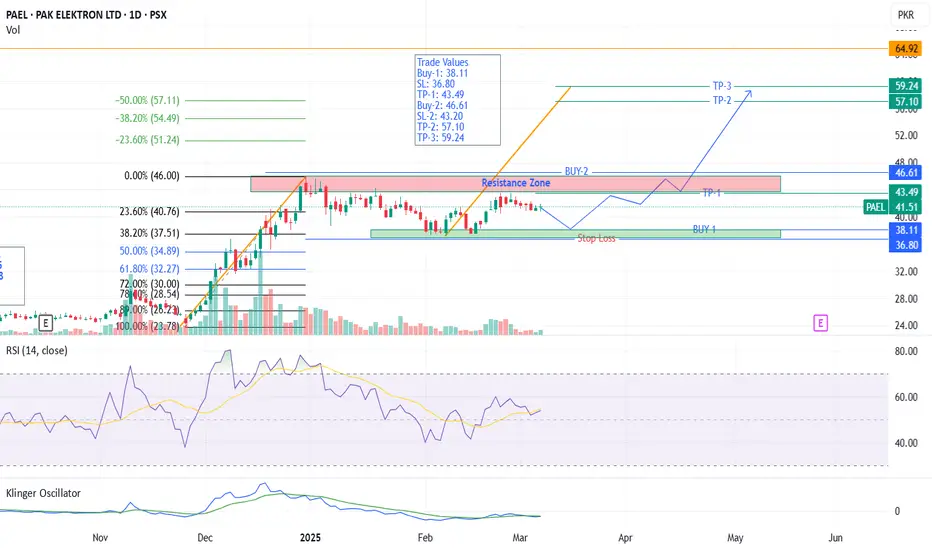
PAEL - PSX - Daily - Technical AnalysisPAEL is in sideways zone. It has established a support zone at Fib 38.20% by bouncing twice from there. Another dip is quite possible. Resistance zone is quite large and it is expected that it may take a month to break across it.
Therefore, Buy on dip will be the way to go.
Trade Values
Buy-1: 38.11
SL: 36.80
TP-1: 43.49
Buy-2: 46.61
SL-2: 43.20
TP-2: 57.10
TP-3: 59.24