PIBTL, 1D (Hidden Bullish Divergence)PIBTL, 1D Chart showing hidden bullish divergence which means the trend will continue for next HH.
TP1: 15.6
TP2: 17
SL: Closing below 13.4
Arsalan Anwer
Stags
Trade ideas

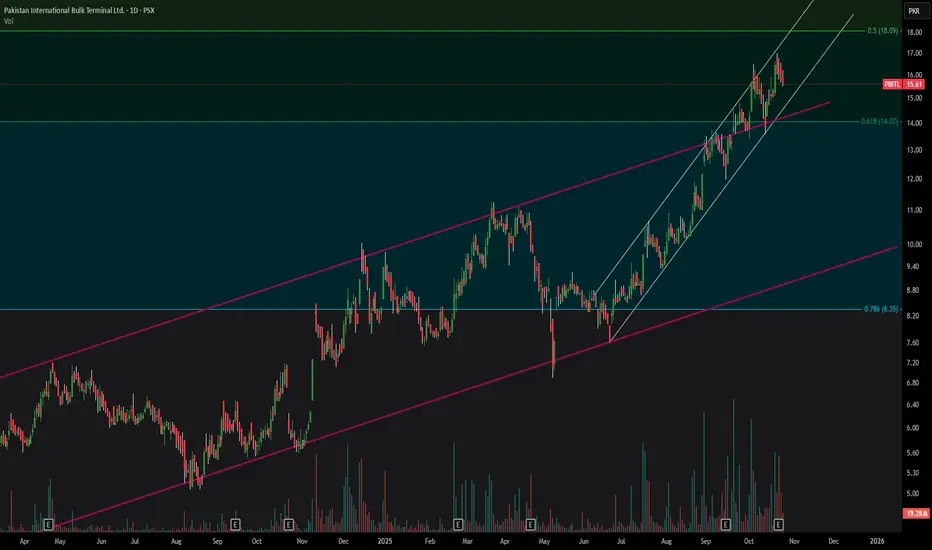
Pakistan International Bulk Terminal Ltd. (Daily chart):Current Situation: 📊
Price: 15.61 PKR, down 1.20% 📉
Volume: 19.28M (massive - something's happening!) 🌊
DANGER ZONE! Stock rejecting hard from channel top! ⚠️🚨
The Big Picture: 🎯
PIBTL had an incredible 300%+ rally from 3.80 to 18.00 over 2+ years! Clean ascending channel throughout. But now showing classic topping behavior - touched upper channel boundary (green line) and getting rejected. Similar warning signs as Meezan Bank! 😰
Key Technical Levels: 🎯
Support Zones:
Immediate: 15.20-15.60 (current battle zone) ⚔️
Strong: 14.50-15.00 (recent consolidation) 💪
Critical: 14.00-14.50 (0.618 Fib + minor support) 🛡️
Major: 12.50-13.00 (channel midpoint) 🏰
Deep: 11.00-11.50 (previous resistance turned support) ⚓
Ultimate: 8.00-8.50 (0.786 Fib + lower channel) 💀
Resistance Zones:
Immediate: 16.00-16.50 (broken support now resistance) 🔴
Strong: 17.00-17.50 (recent consolidation top) 🏔️
Major: 17.80-18.10 (all-time high + 0.5 Fib extension) 🚫
Extension: 18.50+ (0.5 Fib - unlikely now) 📊
Chart Pattern: 📐
Multi-year ascending channel (pink/red lines) 📈
Recently touched upper channel boundary and rejected! 💥
Formed a mini rising wedge within the larger channel ⚠️
Potential double top forming at 17.80-18.00 zone 🎩🎩
Broke below the accelerated green trendline - first warning! 🚨
Fibonacci Analysis: 📏
0.5 (18.09) - Just touched and rejected! 🔴
0.618 (14.07) - Key support ahead
0.786 (8.35) - Lower channel boundary
Multiple Fib confluence zones creating strong levels ✅
Volume Behavior: 📊
HUGE volume today (19.28M) on a red day! 🚨
Multiple volume spikes throughout rally (circled)
Recent volume increasing on down days = Distribution! 😰
Classic sign of smart money exiting 💸
Volume pattern deteriorating 📉
Trend Structure: 📈
Long-term: Bullish (but cracking) 🐂➡️😐
Medium-term: Bearish warning! ⚠️
Short-term: Bearish (broke support) 🐻
Broke the green accelerated trendline = First crack! 💔
Channel top rejection = Major red flag! 🚩
Technical Outlook: 🔮
Bearish Case (70% probability): 🐻
Fails to reclaim 16.00-16.50 quickly 📉
Tests 14.00-14.50 zone (-10% downside) 😰
If that breaks: 12.50-13.00 channel mid (-20%) 🚨
Worst case: 11.00-11.50 or lower 💀
High volume rejection = Strong signal! 🔴
Neutral Case (20% probability): 😐
Bounces from 15.00-15.50 current levels
Choppy consolidation for weeks
Eventually retests channel top or breaks down
Time will tell ⏰
Bullish Case (10% probability): 🐂
Quick recovery above 16.50 with volume
Breaks to new highs above 18.10
Very unlikely given volume pattern! 🤷♂️
Would need major positive catalyst 📰
Trading Strategy: 💡
For Current Holders: 😰
RED ALERT! This is serious! 🚨🚨
Tight stop loss: Below 15.00 🛑
Or cut losses now at market
Don't wait for bigger damage! ⚠️
High volume rejection = Bad news 📉
For New Buyers: 🤔
STAY AWAY! Don't catch this knife! 🔪
Wait for 14.00-14.50 test minimum ✋
Better: 12.50-13.00 (channel mid) 💰
Best: 11.00-11.50 if deeper correction 🎯
Current levels = TRAP ZONE! 🪤
For Traders: 📈
Short-term bounce to 16.00 possible (risky!)
Better: Wait for lower entry points
Short sellers: Look for lower high formation
Day traders: High volatility - tight stops! ⚡
Risk Assessment: ⚖️
🔴 HIGH RISK 🔴
Channel top rejection confirmed ✅
Massive volume on breakdown 🚨
Similar pattern to failing banking stocks 😰
Topping pattern forming 🎩🎩
Risk/reward heavily favors downside! 📉
Why This Looks Dangerous: ⚠️
Similar to Meezan Bank/Hub Power pattern:
Touch channel top ✅
Massive rally before (300%+) ✅
High volume rejection ✅
Breaking support levels ✅
All warning signs present! 🚨
What Could Go Right: ✅
Finds support at 15.00 and stabilizes
Sector-specific positive news emerges
Market-wide rally lifts all boats
Forms higher low and resumes uptrend
(Low probability scenarios) 🤷♂️
What Could Go Wrong: ❌
Cascades below 15.00 on more volume 😱
Tests 14.00 then 12.50-13.00 📉
Gets stuck in prolonged correction
Channel support fails completely 💀
20-30% correction from here 🚨
Key Levels to Watch: 👀
16.00: Reclaim = Short-term relief 🟡
15.00: Current critical support 🔴
14.00-14.50: Major support zone ahead ⚠️
12.50-13.00: Channel midpoint - key! 🎯
Volume Message: 📊
Today's 19.28M volume is screaming:
Distribution in progress! 📢
Smart money reducing positions 💸
Retail likely holding/buying the dip 😰
This is a major warning sign! 🚨
Time Horizon: ⏰
Short-term (1-2 weeks): Test 14.00-15.00 📉
Medium-term (1-3 months): Likely 12.00-15.00 range 😐
Long-term (6+ months): Could resume uptrend from lower 🐂
Bottom Line: 🎯
PIBTL is showing MAJOR warning signs - channel top rejection with huge volume! This looks like the beginning of a correction after a 300%+ rally. The 15.00 level is critical - if it breaks, expect a move to 14.00-14.50, then potentially 12.50-13.00. Current levels offer terrible risk/reward.
This is NOT the dip to buy! Wait for the dust to settle and proper support formation at lower levels. The massive volume today tells us institutions are exiting - follow the smart money! 🏃♂️💨
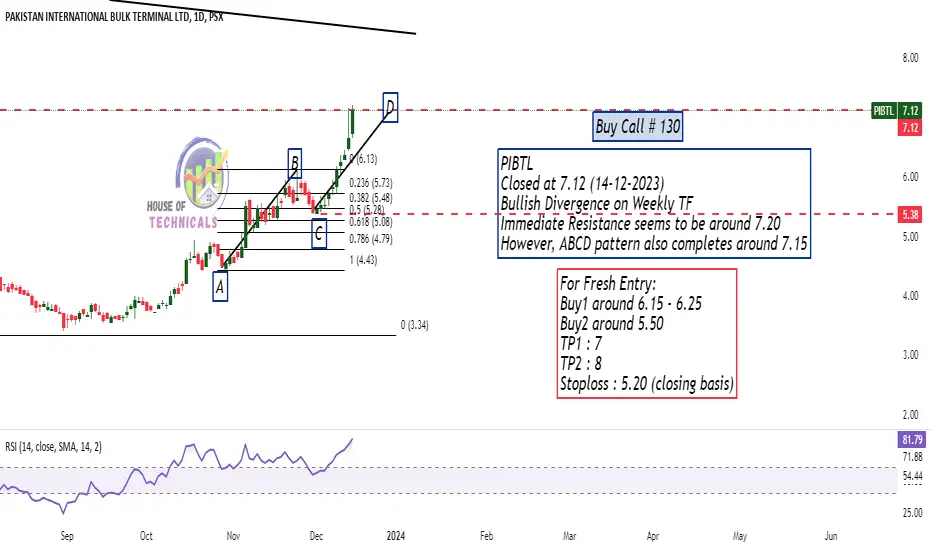
Continuously making HH HL.PIBTL Analysis
CMP 14.93 (15-10-2025 3:19PM)
Continuously making HH HL.
Strong Support seems to be around 14.50
& then around 12.80 - 12.85.
Upside resistance is around 16 - 16.50
Crossing & Sustaining this level may take
it towards 19 - 20
However, breaking 11.90 may bring more
Selling Pressure.

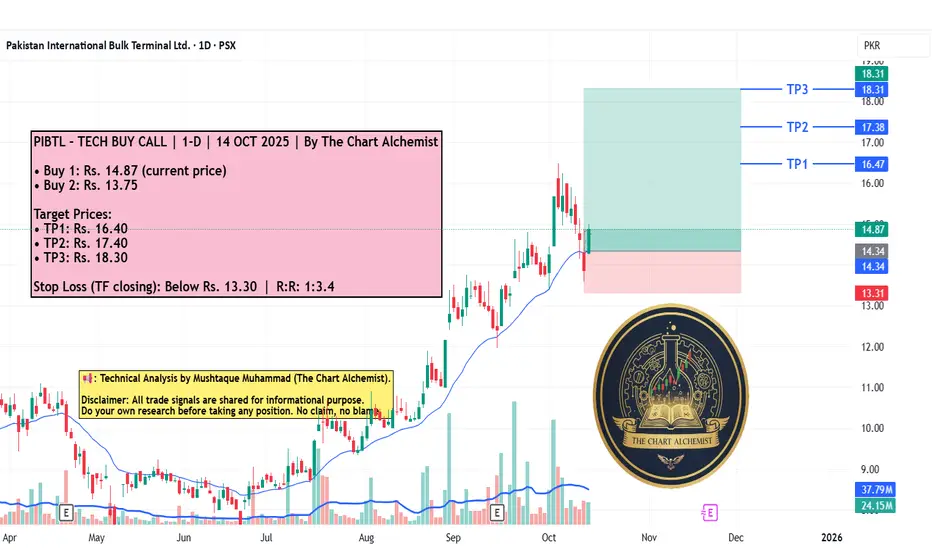
PIBTL – BUY TRADE | 1-D | 14 OCT 2025 | TCA
PIBTL – TECH BUY CALL | 1-D | 14 OCT 2025 | By The Chart Alchemist
The stock is in an uptrend and previously achieved a high of Rs. 16.5. After a pullback that ended at a bullish IFDZ, the stock has shown an upward reversal. We expect PIBTL to continue moving upward and achieve multiple bullish targets.
📢 Technical Analysis by Mushtaque Muhammad (The Chart Alchemist).
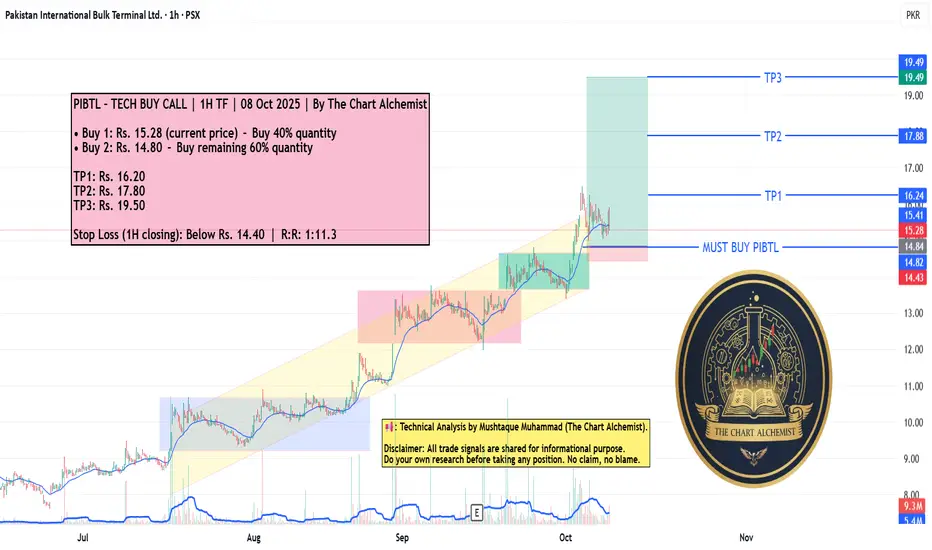
PIBTL – BUY TRADE | 1H TF | 08 Oct 2025 | TCA
PIBTL – TECH BUY CALL | 1H TF | 08 Oct 2025 | By The Chart Alchemist
The stock continues to move within a bullish channel with healthy consolidation phases, confirming the sustainability of its bullish trend. Recent structure and volume behavior indicate the potential for another upward leg, with room to achieve multiple quantified targets in the coming sessions.
📢 Technical Analysis by Mushtaque Muhammad (The Chart Alchemist).
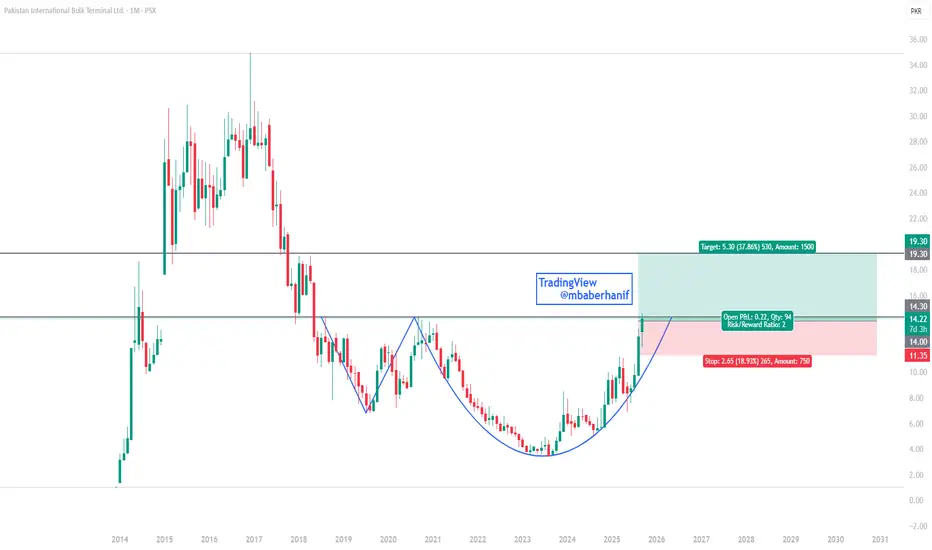
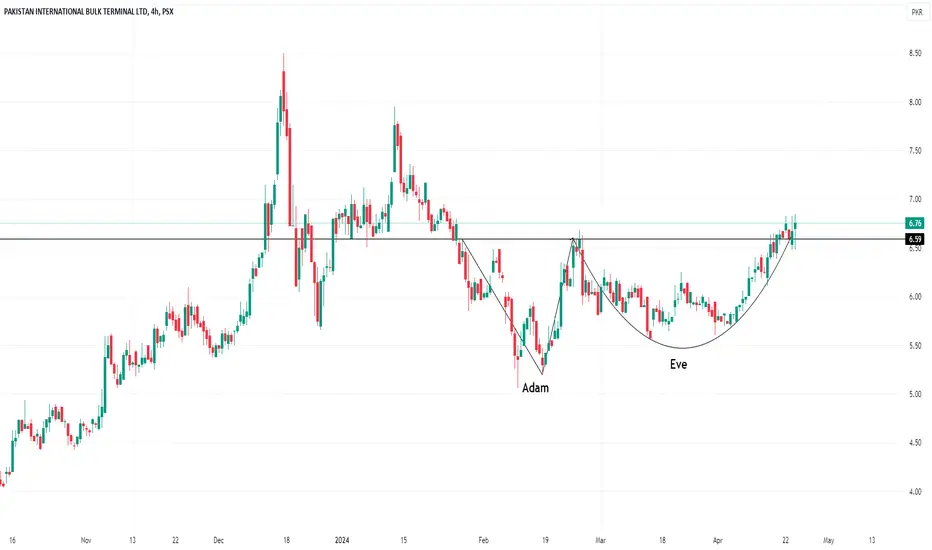
PIBTL | Adam & Eve Bottom Pattern🔥 Stock Alert – PIBTL 🚀🔥
PIBTL is showing a strong Adam & Eve bottom pattern on the monthly chart, supported by surging volumes that signal a powerful breakout confirmation 📈. The stock has cleared its neckline zone and is now poised for the next leg higher.
🎯 Target: 19.30
🛑 Stop-Loss: 11.35 (risk/reward ratio ~2:1)
With volume backing this breakout, PIBTL looks set to accelerate towards its next resistance at 19.30 — a bullish move in the making! 🚀✨
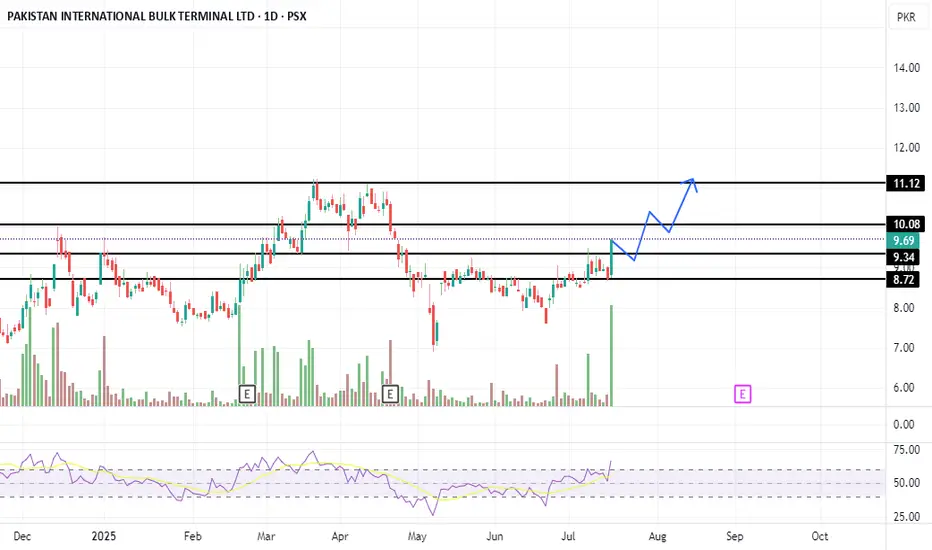
PIBTL Share Buying StrategyPIBTL Share Buying Strategy
🔑 Key Buying Zone:
Buy between PKR 9.69 – 9.34
🛑 Stop Loss:
Set at PKR 8.70
🎯 Targets:
Target 1: PKR 10.08
Target 2: PKR 11.10
📈 Extended Plan:
If price sustains above PKR 11.10, consider holding with a trailing stop loss to capture further upside.
PIBTL SHORT TRADEShort sell PIBTL if it falls below its uptrend channel
It has already given upward Shortening of Thrust and a lower high
Short PIBTL 9.0
TP1 7.25
TP2 5.7
TP3 5.2
SL 9.55

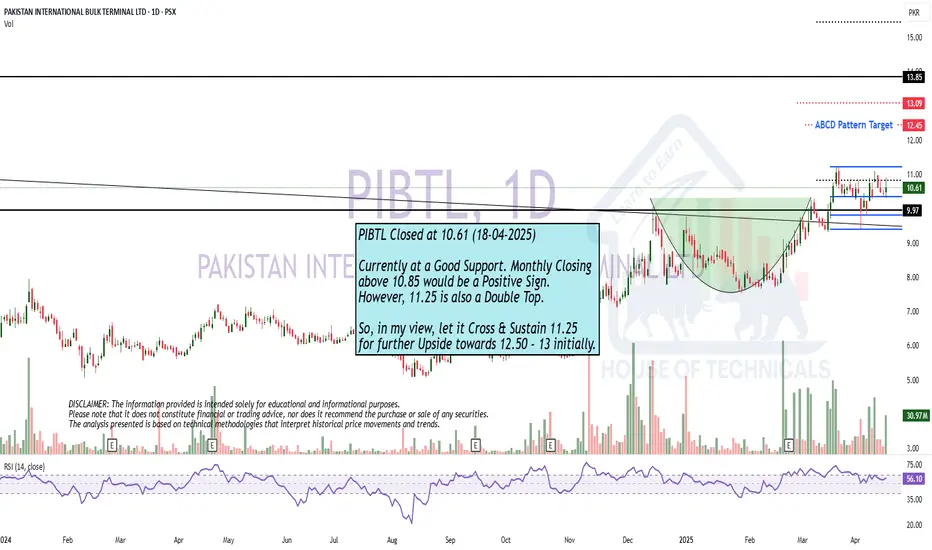
Monthly Closing MattersCurrently at a Good Support. Monthly Closing
above 10.85 would be a Positive Sign.
However, 11.25 is also a Double Top.
So, in my view, let it Cross & Sustain 11.25
for further Upside towards 12.50 - 13 initially.
PIBTL Price Forecast: Buy the Breakout or Wait for a Pullback?Current Price: PKR 9.71
Trading Strategy:
Entry Point: If the stock successfully breaks above the trendline (~PKR 10.00) with strong volume, enter a buy position.
Target Price: First target PKR 12.50, second target PKR 14.00.
Stop-Loss: Below the recent swing low (~PKR 8.50) to limit downside risk.

PIBTL - PSX - Technical AnalysisOn daily TF, Price is in sideways for the past few days. A sharp move can be expected if it breaks resistance of 8.90.
Historically price has been moving up by making Elliott Impulse Waves. Therefore, price may either follow the pattern and price may go down after testing the TP-1. Or may continue going up in the drawn parallel channel to test TP-2.
Trade Call
Buy-1 : 9.0
SL: 7.07
TP1: 11.97
TP2: 14.05

PIBTL -PSX BuyPIBTL formed a classic Cup and handle formation in last one year (almost 236 trading session). the instrument recently gave breakout of this formation with very high volume. Volumes are synched with the price. If it sustains at this level, then bulls will get strength. TP-1 with 1:1 risk reward and TP-2 according to Cup and handle formation may be targeted.

PIBTL | Dragon PatternPattern: Dragon Pattern
Current Status: Breakout observed from the dragon pattern.
Trade Strategy:
Entry: Long position at closing price of 6.
Target: 7
Stop Loss: 5.50
Summary: PIBTL has broken out of a dragon pattern, signaling potential bullish momentum. Enter at 6, aim for a target of 7, and set a stop loss at 5.50 to manage risk.


PIBTLWe can attempt to buy PIBTL from specified level as 0.5 FIB level also intact , also there is no bearish divergence at current level .
SL , TP mention in chart

PIBTLPIBTL displays a promising bullish reversal pattern characterized by the formation of an ADAM and EVE pattern. Our plan entails accumulating the stock within the designated buy back zone (6.50-6.80 range), while setting stop loss orders below 6 to manage risk effectively. Anticipation builds for a substantial surge in momentum upon the breakout from the neckline, anticipated around the 7 area. To guide our trading decisions, we've delineated two distinct targets: an immediate target around 7.50 and a final target for exiting the trade will be around 8.
PIBTLFor Fresh Entry:
Buy1 around 6.15 - 6.25
Buy2 around 5.50
TP1 : 7
TP2 : 8
Stoploss : 5.20 (closing basis)
PIBTL - BULLISHPIBTL looks bullish and is in uptrend as it makes its first higher high and now making higher low.


PIBTL - FALLING WEDGE IN AN UPTRENDPIBTL - Currently trading in a falling wedge, likely to test the BO point @ 6.50. On a break above the price could extend gains towards 8.00 - 9.20 levels.
Buy with risk defined below 5.66 levels.
