Cup & Handle...PPL Analysis
Closed at 193.80 (09-10-2025)
Immediate Support is around 190 - 192
& then around 178 - 180
It has the potential to touched 215 - 216
& then 240 but only if 216 - 217 is crossed
with Good Volumes.
Breaking 174 may bring more selling pressure.
PPL trade ideas

PPL Technical Analysis: Bullish Setup in PlayPPL (Pakistan Petroleum Limited)
Price is moving within an ascending channel and currently sitting at the Fibonacci golden zone. It’s also trading above a strong support area that had previously acted as major resistance.
The stop loss is placed below the recent higher low. Buy 2 is positioned near the confluence of horizontal support, channel support, and the rising trendline in case of a pullback. RSI is in sync, and price is trading above the 50 EMA — a level it has historically respected. It’s also holding above the golden cross, adding further strength to the bullish bias.
The first target aligns with the recent resistance, which also sits around the all-time high. A strong close above that zone, supported by healthy volume, could open room for an extended move upward.
Recommended Levels:
Buy 1: 199.66 (CMP)
Buy 2: 195.00
Stop Loss: Closing below 188.00
Take Profit 1: 210.00
Take Profit 2: 222.00
Take Profit 3: Ride the trend with a trailing stop
Potential remains strong as long as price sustains above the horizontal support and rising trendline. Happy trading!

PPLI have marked the long position as I noticed that the candle broke resistance and closed above that level which signals a bullish movement. I put the SL to the previous area of support incase the price retraces and takes the support at previous level. Marked Tp at the first resistance as my TP1.

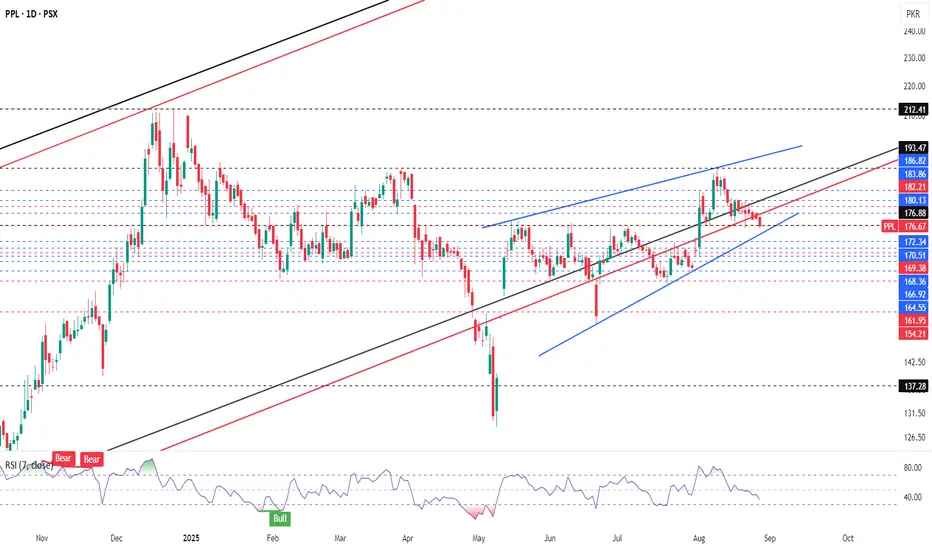
PPL - reaching lower edge of daily channel with RSI < 50PPL - reaching lower edge of daily channel with RSI < 50
Buy when RSI > 50 and it starts to move upwards after touching the lower edge of Daily channel (blue)
PPL Technical AnalysisPPL Technical Analysis:
PPL faced rejection at the 193 level on August 8th and has been trending downward since. The stock found initial support around 176 but is currently consolidating in the 178-183 range, showing limited buying strength.
Key Levels to Watch:
Primary Support Zone: 170-173 - This is the critical level where we expect the next major support test
Secondary Support: 160-165 - If the primary support fails to hold, the stock could decline further to this range
Trading Strategy:
Wait for price action around the 170-173 support zone before taking any positions. Confirmation of support at this level is essential. A failure to sustain above 170-173 could trigger further downside movement toward 160-165.
Technical Indicators:
RSI currently at 53, with expectations of a decline to 48 where it may find support
Overall momentum remains bearish until proven otherwise
Risk Management:
Monitor the 170-173 level closely for support confirmation. Any breakdown below this zone with volume would validate the bearish outlook toward lower targets.
PPL✅ Trade Plan:
Entry: Above 182 – 184 confirmation (flag breakout).
Target 1: 190 – 192 (short-term resistance).
Target 2: 208 – 215 (medium-term resistance zone).
Stop Loss: Below 172 (to protect capital in case of breakdown).
Risk/Reward: Attractive, ~1:2 to 1:3 depending on entry/exit.
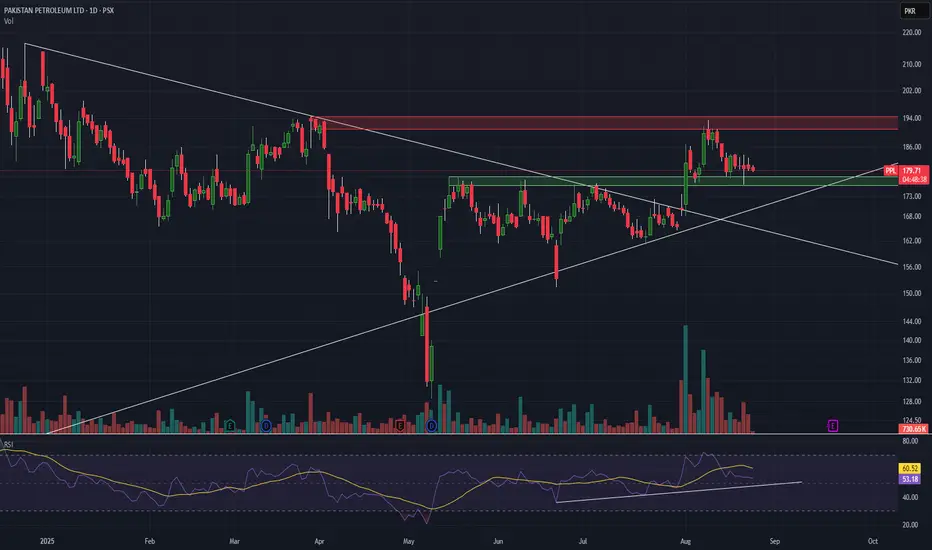
Pakistan Petroleum LimitedSupport Zones and Long Term Price Targets Market
Volume Profile has PoC and Range defined.
177 support established. BUY.
Deeper Support (Green Line) and DCA Zone (Blue Box) also visible.
195-203 providing interim resistance.
Red Line above is the ATH
Purple Lines above resistance are Longer Term Price Targets.
Overall, it's a Bullish Penant Breakout on Higher Time Frames. Weekly Chart Analysis

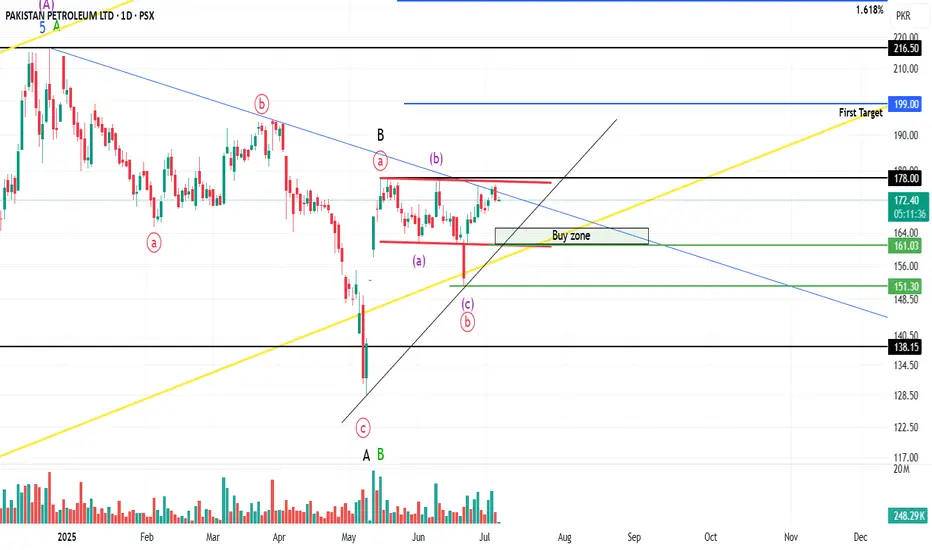
PPL PROBABLY IN WAVE '' C '' - LONGThis is in continuation to our ongoing tracking of PPL wave structure
PPL is most probably in wave C of a Y or B wave which will target areas of 200 and further up 230 - 250 level. Our ideal buy zone is at 165 - 160, however looking at the market momentum we might not get to our buy zone and prices will rise directly.
We will enter long positions once market breaks above 178 level (keep eye on the volume), although entering market at 178 will significantly effect our risk/reward ratio compared to entering at the buy zone of 165 - 160, either ways we will take long positions.
Alternately, if the prices decline below 151.30 then this trade setup will get void, 151.25 can be used as stop loss.
Trade setup:
Entry price: 165 - 160 (Ideal) or 178
Stop loss: We are bullish on PPL long term therefore we will hold these positions
Targets:
T1: 198 - 200
T2: 230 - 250
Let see how this plays, Good Luck!
Disclaimer: The information presented in this wave analysis is intended solely for educational and informational purposes. It does not constitute financial or trading advice, nor should it be interpreted as a recommendation to buy or sell any securities.

PPL Share buying StrategyPPL share Buying Strategy
PPL Showing us buying momentum with volume end a bearish trend.
Buying around 181- 174
Stop loss 160
Target 190
Target 213
Is sustain above 213 theb Use trailing stop loss to minimise your risk

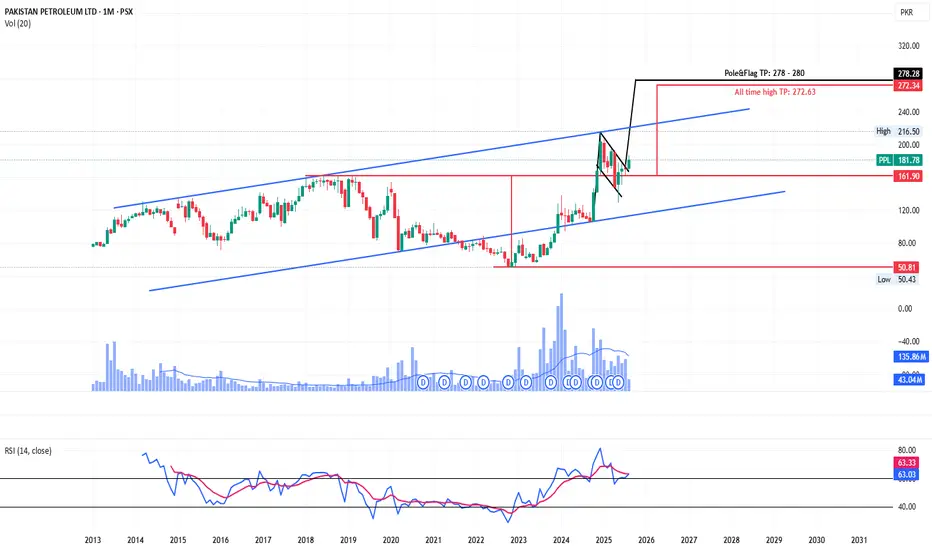
Monthly Breakout.PPL Analysis
Closed at 181.78 (01-08-2025)
Monthly Breakout.
Extremely Bullish; potential to touch 240+
However, it should not break 128 now.
174 - 175 & then 165 - 167 seems to be a
Good Support level.

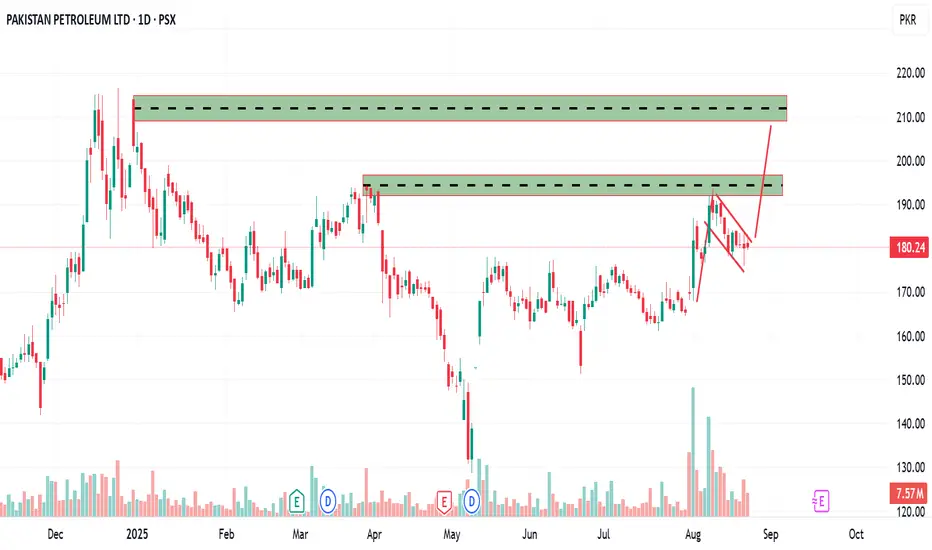
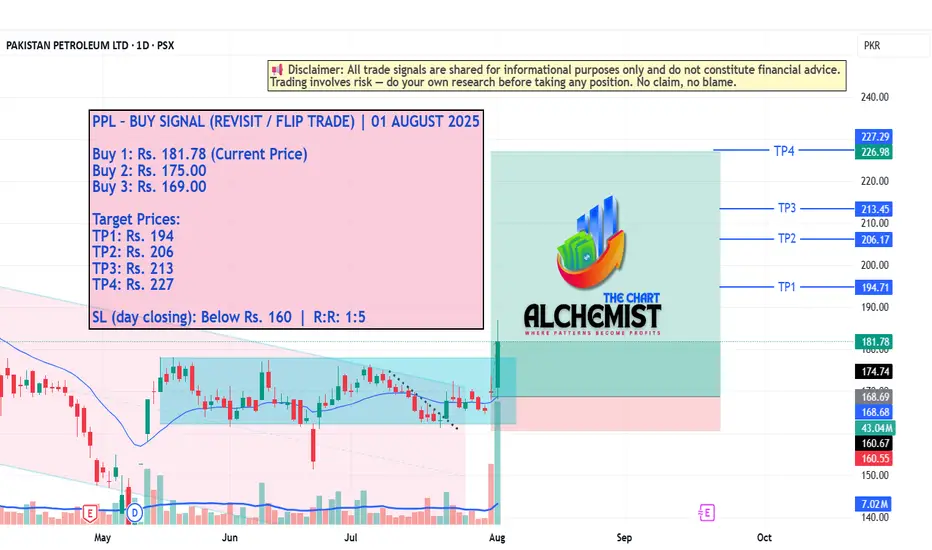
PPL – BUY SIGNAL (REVISIT / FLIP TRADE) | 01 AUGUST 2025 PPL – BUY SIGNAL (REVISIT / FLIP TRADE) | 01 AUGUST 2025
The stock has recently been moving within a bearish channel (marked light pink), which structurally qualifies as a bull flag. A decisive breakout from this flag has now occurred, followed by the formation of a strong bullish structure. This confirms upward momentum and provides solid structural support for a sustained rally.
Though Still Bullish on Bigger tf, butPPL
Closed at 169.04 (23-05-2025)
Though Still Bullish on Bigger tf, but
Currently, resisted & closed around an
Important Resistance level around 169-170
Important Support level seems to be around 138 - 143

PPL PROBABLY IN WAVE '' A '' OR " B " - LONGThis is in continuation to our previous published idea in which we decided not to take buy positions due to developing geopolitical tensions which luckily was a wise decision. Now since the tensions have eased up and the bail out have been approved, the bullish scenarios have opened up again.
PPL is most probably in wave C of an A or B wave which is about to get completed. Our preferred wave count suggest that we should get one more leg down towards 124-106 range marking the end of the downtrend.
Alternately, if the prices start to rise and do not go below 128.56 and takes out 155, we will mark this C wave as completed.
Trade setup:
Entry price: 124-106
Stop loss: We are bullish on PPL long term therefore we will hold these positions
Targets: will update later once price reach our buy zone
Let see how this plays, Good Luck!
Disclaimer: The information presented in this wave analysis is intended solely for educational and informational purposes. It does not constitute financial or trading advice, nor should it be interpreted as a recommendation to buy or sell any securities.

PPL PROBABLY IN WAVE '' A '' OR " B " - LONGPPL is most probably in wave C of an A or B wave which is almost completed or about to get completed. our preferred wave count suggest that we should get one more leg down towards 144-140 range which will touch the long term yellow trendline and prices should bounce from there, the other possibility is that price will not go below 147 and will keep on climbing toward 173-183 range or towards the blue trendline.
Alternate wave count suggest that wave C might get extended and will keep on declining reaching our long term buy zone of 124 - 106 range.
So this is how we will trade this setup:
Scenario 1:
If 147 is not taken out and prices keep on rising then we will not take any trade because our confirmation level is 164.11 and target is 173-183 which does not give us a good risk/reward ratio
Scenario 2:
If prices do decline below 147 and reach 144-140 level, we will buy a small portion at that level and will wait for a bounce from the yellow trendline, if prices unfolds as predicted then we will add more to our long positions using swing trade. However, if prices keep on declining towards our long term buy zone then we will add positions at 120-110 levels. PPL has strong fundamentals therefore we are quite comfortable holding it for long term.
Trade setup:
Entry price: 144-140
Stop loss: We are bullish on PPL long term therefore we will hold these positions
Targets: 173-183 (Ideal is upper blue trendline)
If our wave count is correct then we might make 20.97% or 25.87% of gross profit on this trade
Let see how this plays, Good Luck!
Disclaimer: The information presented in this wave analysis is intended solely for educational and informational purposes. It does not constitute financial or trading advice, nor should it be interpreted as a recommendation to buy or sell any securities.

Double Bottom formed around 164 - 165.
Double Bottom formed around 164 - 165.
Crossing & Sustaining 179 may lead it
towards 190 - 193.
For a Bullish Momentum, it needs to Cross
195 atleast.

Positive Monthly Closing is ImportantMonthly Closing above 191.10 will trigger more
positivity.
It may touch 200 - 210 initially.
Morning Star Formation Expected on Monthly tf,
and may target 215 - 216

Trading Strategy; PPL (PSX) showing Bullish Reversal The PPL chart in PSX on daily time frame showing a bullish reversal Gartley Pattern.
The analysis has shown the entry point, stop loss and TP1 and TP2 levels for investors and traders working in PSX.(PAKISTAN)

Pakistan Petroleum Limited. Trade PlanPpl has formed a falling wedge pattern. It has a given a breakout and also retested it.
Bullish on Monthly and Weekly timeframes.

PPL Stock Analysis - *Price Range:* PPL stock is expected to move between 188-180.
- *Buying Opportunity:* Any weakness in the stock price may provide a buying opportunity.
- *Breakout Level:* If the stock closes above 188, it may trigger a bullish movement.
- *Target Levels:*
- Initial target: 198
- Final target: 213
- *Stop Loss:* Below 178

PPL Retracement to Key Fibonacci SupportPPL surged to around 217 before retracing to 171, completing a significant pullback. It is now trading at the 0.618 Fibonacci level, a strong buying zone, indicating potential bullish momentum ahead.

PPL BULLS TODAY!!Market has reached to a conclusive state of downtrend, possibly reaching till 164pkr.
But for daytraders an opportunity awaits for a short term buy till 177 ( only if the entry is right )
other factors include rsi oversold and weak but stubborn support.
