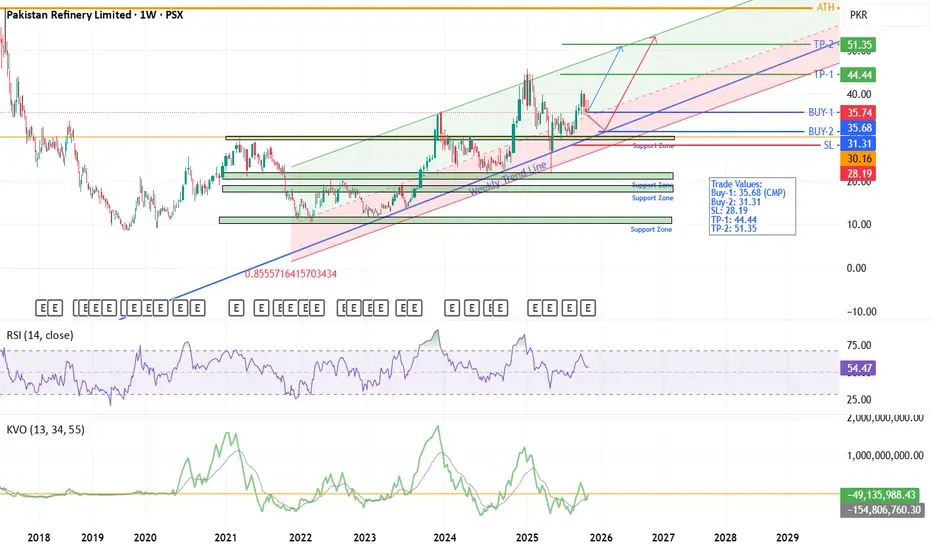
PRL - PSX - Weekly Technical AnalysisOn weekly TF, since Feb 2022 PRL is making HHs and HLs.
Regression Channel (RC) has been drawn with Upper Standard deviation set at 3 and Lower Standard deviation set at 2. In RC, central dashed line is most frequently visited by the price action. In addition, a weekly trend line (blue) has also been drawn. It is observed that price action respects trend line for taking support by it.
Anyway, PRL seems to be continuing its upward movement in the channel. However, its delayed payments by Govt for the last 2 years is major concern. If somehow, this aspect is improved then this SCRIPT can perform much better. In upcoming major military exercises of India may also trigger Risk Off scenario where Oil & Refinery Sector can get a boost as well. KVO suggest that this SCRIPT is about to go up. No divergence on RSI so trend should continue.
Trade Values:
Buy-1: 35.68 (CMP)
Buy-2: 31.31
SL: 28.19
TP-1: 44.44
TP-2: 51.35
Trade ideas
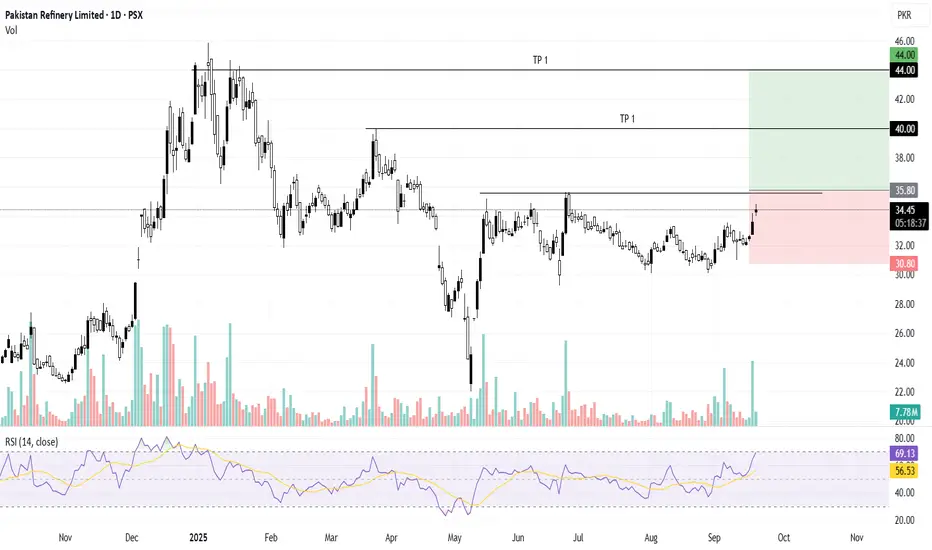
Important Support Zone!PRL Analysis
CMP 36.04 (17-10-2025 11:16am)
34 - 35 seems to be a Good Support level.
Sustaining this may lead it towards 40 & then
around 44 - 45.
Breaking 32 may expose 28 on monthly range.

Gaining Momentum!PRL Analysis
CMP 32.73 (04-09-2025 11am)
Breaking Out!
Gaining Momentum!
Important to Sustain atleast 32.30 on Monthly basis
for further upside.
Upside resistance is around 37 - 38.
However, breaking 30 may bring more selling pressure
towards 28 - 28.50.

PRLThe chart clearly shows a Bullish Gartley Harmonic Pattern labeled X-A-B-C-D.
XA leg: strong bullish impulse up to ~41 PKR.
AB leg: retraced ~61% of XA (typical Gartley retracement).
BC leg: extended to ~1.03 of AB (within valid harmonic range).
CD projection: expected to complete near 40.5–41.0 PKR, aligning with the prior resistance zone.
This suggests a potential bullish continuation if price sustains above the 38–39 neckline region.

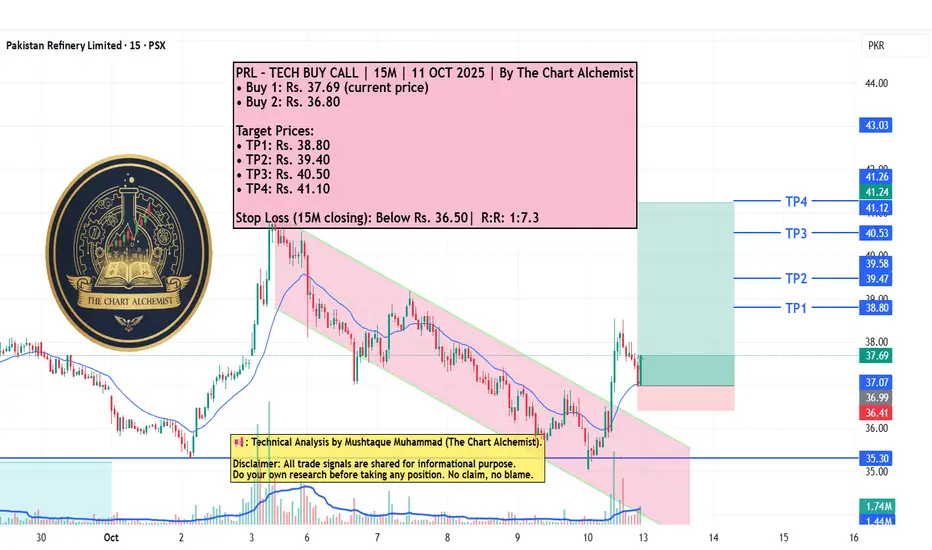
PRL – TECH BUY CALL | 15M | 11 OCT 2025 | By The Chart AlchemistPRL – TECH BUY CALL | 15M | 11 OCT 2025 | By The Chart Alchemist
After achieving a high of Rs. 40.9, the stock entered a pullback phase within a bearish channel (marked light pink) and later broke out, reaching Rs. 38.5. Following another short-term pullback, PRL now appears ready to resume its upward movement within the intraday structure.
📢 Technical Analysis by Mushtaque Muhammad (The Chart Alchemist).
PRLPattern Structure
A → B: Strong impulsive rally from ~35.5 to ~38.5 (≈ +3 PKR move).
B → C: Healthy correction to ~36.9 forming higher low above A — classic bullish retracement (≈ 0.618 Fibonacci of AB).
C → D (projected): If symmetry holds (AB = CD), the next upside target (D) aligns near 40.5–40.8, which coincides with previous resistance (highlighted purple zone).

PRL Accumulation Breakout SetupPRL is currently in an accumulation box, with rising volumes suggesting a potential breakout from the zone. A buy above the selling zone is recommended, with a stop loss below the local bottom.
PRL buying StrategyPRL buying Strategy
PRL current price 38
buying around 38-36
Stop loss 35
target 44

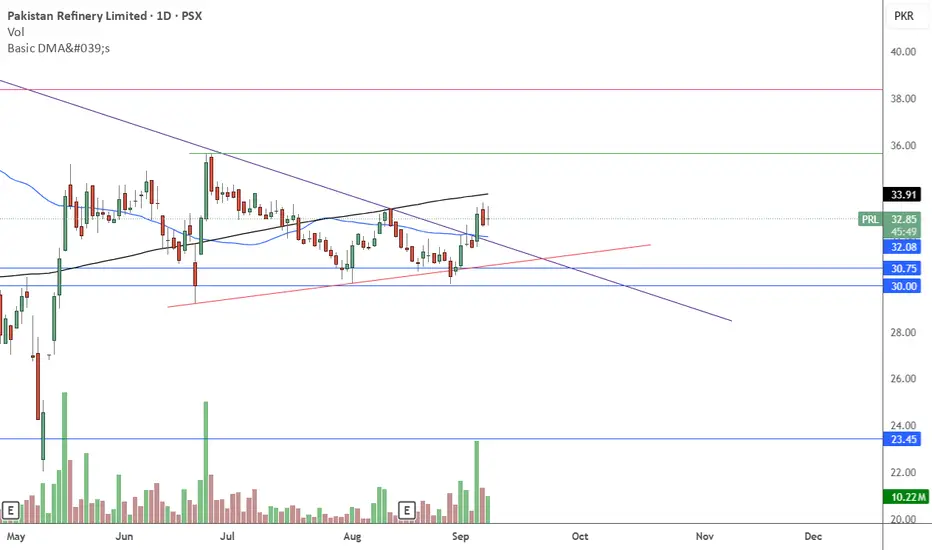
PRL - Pakistan Refinery Limited - LongBroke Weekly Resistance Trendline & Daily Time Frame is around Retest Level Indicating Buy.
Target : 35.65 & 38.38
POSITIVE SIGNAL
$6 billion refinery upgrades + supportive fiscal policies.
Procurement of Bonny Light crude may enhance margins and pricing flexibility.
Stable ownership and controlled volatility add to investor comfort.
PRL – TECHNICAL BUY CALL | 24 SEPT 2025 (1H TF) PRL – TECHNICAL BUY CALL | 24 SEPT 2025 (1H TF)
The stock broke out of a re-accumulation phase (light blue channel), achieving a high of Rs. 37.3. After a pullback, the stock seems ready to move upwards towards multiple bullish targets.

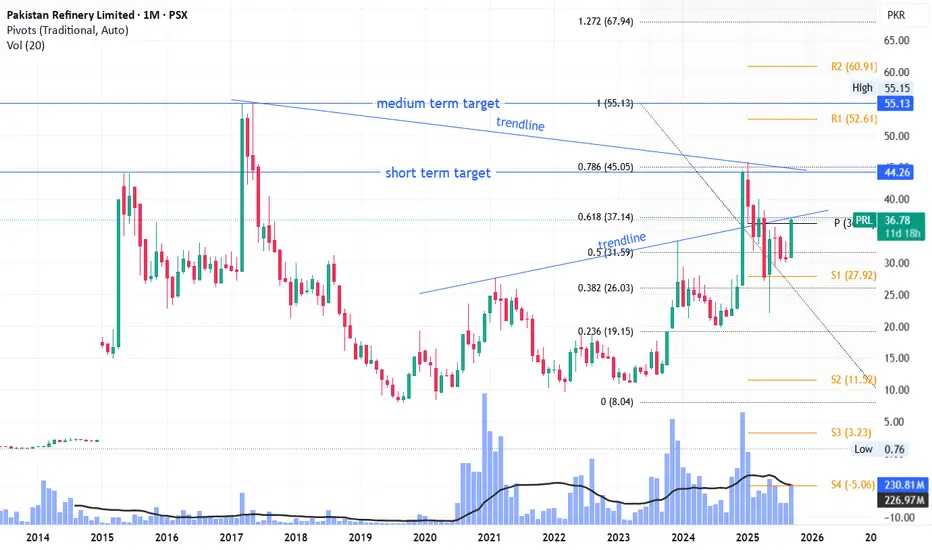
PRL LongPRL has given a trendline breakout yesterday at 32.94
Now its again going to test its Fib 0.618 level of all-time high (37) and if surpassed, will again hit Fib 0.786 level of all-time high (45).
It may also touch its all-time high again if volumes support which is 55.
Further trendline resistances can be faced at current market price i.e. 36.78 and 45 (45 can be a bit hard to break).
This is my personal analysis and not a buy / sell call.
PRLBullish breakout from falling wedge after completing wave structure.
Next short-term target: 35.0 PKR,
Medium-term target: 38 – 40 PKR.
Watch for retest near 32.5 for safer entry.

PRL buying StrategyPRL Share Buying Strategy
Key Points:
1. Buying Range: 33-31
2. Stop Loss: 29
3. Target: 39
further hold if close above 39 and sustain

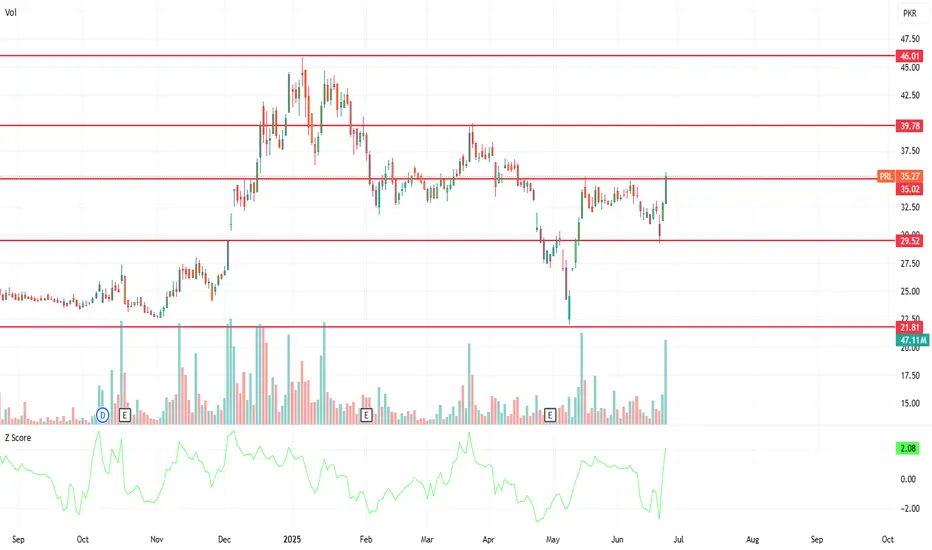
PRL Key levelsPRL key levels are
46.01
39.78
35.02
29.52
21.81
Note: This is not a buy/sell trade call.
Monthly Closing is Important.PRL Closed at 32.21 (20-06-2025)
Monthly closing above 32 - 32.20 would
be a positive sign.
Upside immediate targets can be around 37 -38.
Breaking 31.50 may lead it towards 27 - 28

Bullish
Closed at 34.03 (21-05-2025)
Hidden Bullish Divergence on bigger tf.
Bullish Divergence on shorter tf.
Immediate resistance is around 34 - 34.10
Crossing & Sustaining this level may exposes
upside towards 47 - 48
However, mid way, 40-41 & 44-45 are important
resistances that should not be ignored.
On the flip side, 30 - 32 are important Support levels.
and 29.80 Must not Break on Monthly Basis.


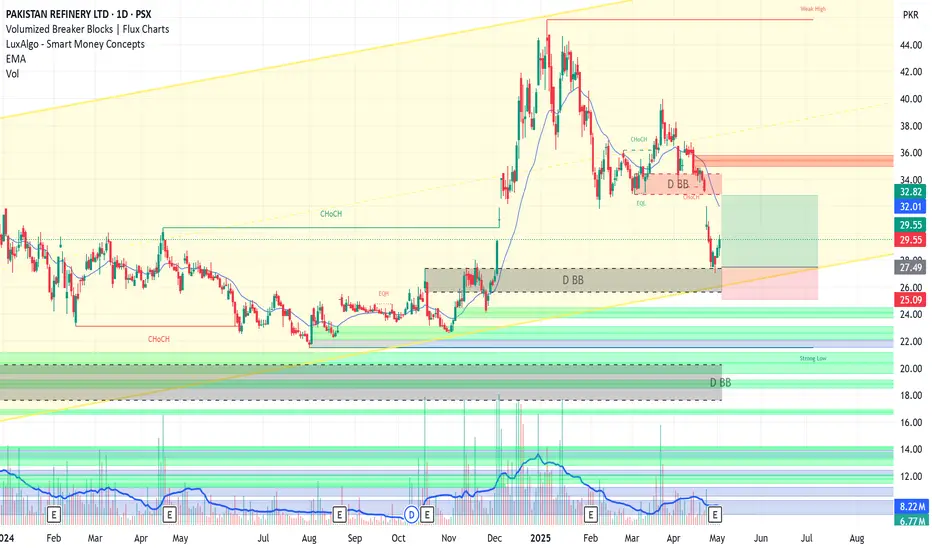
PRL ANALYSISThough PRL is trending in uptrend channel(yellow) in higher timeframe, presently it is in its down leg(pink channel), it has taken support from an important level of 22, it seems going towards higher end of Yellow channel or measured move after breakout from pink channel but there seem two main hurdles in this scenario, biggest is Bearish Breaker Block at 33 and others is still smaller volumes in its current rise from 22.
If PRL gets rejected from 33 then its downside target will be 20.
But on a brighter side if it manages to breakout from pink channel at 35 with heavy volumes only then can it go to target of measured move to 46 and yellow channel top 49
Conclusion: Don't buy at current levels before breakout at 35. In case of previous buying apply SL in case of rejection at 33

PRL LONG TRADEPRL has confirmed its bounce from bottom of upward channel and Breaker Block
It's short term high probability trade
Buy PRL 27.5-29.5
TP 32.8
SL 26.6
No Bearish Divergence on Monthly Tf.No Bearish Divergence on Monthly Tf.
But 39-40 is a Very Strong Resistance
that needs to Cross & Sustain with Good Volumes to
reach 45 - 46 & then 50+
We should not ignore that it has taken Support
from a Very Important Fib level around 32.40
Monthly Closing above 33.60 would be a Very Healthy sign.
So any dip towards 32.50 - 33.50 can be a Buying Opportunity.
However, it should not break 31.80 otherwise we
may witness further Selling Pressure towards 28.50 - 28.70

PRL is gaining momentum for upside movePRL is rising on daily time frame, price is printing higher highs and higher lows
good chance for buying at current level with a define stop loss

Bullish on Monthly TF but..Bullish on Monthly TF.
No Bearish Divergence on Monthly Tf.
But 40 - 40.20 is a Very Strong Resistance
that needs to Cross & Sustain with Good Volumes to
reach 45 - 46 & then 50+
We should not ignore that it has taken Support
from a Very Important Fib level around 32.40
Monthly Closing above 33.60 would be a Very Healthy sign.
So any dip towards 36.50 - 37.50 & then 34.50 - 35.50
can be a Buying Opportunity.
However, it should not break 31.80 otherwise we
may witness further Selling Pressure towards 28.50 - 28.70

PRL WEEKLY CHART TOWARDS 60 ??PSX:PRL
1. Weekly chart suggests that price is working in cup shape.
2. AB:CD pattern is in play since 2023.
3. DEC23 : 35, Dec24: 45
4. Safe bet for PRL with current patterns is 55-60
