PSX PRL : Entry Points, Targets (Gain 15%--30%)Current Price: PKR 34.18
Entry Point: Around PKR 31 - 33, as this is a key demand zone
First Target: PKR 38 (Short-term resistance level)
Second Target: PKR 42 (Major resistance zone, where selling pressure might appear)
Risk Consideration:
If the stock fails to hold PKR 30, it may enter a further bearish phase.
Trade ideas


PRL is in uptrendPRL has taken a due correction and know showing bullish signs perfect entry sign for traders
buying is recommended.

AB=CD Pattern with Bullish Flag: Key Fibonacci Levels in Play!It could be an example of a Bullish Flag.
Why am I posting it?
The reason is to show an example of the AB=CD Pattern, and it currently respected the 61.80% Fibonacci level at 22.17.
If it breaks the 61.80% level on a closing basis (Keeping in mind, it's a Weekly Chart :-) ), it could drop to 18, potentially forming a double bottom. However, if it plays out as expected, the target can be 40+!
Anyhow, I am personally not invested in it—this is just for learning purposes.

Making HH HL on Daily TF.
38.30 can be an Immediate Support level.
However, 35 - 37 is still an Important Support zone.
On the flip side, 41 - 42 is the immediate
Resistance. Ultimate Targets can be around 50.
30 should not be broken, otherwise we may
witness Trend Reversal.

Bullish on All Time Frames.Bullish on All Time Frames.
Immediate Support seems around 34.50 - 34.80
Weekly Closing above 35.10 will trigger more
positivity targeting 37 initially.
Crossing 38.20 may lead it towards 42 - 43

Bullish Trendline Support with Potential Upside Towards PkR27The price recently touched a support level near PkR23, aligned with a rising trendline (orange). Several zones are marked, including potential supply zones (red) around PkR27-29 and a demand zone (green) at PkR22. A forecasted price projection (green line) indicates potential upward movement, possibly reaching the 27-29 range, with a pullback expected afterward.

PRL could drop to 24 and 22 levelsChinese investment news was fake and today's results are negative. These both things hit it hardly, May be it drop to these support levels.

PRL - Trend ReversalPRL trend reversal based on divergence and formation of Higher High. Defined SL, Entry, TP1 and TP2.

Prl - Buy CallPrl - Buy Call
Entry price - Buy above at - 26.05
Stop loss - 21.50
Take profit - 30.40

PRL Bullish Based On Marketwide ActionTechnical Analysis: PRL - Buy Call
* Price Action: Consolidating above ascending trendline.
* Breakout: Potential uptrend above PkR25.55.
* Resistance: Initial at PkR28, intermediate at PkR30, major supply at PkR36.
* Moving Averages: Below 200-day SMA, above 50-day SMA.
* Momentum: Bullish (MACD, RSI).
* Risk Management: Stop loss below PkR23 if trendline breaks.
Overall: Bullish consolidation, potential for uptrend, but risk of downside if trendline breaks.

Bullish Divergence on Daily TF.
23.20 - 24 is a Confluence Support
Zone.
Immediate Resistance is 26 - 26.50
Crossing & Sustaining 26.50 may lead
it towards 30.

PRL is BULLISHPRL is bullish until it dos not sustain below 20
It can surely double and may triple the investment in one year.

PRL - Bullish FlagPRL has completed its 0.618 retracement and showing the RSI div on dialy TF.
The idea is to buy on the break on HL on daily chart and SL would be at last lower low.

FREE CALLBullish Divergence on Daily TF.
Those who are Holding PRL, should book
some profits near 24.50 and then 25.50
PRL will start its Bullish momentum once
it sustains 25.80; targeting 28 initially.

PRL is BullishPRL has been moving downwards and bears had complete control, however the bullish RSI divergence on daily time frame, shows that bulls are waking up to the calling and trying to assume control of the price action. If the price managed to break previous lower high and prints a higher high instead then according to Dow theory it could mark the beginning of a bullish rally. Targets are mentioned on the chart.

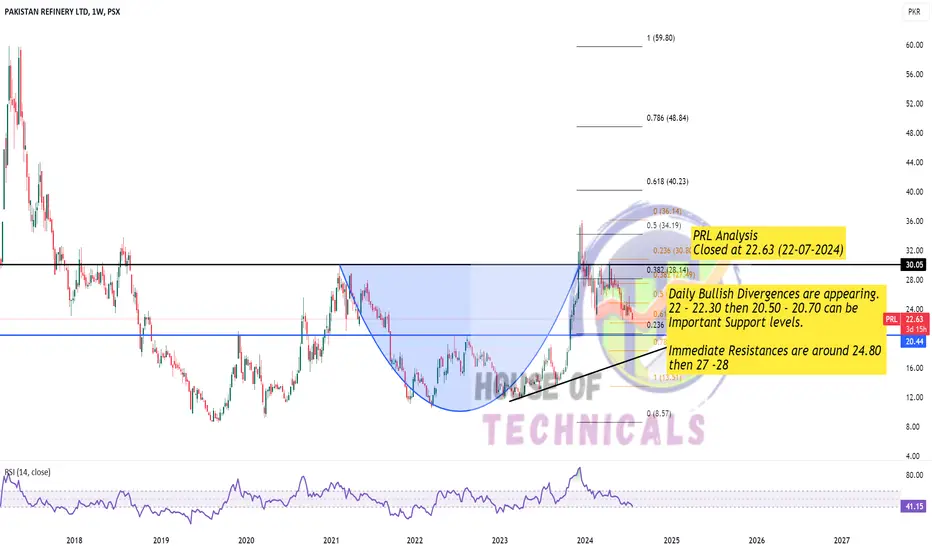
Daily Bullish Divergences are appearing.
22 - 22.30 then 20.50 - 20.70 can be
Important Support levels.
Immediate Resistances are around 24.80
then 27 -28
PRL PSX Harmonic Pattern BullishPRL PSX Harmonic Pattern Bullish
Reversal Pattern detected for PRL with two targets and Stop loss
instant Entry

PRL-Sideways triangle pattern forming on the 1D time frameThe stock looks like in a sideways triangle pattern. In case we see a few volume spikes on the daily basis, we can hope for an upward break towards our TP1 of rs. 29.04. Sustaining above that could give us a weekly break out and TP2 of rs. 30.79.

Bullish on Monthly TF
28 - 29 is an Important Resistance for now.
Crossing & Sustaining 30 would lead it towards 34
initially
On the flip side, 26 - 26.30 can be a Good Support level

PRLPRL displays a promising bullish pattern characterized by the break out from its trend line and establishing Cup & Handle pattern. Our plan entails accumulating the stock within the designated buy zone (27-28 range), while setting stop loss orders below 26. To guide our trading decisions, we've delineated two distinct targets: an immediate target around 32 upon sustaining above 30 and a final target for exiting the trade will be around 34

PRL - 1D - Long Position - Cup & HandleIn this chart we have observed a cup & handle formation in a one day time frame and no divergence is spotted.

PRL (ANALYSIS) 📉 Market Analysis 📊
PRL Analysis:
Current Situation:
PRL is expected to fall after reaching 30.8 and retrace to form a higher low (HL).
RSI is below 70 on the daily chart.
Bollinger Bands are contracting on the weekly chart, indicating a potential reversal.
Trade Recommendation:
Action: Sell at current rates until 30.8.
Strategy: Look for opportunities to re-enter after the retracement and formation of a higher low.
Stay vigilant! 📉💼
