PSO - PSX - SWING Trade CallOn daily TF, PSO has broken the falling wedge and now is moving upwards.
Only likely resistance zone is close to previous all-time high.
AB=CD Harmonic pattern has been drawn. KVO is moving upwards indicating bull run with RSI also testing 60.
It is a good opportunity for getting into the SWING trade now spanning over around three months.
Trade Values
Buy-1: 396
Buy-2: 375
SL: 320
TP-1: 446
TP-2: 629
PSO trade ideas

PSOBullish on PSO as because of the bullish flag is formed and broken and price went for its second leg also a resistance is broken!
Price can go near 580 to 600

PSO Showing Strong Signs of Trend Reversal Pakistan State Oil (PSO) appears to be shifting its market structure after a prolonged correction. The most notable signal is that no new lower low was formed, and the previous lower high has been decisively broken, indicating a potential trend reversal. This breakout is backed by a significant rise in volume, suggesting that smart money might be entering the stock. Additionally, RSI has crossed above 60, which reflects growing bullish momentum. Based on this setup, a trade plan could involve a first buy zone around 382–385 (breakout confirmation) and a second buy zone at 360–363 (in case of a pullback). A stop loss below 338 keeps risk defined, while targets at 409 and 445 provide a favorable risk-reward ratio. All key indicators—market structure, volume, and momentum—are aligning to support a potential upward move in PSO. Keep this on your radar, as this could be the beginning of a strong bullish cycle.

PSOPSO Analysis
Bullish Flag formed in daily time frame
No any negative sign showing in daily/weekly/monthly time frames

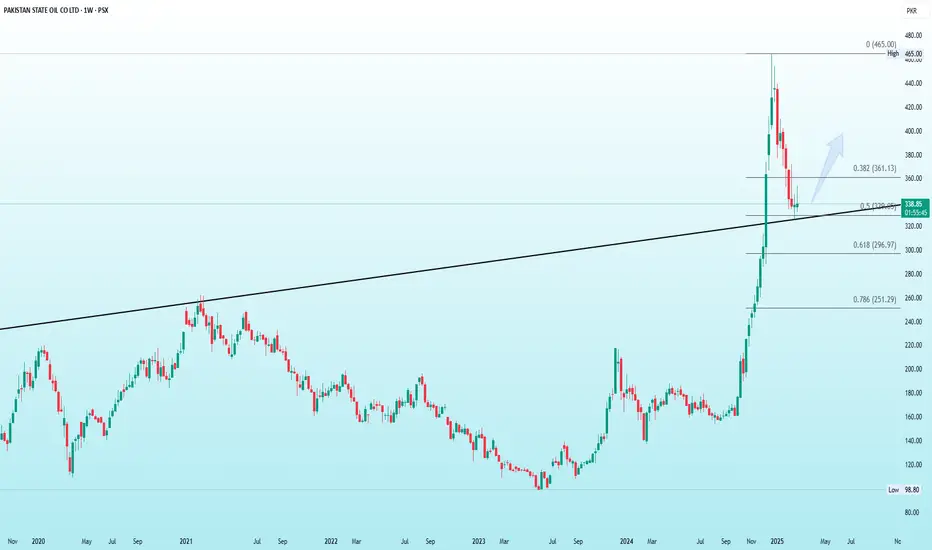
PSO at a Critical Juncture: Uptrend Continuation or Deeper Pull?PSO shows a strong uptrend followed by a significant pullback from its recent peak of 465. The price has retraced to 338, aligning with key Fibonacci levels, with 361 (0.382) acting as resistance and 322 (0.5) providing support near a long-term trendline. Holding above this trendline could signal a continuation of the uptrend, while a break below 322 may lead to further downside towards 296 (0.618 retracement) or even 251 (0.786 retracement). A bullish recovery would require reclaiming 361, while failure to hold support levels could extend the correction. Overall, the trend remains bullish in the long run if the price stays above key support zones.
PSO could drop todayPSO is cross below my created indicator may be it drop below to 340 and 340. Wait for it to entre bullish zone.
Note: This is not a buy sell call, trade at your own will and use stop loss.


PSO at 50% Retracement - Buy OpportunityPSO is currently trading at a 50% retracement level of its ongoing bullish leg. This presents a strong buying opportunity, with the target set at the recent top.

LongIt should not break 334.
upside targets are around 390 & then above 400.
If 465 is Crossed & Sustained, we may witness 600+

PSO, 1HCan be buy at current price looking good.
This analysis is for informational purposes only and should not be considered investment advice. Always conduct your own research and consult with a financial professional before making any investment decisions.

Though Bullish on Bigger Time Frames but..Though Bullish on Bigger Time Frames but it has Started making LH LLs on Daily TF.
Currently at Important Support level.
Bullish Divergence has appeared that should give it a Bounce.
If 345 is Sustained, we may witness slight upside may be around 375 - 385.
If 391 is Crossed with Good Volumes & Weekly closing is above this level, we may
see it touching 415 - 420 which is again an Important Resistance level.
However, if 345 is broken, 320 - 325 is a level that can be touched in worst case where
Bearish ABCD pattern target will be touched.

PSO OPERTUNITIESKey Observations:
Price Levels and Support/Resistance:
Current Price: The price is currently at 379.01 PKR.
Support Levels:
Major support is visible at 375.42 PKR, marked in blue.
Below that, there’s another potential zone near 372 PKR.
Resistance Levels:
Key resistance appears around 382.77 PKR.
Another significant resistance lies at 389.67 PKR, with the next level at 403.95 PKR.
Moving Averages:
The chart features two moving averages:
Green (Longer-term MA, possibly 200-period): Indicates a downward trend as the price is below this moving average.
Orange (Shorter-term MA, possibly 21-period): This MA shows a more reactive trend but is currently sloping downward, suggesting short-term bearishness.
Indicators and Tools:
LuxAlgo Patterns: The chart includes LuxAlgo's supply and demand zones:
A highlighted demand zone (red shaded region) suggests buyers' interest around 372 PKR.
The supply zone above 389 PKR shows selling pressure in that region.
Volume: Increasing volume spikes during drops indicate selling pressure.
Overall Trend:
The price has been in a downtrend, indicated by lower highs and lower lows.
However, recent price action near support levels shows potential consolidation.

PSO: An opportunity to have a quick Profit.After a marathon rally up to 465 the security made a retracement to the fib. level of 0.5 and now it has the shown the signs of reversal.
Such are the good opportunity to make quick money. All the parameters of trade i.e. entry, SL and TP has been marked on the chart. You may trade accordingly.
Pl do tell me your opinion as learning is both ways.

PSO - PSX - Price action, GANN, Fib, RSI and KVO based analysisPSO on Daily TF has been retracing quite a bit. Right now price has just bounced back from Price Action Support Zone. A detailed GANN based analysis supported by Fib retracement, RSI and KVO has been performed.
Trade Values
Buy-1: 408
Buy-2: 342
Buy-3: 322
SL: 272

PSO - 17% Quick Gainimmediate entry can be taken with SL around 377 for first TP of 453 and second TP of 491

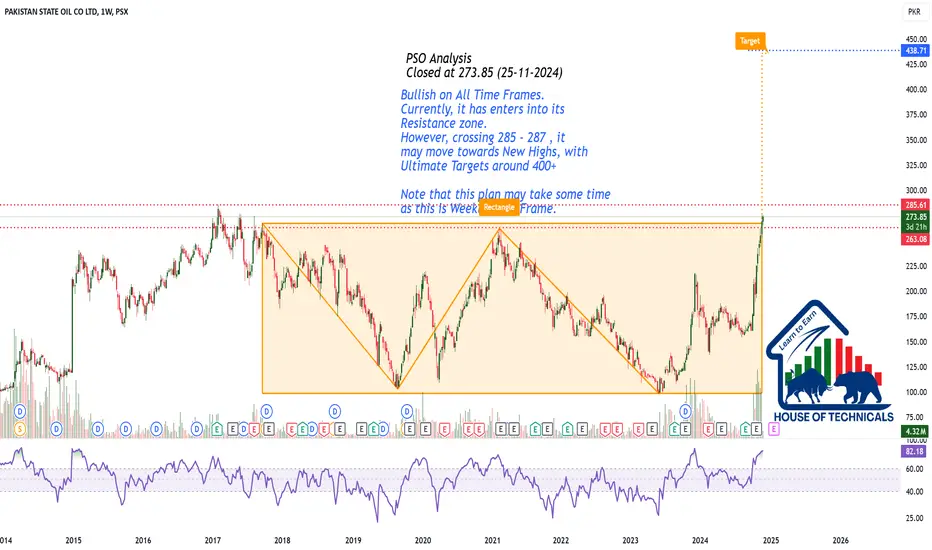
Bullish on All Time Frames.Bullish on All Time Frames.
Currently, it has enters into its
Resistance zone.
However, crossing 285 - 287 , it
may move towards New Highs, with
Ultimate Targets around 400+
Note that this plan may take some time
as this is Weekly Time Frame.
All Targets achieved on PSO!PSO Call was initiated on 25 Oct'24 at the breakout of 225, however, could not be published due to unpaid account.
78% gains as per the projections have been achieved within 2 months.
Swing traders should close their trades here, however, those wish to ride the trend can still hold it with Stop loss at 288

PSO - KSE100 - end of bullish trend?PSO is currently in a bullish trend and has completed an AB=CD pattern. The price is now testing a weekly resistance zone of 259-268, suggesting a potential healthy retracement in the near term.
The next favorable buying zone is anticipated around 210-220. For current buyers or holders, a stop-loss at 245 is recommended to manage risk.

Bearish Divergence on PSOA bearish divergence is appearing on the PSO Daily time frame which is indicating a price correction


Favoring BullsNegative Point: Bearish Divergence on Daily TF
Bullish Points:
Morning Star Formation on Daily TF.
Bullish on All Time Frames
Sustaining above Strong Resistance area (218 - 219);
this may act as Support now.
Immediate Resistance area : 249 - 260
Immediate Support area : 217 - 221
We may witness 290+ if 270 - 275 is Crossed

PSX:PSO ABCD Pattern CompleteABCD Pattern Complete
Divergence on RSI
Can retrace reached PRZ
Can retrace to 216-222 Range on Fib
