PTCL Technical Setup: Bullish with CautionCurrent Price: PKR 37.16 (+2.96%)
Volume: 13.08M (elevated)
Pattern Analysis
Rising Channel (Primary Pattern)
Structure: Well-defined ascending channel since late 2023
Current Position: Price at upper channel boundary (~37-39 zone)
Channel Support: Lower trendline around 31-32 PKR
Status: Testing resistance at channel top
Key Observations
Positives:
Clean uptrend structure maintained throughout 2024-2025
Price respecting channel boundaries consistently
Recent volume spike (13.08M) showing buying interest
Multiple successful bounces from lower channel line
Concerns:
Currently at upper channel resistance (overbought zone)
Price has been rejected at this level before (see Oct 2025 peak)
Extended move from support without pullback
Critical Levels
Immediate Resistance:
37-39 PKR - Current upper channel boundary (testing now)
40 PKR - Psychological level and channel breakout
Support Zones:
35 PKR - Recent consolidation/immediate support
32-33 PKR - Mid-channel support
31 PKR - Lower channel boundary (key support)
Scenarios & Targets
Bullish Scenario (Channel Breakout)
IF breaks above 39 PKR with volume:
Target 1: 42-43 PKR
Target 2: 45+ PKR (channel projection)
Neutral/Pullback Scenario (More Likely)
Expected behavior at channel top:
Pullback to 35 PKR (minor retracement)
Deeper correction to 32-33 PKR (healthy pullback)
Both would offer better risk-reward entries
Risk Assessment
⚠️ Current Risk Level: MODERATE-HIGH
Why Caution:
At channel resistance, not support
Limited upside room before hitting resistance
Poor risk-reward at current levels (3-4% upside vs 15-20% downside to channel support)
Trading Strategy
For New Entries - WAIT
❌ Not recommended at current levels
Price extended at channel top
Better to wait for pullback
Preferred Entry Zones:
35 PKR - Minor dip (aggressive)
32-33 PKR - Mid-channel (ideal)
31 PKR - Lower channel (conservative)
For Existing Holders
✓ Consider partial profit booking at 37-38 PKR
✓ Hold with stop loss at 35 PKR (if expecting breakout)
✓ Full exit if closes below 35 PKR
Breakout Play (Advanced)
Entry: Only if daily close > 39 PKR with volume > 15M
Stop: 37 PKR
Target: 43-45 PKR
Bottom Line
Rating: ⭐⭐⭐ (Neutral at Current Levels)
PTC is in a healthy uptrend but currently overextended at channel resistance. While the long-term structure remains bullish, the risk-reward favors waiting for a pullback rather than chasing at these levels.
Best Approach: Monitor for either a clean breakout above 39 PKR OR a healthy pullback to 32-35 PKR for better entry opportunity.
Key Level to Watch: 35 PKR support - holding this keeps bullish structure intact.
Trade ideas

PTC AT GOOD LEVELS FOR RIDING THE BULLSThe script PTC is at attractive levels for riding the Bull Run as the company is fundamentally looking good and technicals are also supporting the bullish move as a long awaited consolidation has ended and the script has broken the accumulation box with good volumes.
So Ride the trend and have good profits....
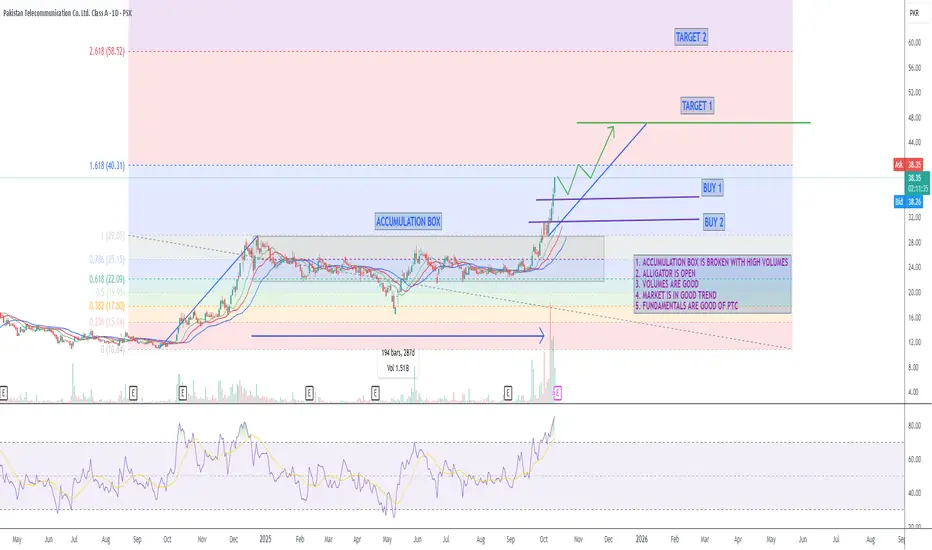
PTC – TECHNICAL BUY CALL | 22 Sept 2025 (1H TF)PTC – TECHNICAL BUY CALL | 22 Sept 2025 (1H TF)
The stock was in a Wyckoff re-accumulation phase and has now broken out, constructing two bullish structures. With this confirmation, the stock is expected to continue its upward move and achieve multiple bullish targets.


Ptc could drop more Ptc completed its Bullish Elliott wave now it is in bearish Elliott wave and it completed its 4th step and heading to 5th step and it could drops more.
Note: This is not a buy or sell call. Use stop loss.

PTC for 17% gainsPTC can be traded for over 17% gains. The stock has completed its completed its 38% retracement and now about to make another Higher High
Daily Closing is required above 28.51, thereafter first resistance is 28.88, once the stock sustains above that level. Trade can be entered into with Stop loss level of 23 for a Target Price of 34.08
Crossing 28.51 will trigger the classic ABCD pattern, final projection will be around 34.88 which could be the PRZ

PTC - PSX - Technical AnalysisPTC is in a sharp bull run.
On Daily TF, after making a CUP& HANDLE pattern it is going upwards towards TP-1. Since there is no sign of divergence on RSI, therefore, instant buy can be initiated. On reaching TP-1 one must see the RSI indicator for any retracement sign, if no such sign present then continue riding the trend. On other hand on retracement, a new Buy can be initiated. Already defined Higher Low will be the Stop Loss.
Trade Call
Buy-1 (Mkt): 24.57
TP1: 26.52
SL : 18.82
Buy-2: 22.94
TP: 32.48
SL: 18.82

PTC - PSX - Technical AnalysisPTC - Analysis
Since June 2024 price is moving in sideways channel.
Presently, on Daily TF, price has crossed Bollinger Band's upper band line. Therefore, price is likely to come down. Remember the central line of BB acts as a magnet and price always tries to catch up with it.
On RSI 70 value indicates that bullish momentum is ON without any divergence. Therefore, price may test 14.00. But for going into bull run price must cross 15 which was previous Lower High.
Therefore, buying should not be carried out till its price touches 15.

PSX - PTC - Bullish Trendhe current market is showing a strong uptrend characterized by a series of higher highs and higher lows, indicating robust bullish momentum. There is no divergence present, suggesting that the trend remains intact. However, today’s volume appears light, which may signal a lack of strong conviction behind the rally.
Traders should be cautious as light volumes can make the trend more susceptible to pullbacks. It’s essential to monitor changes in volume patterns moving forward. A significant increase in volume supporting the uptrend would be a positive sign, while a pullback on light volume may indicate a potential consolidation phase.


PTC | Bullish TrendThe price action is in uptrend making higher highs and higher lows and currently trading above 100 day EMA. Initial resistance lies around 14.40 and secondary resistance lies around 16.20, upon breaching these levels the stock has potential to make more higher highs. Use stop loss below 12.50 to manage risk.

PTC is BullishPrice was in a strong downtrend, however bullish divergence emerged on daily time frame, which was followed by the break of last lower high. First higher high is printed and if that is broken we can expect a bullish rally according to Dow theory. Targets are mentioned on the chart.


PTC - BULLISH FLAGPTC HAS FORMED A BULLISH FLAG PATTERN, bullish move is expected in coming days, long entry recommended in PTC.

Trade Carefully11.40 - 13.40 is an Important Support Zone
also Golden Pocket of recent rally
No Bearish Divergence on Bigger TF yet
However, one bearish Weekly candle may create
a Bearish Divergence

PTC in Bearish TrendPTC was trending Bullish trend in 1Day time frame, was printing Higher hig and Higher lows but now it shows trend reversal as sellers are in contraoll.

HH HL on HourlyIt has started making HH HL on Hourly TF
Seems like taking Support from Trendline Support
level

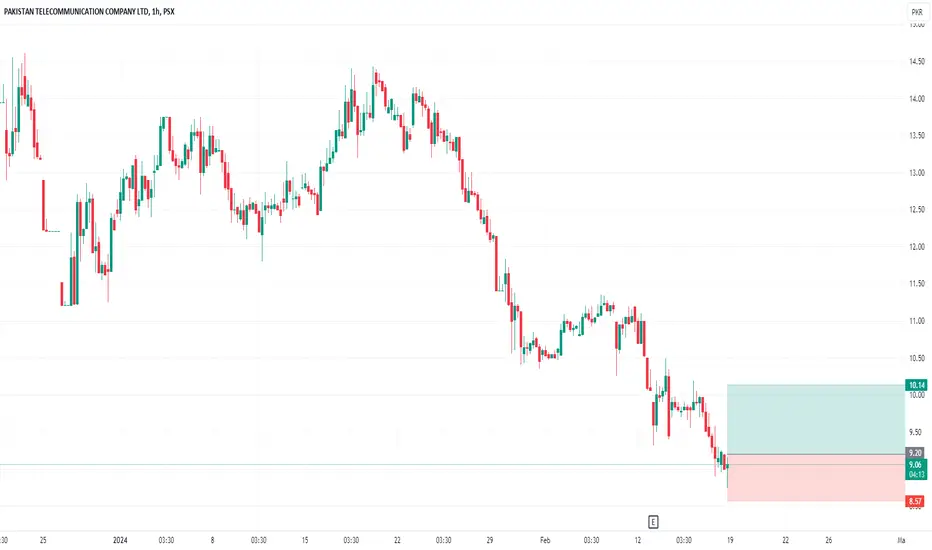
PTC🚀 Stock Alert: PTC
📈 Investment View: Technically Bullish 📈
🔍 Quick Info:
📈 Entry Range: 9.10 - 9.20
🎯 Target : 10.14
⚠ Stop Loss: 8.57
⏳ Nature of Trade: Short Term
📉 Risk Level: Medium
☪ Shariah Compliant: NO
💰 Dividend Paying: NO
PTC:PSX Bullish reversal observedPTC:PSX was in consolidation since Dec 22. However, it has formed a bullish divergence on 1D timeframe in conjunction with forming a double bottom pattern pattern. On last working that that is 13 Oct 23, it has also made a bullish engulfing candle, triggering our target entry levels. SL and TP have been marked on chart. This analysis also holds confluence with 1W timeframe.
