SSGC – Technical View (Daily Timeframe)
SSGC has taken a strong bounce from a multi-time tested ascending channel support, which is a positive technical sign. This level has acted as a strong demand zone in the past, and once again buyers have successfully defended the support.
Today’s volume remained decent, indicating that the move is
Sui Southern Gas Co. Ltd.
No trades
−1.10 PKR
3.44 B PKR
446.44 B PKR
348.57 M
About Sui Southern Gas Co. Ltd.
Sector
Industry
CEO
Muhammad Amin Rajput
Website
Headquarters
Karachi
Founded
1989
IPO date
May 25, 1994
Identifiers
2
ISIN PK0002801014
Sui Southern Gas Co. Ltd. engages in the business of transmission and distribution of natural gas. It operates through the Gas Transmission and Distribution; and Meter Manufacturing segments. The Gas Transmission and Distribution segment refers to the transmission and distribution of natural gas and construction contract for laying of pipelines in Sindh and Balochistan. The Meter Manufacturing segment manufactures and sells gas meters. The company was founded on March 30, 1989 and is headquartered in Karachi, Pakistan.
Related stocks

Stuck in SSGC?Immediate Resistance: 37.25
Targets: 38.34 | 39.5 | 41.38
Strong Bullish Starts - 43-46-50
• Financial Turnaround: Successfully cleared negative equity; now reporting consistent profits.
• UFG Reduction: Line losses (UFG) dropped from 17% to ~10.6%, saving billions in gas.
• Asset Expansion: Massi

Beautiful Bullish Divergence on shorter tf but...SSGC Analysis
CMP 34.55 (24-12-2025)
Beautiful Bullish Divergence on shorter tf.
Channel bottom is around 29 - 30
Couple of Bullish Candles at current level may
take the price upside but the bullish trend will only
resume if we witness the breakout of the
rectangular channel with resistance around

SSGC PSX Chart AnalysisStop Loss: 31.02 PKR
Buy Stop: 42.63 PKR
Take Profit: 54.07 PKR
After an extended bearish trend, the price has broken out of its previous pattern and initiated a bullish reversal. A Buy Stop is placed at 42.63 PKR to enter the market as momentum confirms the upward move. The projected target for th

Bullish on Bigger tf.SSGC Analysis
CMP 39.26 (28-11-2025 03:20PM)
Bullish on Bigger tf.
Bullish Divergence may lead the price
further up.
Immediate Resistance is around 44 - 45
Crossing & Sustaining 47 may lead it towards 60.
However, now breaking 28 will bring more selling
pressure.

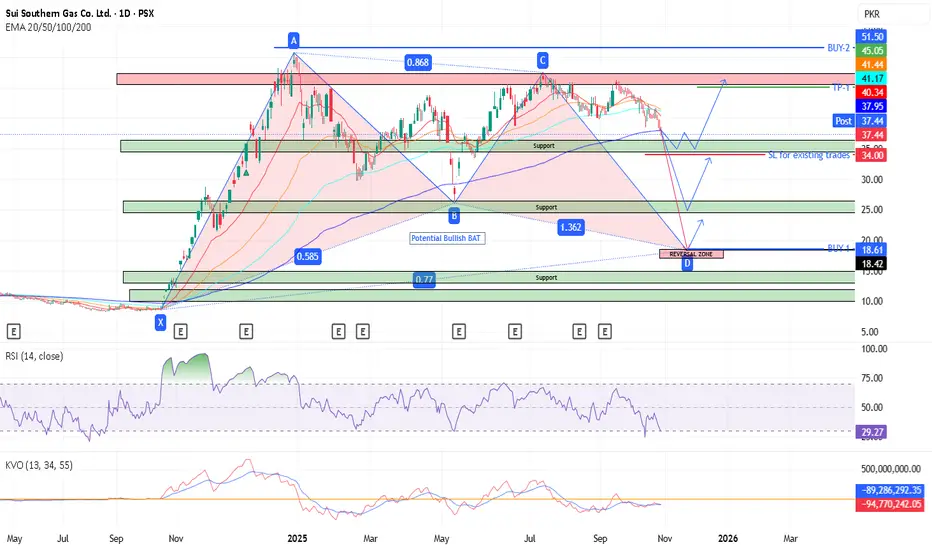
SSGC - PSX - Technical AnalysisOn daily TF, SSGC - Price has gone even below EMA200 line which is giving hint of very strong Selling Pressure. CMP is 37.44 on 29-Oct-2025.
A potential BAT harmonic pattern has been drawn. If price action follows it then price may drop significantly to 17~19 zone. However, there are two support zo
SSGC - Long - PSXSSGC looking good. Final target can be around 57. Unable to break the consolidation box for a long time now.

SSGC – BUY SIGNAL | 01 AUGUST 2025SSGC – BUY SIGNAL | 01 AUGUST 2025
The stock recently broke out of a bearish channel (marked light pink) and made a high of Rs. 47.41. Since the breakout, it has been undergoing a lateral pullback, which now appears to be complete based on the volumetric profile and recent price action. With momentu

SSGC DTFIndicators are showing weakness but one indicator is indicating that slow and gradual accumulation is going on and the Scrip can take a turn towards the upside. Keep fingers crossed and place on watchlist to track movement.

SSGC DAILY CHART BUYING OPPORTUNITY41.50 is a good price to buy SSGC. This analysis is sharing for educational purpose only.
See all ideas
Summarizing what the indicators are suggesting.
Oscillators
Neutral
SellBuy
Strong sellStrong buy
Strong sellSellNeutralBuyStrong buy
Oscillators
Neutral
SellBuy
Strong sellStrong buy
Strong sellSellNeutralBuyStrong buy
Summary
Neutral
SellBuy
Strong sellStrong buy
Strong sellSellNeutralBuyStrong buy
Summary
Neutral
SellBuy
Strong sellStrong buy
Strong sellSellNeutralBuyStrong buy
Summary
Neutral
SellBuy
Strong sellStrong buy
Strong sellSellNeutralBuyStrong buy
Moving Averages
Neutral
SellBuy
Strong sellStrong buy
Strong sellSellNeutralBuyStrong buy
Moving Averages
Neutral
SellBuy
Strong sellStrong buy
Strong sellSellNeutralBuyStrong buy
Displays a symbol's price movements over previous years to identify recurring trends.
Frequently Asked Questions
The current price of SSGC is 32.54 PKR — it has decreased by −1.05% in the past 24 hours. Watch Sui Southern Gas Co. Ltd. stock price performance more closely on the chart.
Depending on the exchange, the stock ticker may vary. For instance, on PSX exchange Sui Southern Gas Co. Ltd. stocks are traded under the ticker SSGC.
SSGC stock has fallen by −2.91% compared to the previous week, the month change is a −7.82% fall, over the last year Sui Southern Gas Co. Ltd. has showed a −10.85% decrease.
SSGC reached its all-time high on Aug 3, 2015 with the price of 55.74 PKR, and its all-time low was 8.22 PKR and was reached on May 23, 2022. View more price dynamics on SSGC chart.
See other stocks reaching their highest and lowest prices.
See other stocks reaching their highest and lowest prices.
SSGC stock is 3.75% volatile and has beta coefficient of 1.82. Track Sui Southern Gas Co. Ltd. stock price on the chart and check out the list of the most volatile stocks — is Sui Southern Gas Co. Ltd. there?
Today Sui Southern Gas Co. Ltd. has the market capitalization of 29.07 B, it has decreased by −1.04% over the last week.
Yes, you can track Sui Southern Gas Co. Ltd. financials in yearly and quarterly reports right on TradingView.
SSGC net income for the last quarter is 785.12 M PKR, while the quarter before that showed −4.05 B PKR of net income which accounts for 119.38% change. Track more Sui Southern Gas Co. Ltd. financial stats to get the full picture.
Yes, SSGC dividends are paid annually. The last dividend per share was 0.50 PKR. As of today, Dividend Yield (TTM)% is 1.52%. Tracking Sui Southern Gas Co. Ltd. dividends might help you take more informed decisions.
Sui Southern Gas Co. Ltd. dividend yield was 1.17% in 2025, and payout ratio reached 12.80%. The year before the numbers were 0.00% and 0.00% correspondingly. See high-dividend stocks and find more opportunities for your portfolio.
As of Feb 12, 2026, the company has 6.4 K employees. See our rating of the largest employees — is Sui Southern Gas Co. Ltd. on this list?
EBITDA measures a company's operating performance, its growth signifies an improvement in the efficiency of a company. Sui Southern Gas Co. Ltd. EBITDA is 3.68 B PKR, and current EBITDA margin is 2.23%. See more stats in Sui Southern Gas Co. Ltd. financial statements.
Like other stocks, SSGC shares are traded on stock exchanges, e.g. Nasdaq, Nyse, Euronext, and the easiest way to buy them is through an online stock broker. To do this, you need to open an account and follow a broker's procedures, then start trading. You can trade Sui Southern Gas Co. Ltd. stock right from TradingView charts — choose your broker and connect to your account.
Investing in stocks requires a comprehensive research: you should carefully study all the available data, e.g. company's financials, related news, and its technical analysis. So Sui Southern Gas Co. Ltd. technincal analysis shows the strong sell today, and its 1 week rating is sell. Since market conditions are prone to changes, it's worth looking a bit further into the future — according to the 1 month rating Sui Southern Gas Co. Ltd. stock shows the neutral signal. See more of Sui Southern Gas Co. Ltd. technicals for a more comprehensive analysis.
If you're still not sure, try looking for inspiration in our curated watchlists.
If you're still not sure, try looking for inspiration in our curated watchlists.