SSOM – BUY TRADE | 1H | 29 OCT 2025 | TCA
SSOM – TECH BUY CALL | 1H | 29 OCT 2025 | By The Chart Alchemist
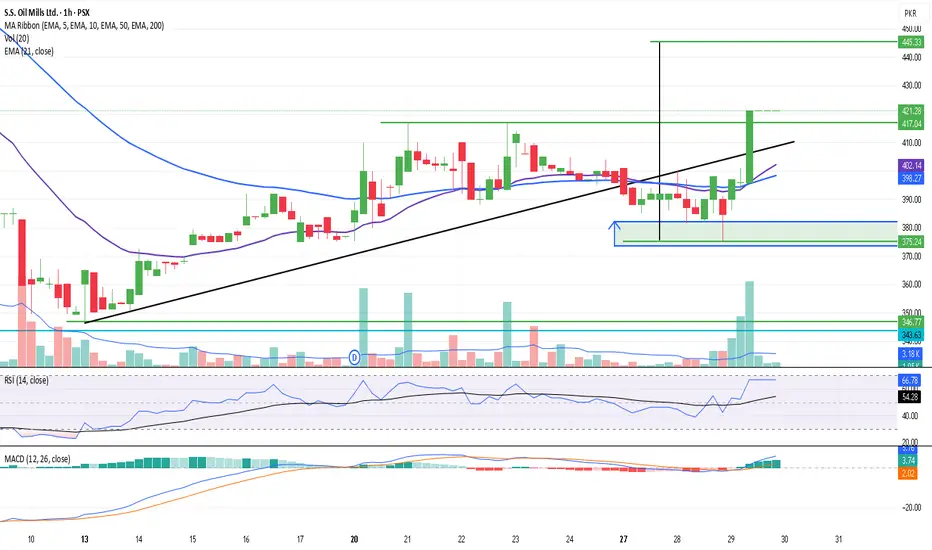
The stock SSOM has been gradually reversing upward within a light blue channel and has developed multiple bullish structures, indicating sustained strength and potential continuation toward higher targets.
📢 Technical Analysis by Mushtaque Muhammad (The Chart Alchemist).
Trade ideas

Technical Analysis and Swing Trade Setup for SSOM 1-Hour Time Frame
Technical Overview
EMA 21 crossover EMA 50: Bullish crossover confirming short-term upside momentum.
Fibonacci Retracement: Price rebounded from the 0.618 golden zone, indicating a strong continuation setup.
MACD: Bullish crossover above the signal line — momentum shifting positive.
RSI: Trending upward around 66–70, still below overbought — supports further upside.
Volume: Noticeable increase on the breakout, confirming buying strength.
Swing Trade Plan
Buy Entry: Current market price ≈ PKR 376–378
Target Price (TP): PKR 445
Stop Loss (SL): PKR 372 (below recent swing-low and 0.618 retracement zone)
Risk-Reward Ratio: ~1 : 3 (good swing setup)
Trade Summary
Trend: Bullish short-term continuation
Pattern: EMA crossover + Fibonacci retracement rebound
Indicators: RSI and MACD both showing bullish signals
Confirmation: Volume breakout adds strength to the move

SSOM LONG TRADE 17-06-2025SSOM Long Trade
Rationale: SSOM previously surged from Rs. 87 to Rs. 900 (over 10x gain) from mid-March to mid-May. Despite recent correction/consolidation, price action suggests potential for further upside.
🚨 TECHNICAL BUY CALL – SSOM🚨
- Buy 1: Current level (Rs. 775)
- Buy 2: Rs. 782
- Buy 3: Rs. 762
- TP 1: Rs. 830
- TP 2: Rs. 880
- TP 3: Rs. 922
- TP 4: Rs. 970
Stop Loss - Below Rs. 725
Risk-Reward Ratio - 1: 4.83
Caution: Close at least 50% position size at TP1 and then trail SL to avoid losing incurred profits in case of unforeseen market conditions.
PLEASE BOOST AND SHARE THE IDEA IF YOU FIND IT HELPFUL.

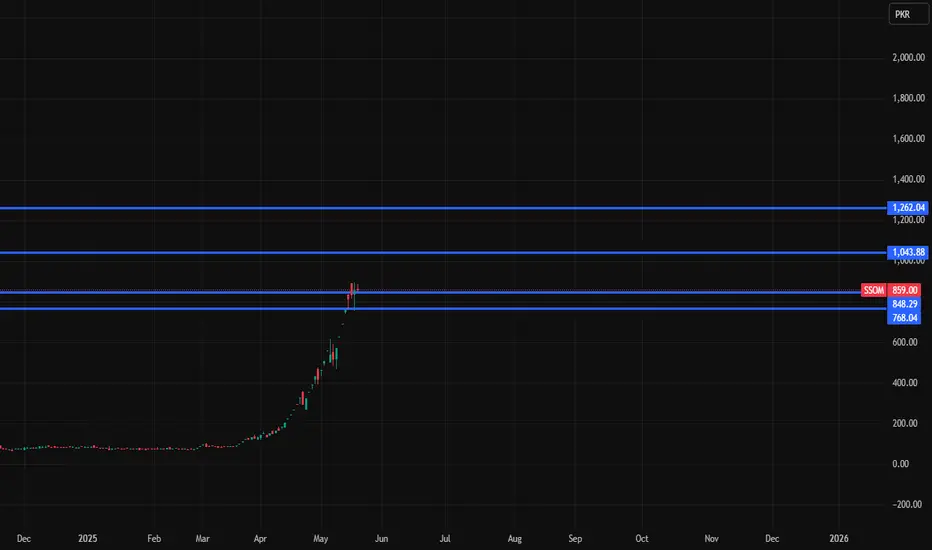
SSOM key levelsKey levels for SSOM are 768, 848, 1043 and 1262. May be after crossing 1262 it could move to 2000 and above levels.