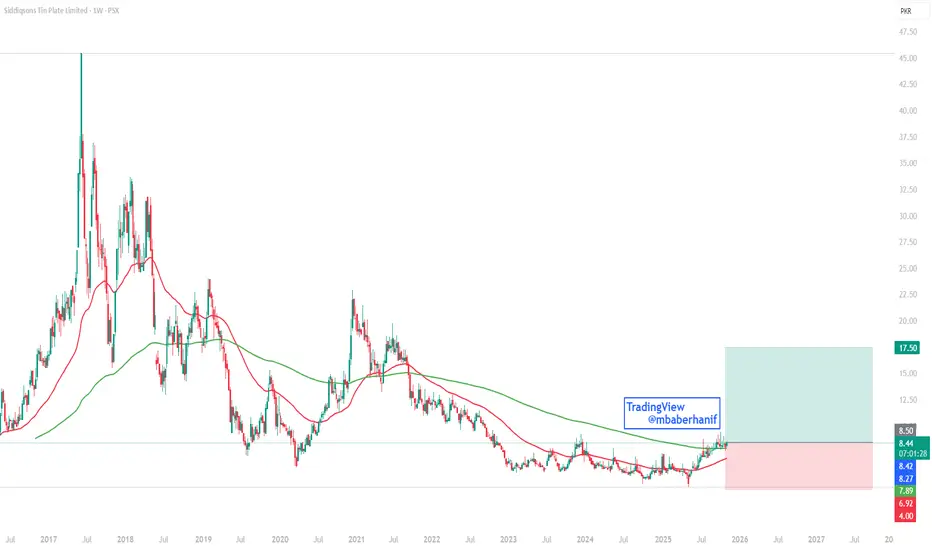
Stock Alert – STPLSTPL is consolidating after a strong rally. Volume spike and price structure suggest strong buying interest 📈. If momentum continues, STPL looks poised for another leg higher!
🎯 Targets: 10.18 / 11.90 / 13.63 / 15.36 / 17.50
🛑 Stop-Loss: 4 (risk management first!)
This setup shows healthy retracement and potential breakout — STPL is gearing up for upside momentum! 🚀✨
Trade ideas
STPL Technical Analysis (Pakistan Stock Exchange)STPL Technical Analysis (Pakistan Stock Exchange)
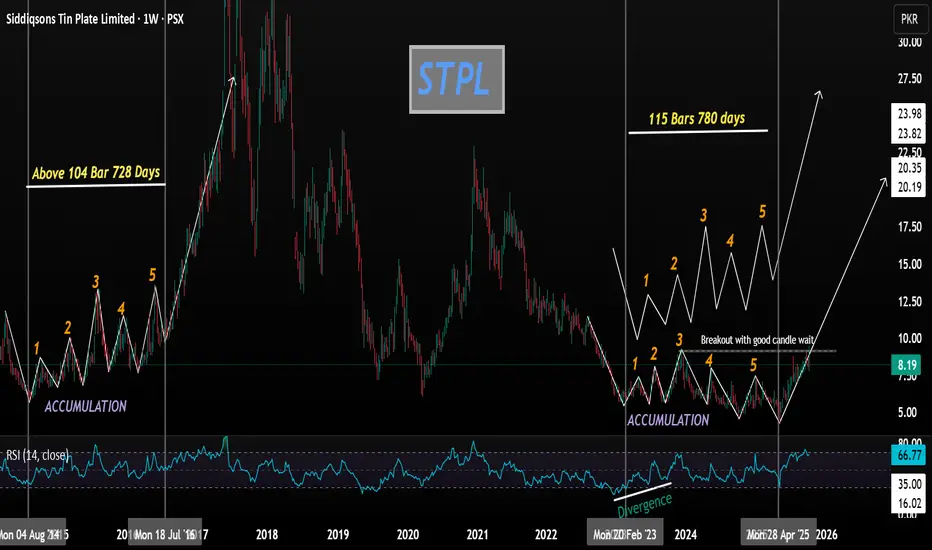
Based on a thorough analysis of STPL's time cycles and price structure, the stock exhibits a pattern similar to the one observed between 2014 and 2016. During that period, STPL spent significant time forming a structured five-point pattern (1, 2, 3, 4, 5), where point 3 marked a key high that eventually broke out, reaching a peak of 40.
Currently, the stock is forming an almost identical pattern, again showing a clear five-point structure (1, 2, 3, 4, 5), with point 3 acting as a crucial high—mirroring the previous cycle.
The key resistance at 9.3 (corresponding to the previous point 3 high) was recently tested, and the price touched 9.45 with significant volume on the last weak candle. Following this, the price pulled back, creating a potential entry zone. A strong candle formation at this level would confirm a favorable entry opportunity.
Based on this analysis:
First target: 20
Second target: 30
Ultimate target: 40
All indications suggest that the stock is likely to achieve these targets smoothly, following the same cycle and character as the previous accumulation and breakout pattern.
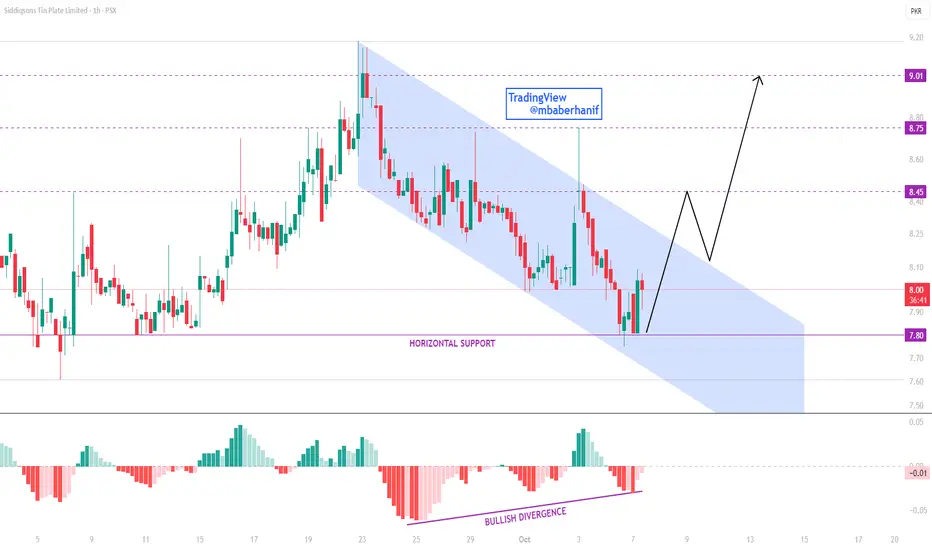
STPL | Bullish Reversal Setup DevelopingSTPL is showing signs of a potential reversal as the price pulls back from the horizontal support around 7.80, simultaneously touching the lower boundary of the descending parallel channel. A bullish divergence is visible on the MACD histogram, indicating that selling momentum is weakening and buyers are likely to regain control.
If the price successfully breaks above the parallel channel, it could trigger the next bullish wave. Upside targets are set at 8.45, 8.75, and 9.01, respectively.

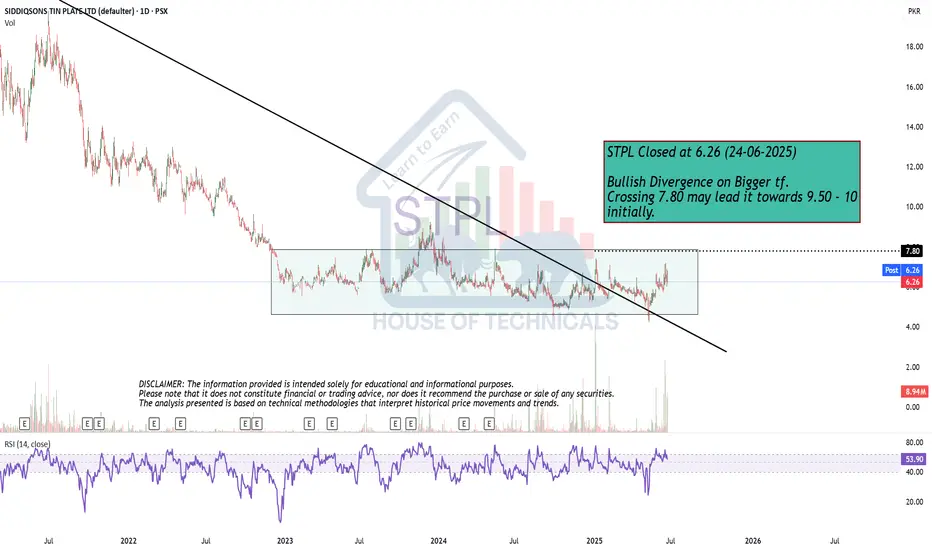
Bullish DivergenceSTPL Closed at 6.26 (24-06-2025)
Bullish Divergence on Bigger tf.
Crossing 7.80 may lead it towards 9.50 - 10
initially.
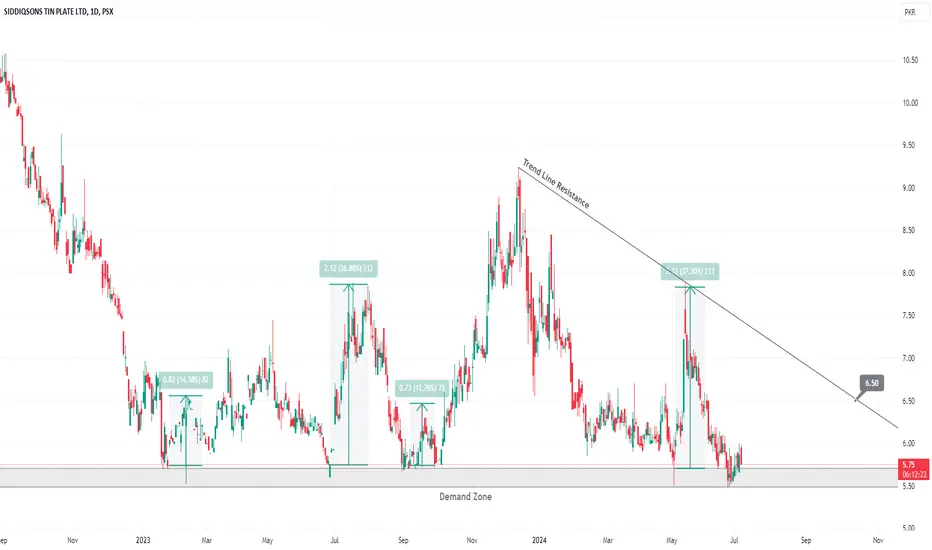
STPLSTPL is moving around its demand zone, multiple pull back from this level had seen before. Long position can be consider around 5.80 for the target of 6.50. Use stop loss around 5.40.
STPL-PSX STPL is in making double bottom pattern with harmonic pattern Buy stop at 7 buy 2 at 6.5 SL : 5.2 TP 7.9

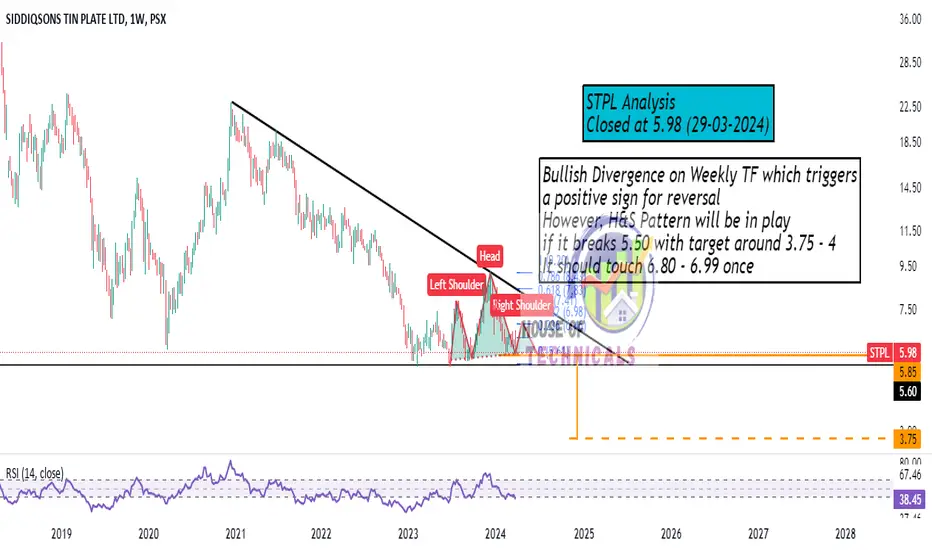
Bullish Divergence on Weekly TFBullish Divergence on Weekly TF which triggers
a positive sign for reversal
However, H&S Pattern will be in play
if it breaks 5.50 with target around 3.75 - 4
It should touch 6.80 - 6.99 once
PSX -STPL OutlookBulls are in control after breaking out the the lash LH with healthy volume. entry recommended upon sustaining on 9.08 with volume. strong potential and growth can be seen on weekly chart
Entry:9.08
StopLoss:7.75
TP1:12.25
TP2:16.15

