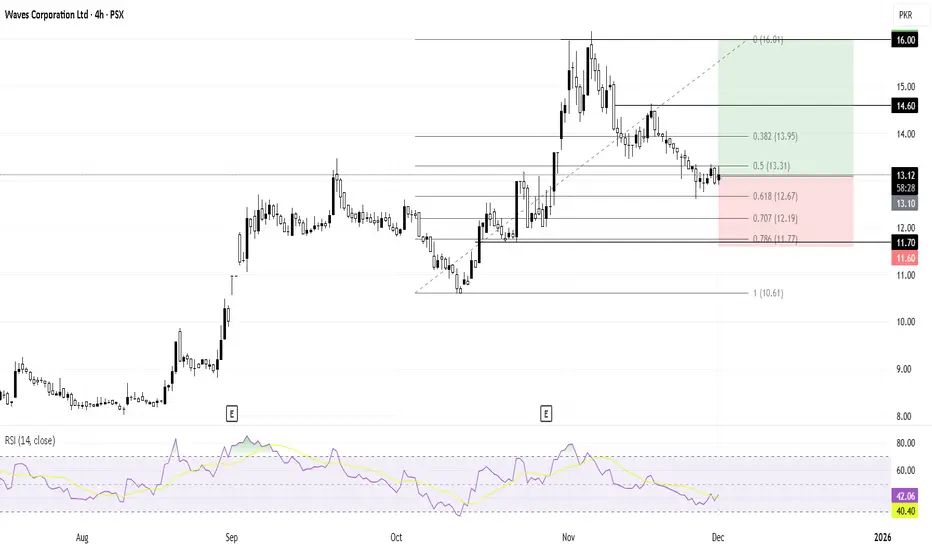
WAVES Golden Ratio Support SetupWAVES has retraced to the 0.618 Fibonacci golden ratio on the daily timeframe, which is considered a strong support area. A buy can be made at the current market price, with a stop loss below the last support and take profit around the previous highs.
Waves Corporation Ltd
No trades
4.11 PKR
1.05 B PKR
3.94 B PKR
About Waves Corporation Ltd
Sector
Industry
CEO
Haroon Ahmad Khan
Website
Headquarters
Lahore
Founded
1877
ISIN
PK0030801010
FIGI
BBG000BKCW71
Waves Corp. Ltd. engages in the business of manufacturing and assembling domestic consumer appliances; and retailing and trading light engineering products. Its products include deep freezers, refrigerators, washing machines, water heaters, air conditioners, and microwave ovens. The company was founded in 1877 and is headquartered in Lahore, Pakistan.
Related stocks
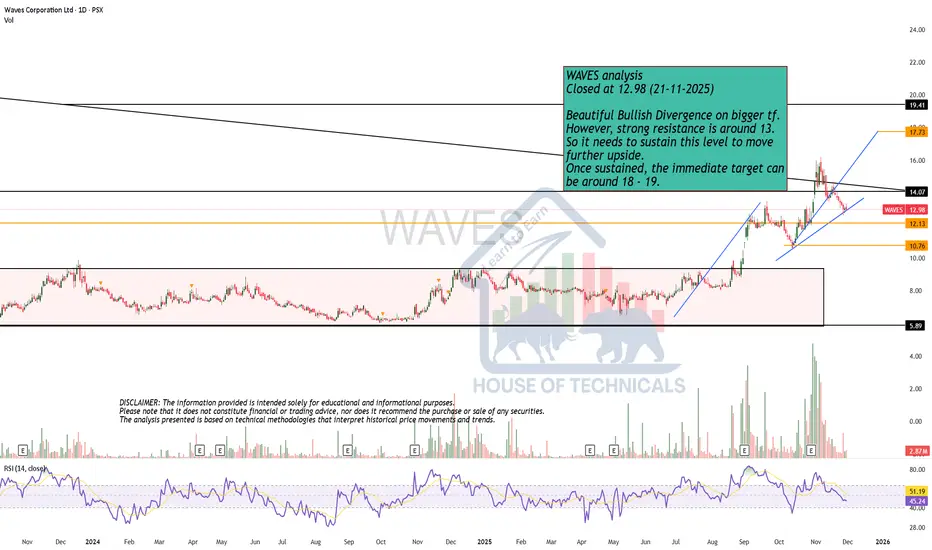
Beautiful Bullish Divergence on bigger tf.WAVES analysis
Closed at 12.98 (21-11-2025)
Beautiful Bullish Divergence on bigger tf.
However, strong resistance is around 13.
So it needs to sustain this level to move
further upside.
Once sustained, the immediate target can
be around 18 - 19.
Technical Analysis - Waves Corporation (PSX)Current Price Action
Current Price: PKR 13.13 (down 0.91%)
The stock is trading near concerning technical levels after a significant decline from recent highs.
Key Technical Observations
Trend Structure
The stock experienced a strong uptrend from August through early November, rallying from around P
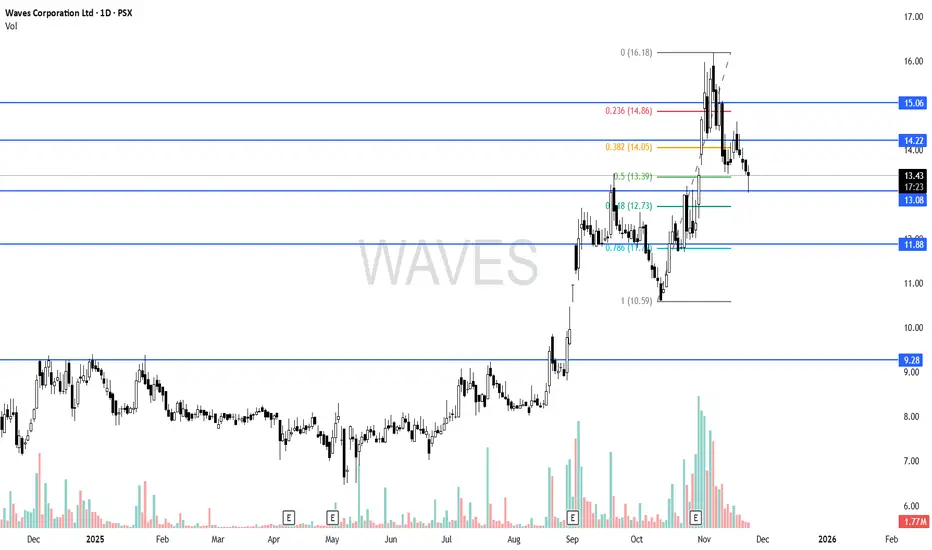
WAVES BUY IDEAWaves has corrected 50% of its recent rally. Right now it is trading in demand zone and long can be attempted here with stoploss of 11.80.
The upside targets are 14.05 and 14.8
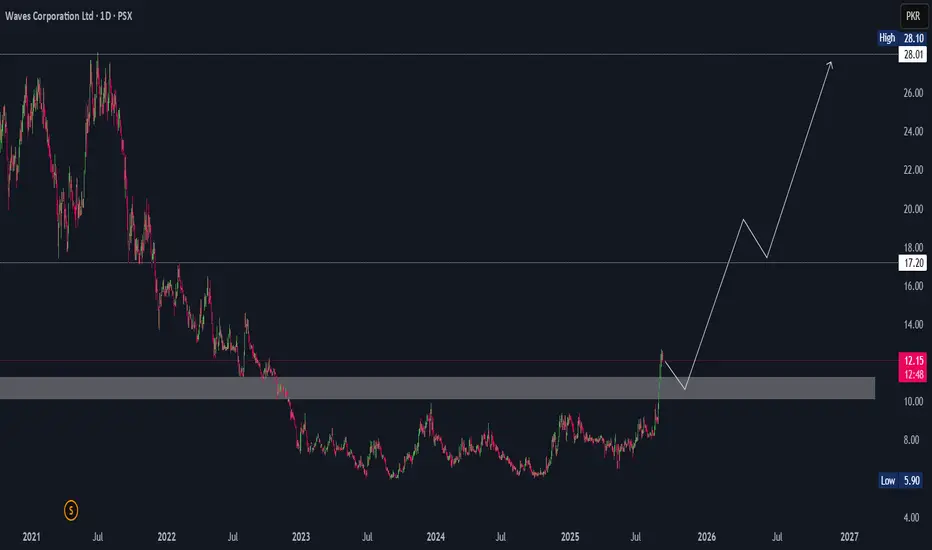
Waves Breakout and Buy Idea !Waves Corporation Ltd (PSX: WAVES) – Long term Technical Setup
Waves has finally broken out of a multi-year accumulation zone after trading sideways since late 2022. The stock has cleared the major supply area around 10–11 PKR, turning that region into a fresh support base.
From here, I expect a h
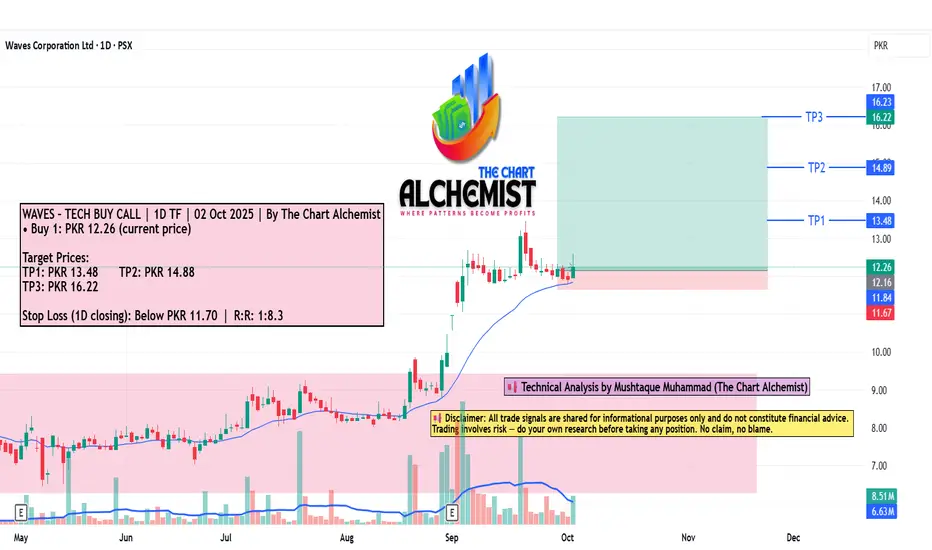
WAVES – TECH BUY CALL | 1D TF | 02 Oct | By The Chart AlchemistWAVES – TECH BUY CALL | 1D TF | 02 Oct 2025 | By The Chart Alchemist
the stock previously accumulated in a trading range (marked with light pink color channel), then broke out in a spike pattern, achieving a high of pkr 13.5. after pulling back, the stock is now forming a db bull flag pattern. we ex
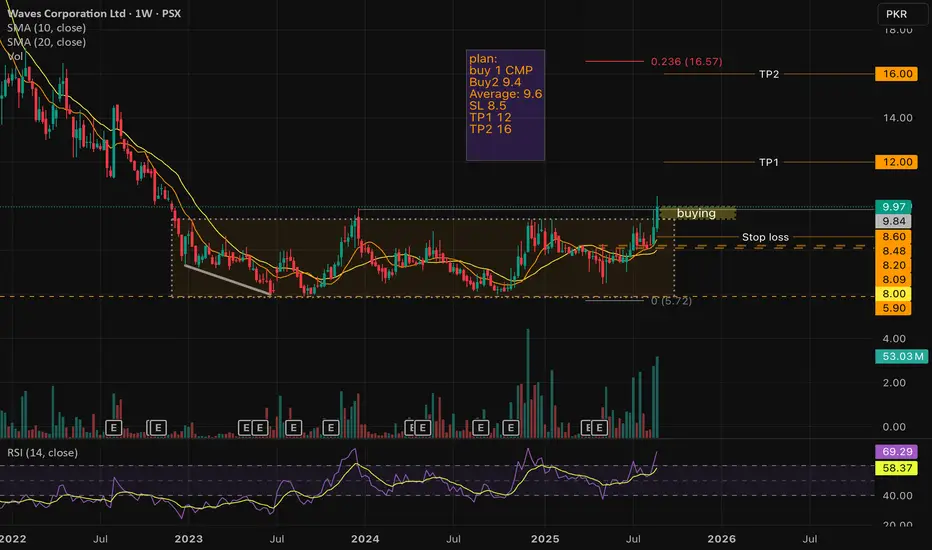
Waves Corporation Ltd (PSX: WAVES) – Weekly Chart BreakoutWaves has finally broken out of a long consolidation zone with strong volume confirmation. Price closed at 9.97 (+10.29%), above both the 10 SMA (8.48) and 20 SMA (8.00).
📌 Trading Plan:
Buy 1: CMP
Buy 2: 9.4
Avg Entry: 9.6
Stop Loss: 8.5
TP1: 12
TP2: 16
📊 Observations:
RSI at 69.29, approaching o
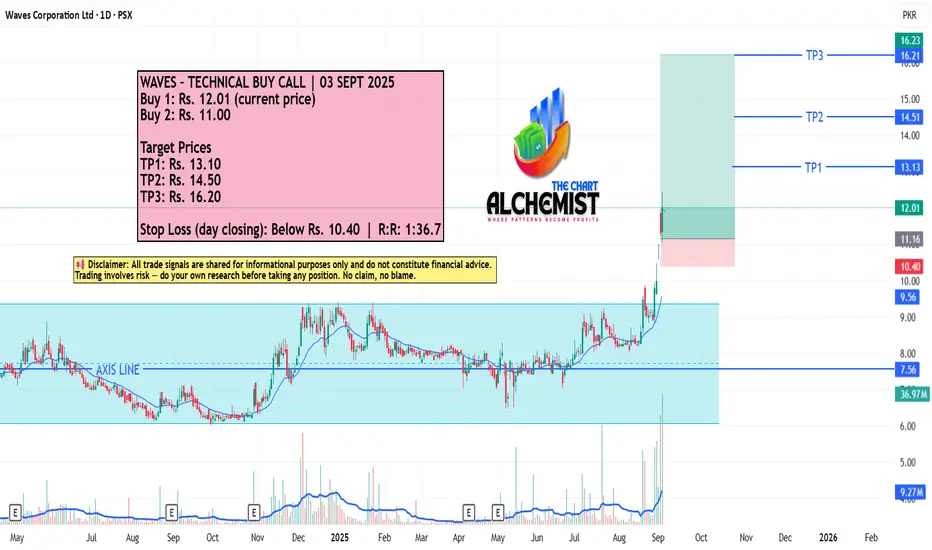
WAVES – TECHNICAL BUY CALL | 03 SEPT 2025 WAVES – TECHNICAL BUY CALL | 03 SEPT 2025
The stock previously broke out of a reaccumulation phase, achieved all targets, and now seems poised for further upside movement.
PSX - WAVES - Long PositionTrend: Bearish
Divergence: Weekly Bullish Divergence
Pattern: Double Bottom
Price borke the Lower High after ranging
Appeared in Volumes today as well
--
Trade Plan:
Entry: CMP
SL: 6
TP: 14

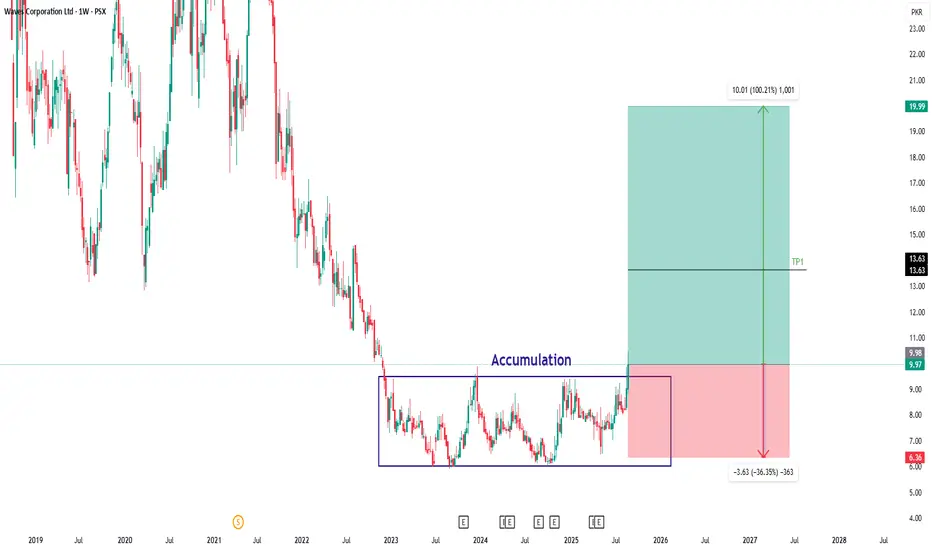
WAVES - KSE100 - Breakout of range?WAVES has successfully broken out of its accumulation zone and closed the weekly candle above the key resistance level, signaling bullish momentum.
Trade Setup:
Entry: On breakout confirmation
Stop Loss (SL): 6.36
Take Profit 1 (TP1): 13.63
Take Profit 2 (TP2): 20
With the breakout and strong wee
See all ideas
Summarizing what the indicators are suggesting.
Oscillators
Neutral
SellBuy
Strong sellStrong buy
Strong sellSellNeutralBuyStrong buy
Oscillators
Neutral
SellBuy
Strong sellStrong buy
Strong sellSellNeutralBuyStrong buy
Summary
Neutral
SellBuy
Strong sellStrong buy
Strong sellSellNeutralBuyStrong buy
Summary
Neutral
SellBuy
Strong sellStrong buy
Strong sellSellNeutralBuyStrong buy
Summary
Neutral
SellBuy
Strong sellStrong buy
Strong sellSellNeutralBuyStrong buy
Moving Averages
Neutral
SellBuy
Strong sellStrong buy
Strong sellSellNeutralBuyStrong buy
Moving Averages
Neutral
SellBuy
Strong sellStrong buy
Strong sellSellNeutralBuyStrong buy
Displays a symbol's price movements over previous years to identify recurring trends.
Frequently Asked Questions
The current price of WAVES is 13.67 PKR — it has increased by 1.24% in the past 24 hours. Watch Waves Corporation Ltd stock price performance more closely on the chart.
Depending on the exchange, the stock ticker may vary. For instance, on PSX exchange Waves Corporation Ltd stocks are traded under the ticker WAVES.
WAVES stock has risen by 4.90% compared to the previous week, the month change is a −4.40% fall, over the last year Waves Corporation Ltd has showed a 51.89% increase.
WAVES reached its all-time high on May 26, 2017 with the price of 54.47 PKR, and its all-time low was 5.90 PKR and was reached on Aug 31, 2023. View more price dynamics on WAVES chart.
See other stocks reaching their highest and lowest prices.
See other stocks reaching their highest and lowest prices.
WAVES stock is 4.35% volatile and has beta coefficient of 0.88. Track Waves Corporation Ltd stock price on the chart and check out the list of the most volatile stocks — is Waves Corporation Ltd there?
Today Waves Corporation Ltd has the market capitalization of 3.87 B, it has increased by 3.42% over the last week.
Yes, you can track Waves Corporation Ltd financials in yearly and quarterly reports right on TradingView.
WAVES net income for the last quarter is 84.61 M PKR, while the quarter before that showed 171.78 M PKR of net income which accounts for −50.74% change. Track more Waves Corporation Ltd financial stats to get the full picture.
Waves Corporation Ltd dividend yield was 0.00% in 2024, and payout ratio reached 0.00%. The year before the numbers were 0.00% and 0.00% correspondingly. See high-dividend stocks and find more opportunities for your portfolio.
As of Dec 11, 2025, the company has 822 employees. See our rating of the largest employees — is Waves Corporation Ltd on this list?
EBITDA measures a company's operating performance, its growth signifies an improvement in the efficiency of a company. Waves Corporation Ltd EBITDA is 642.78 M PKR, and current EBITDA margin is 10.94%. See more stats in Waves Corporation Ltd financial statements.
Like other stocks, WAVES shares are traded on stock exchanges, e.g. Nasdaq, Nyse, Euronext, and the easiest way to buy them is through an online stock broker. To do this, you need to open an account and follow a broker's procedures, then start trading. You can trade Waves Corporation Ltd stock right from TradingView charts — choose your broker and connect to your account.
Investing in stocks requires a comprehensive research: you should carefully study all the available data, e.g. company's financials, related news, and its technical analysis. So Waves Corporation Ltd technincal analysis shows the buy rating today, and its 1 week rating is strong buy. Since market conditions are prone to changes, it's worth looking a bit further into the future — according to the 1 month rating Waves Corporation Ltd stock shows the buy signal. See more of Waves Corporation Ltd technicals for a more comprehensive analysis.
If you're still not sure, try looking for inspiration in our curated watchlists.
If you're still not sure, try looking for inspiration in our curated watchlists.