Waves Breakout and Buy Idea !Waves Corporation Ltd (PSX: WAVES) – Long term Technical Setup
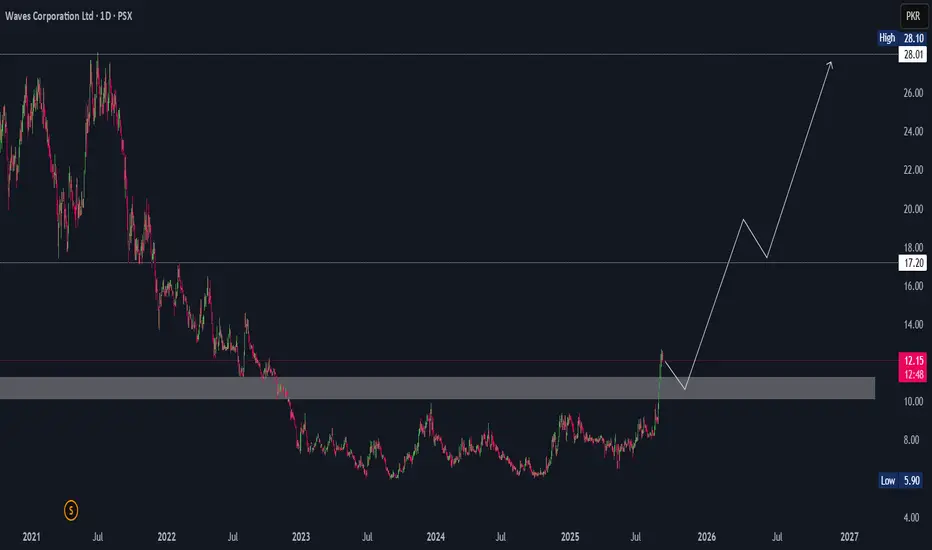
Waves has finally broken out of a multi-year accumulation zone after trading sideways since late 2022. The stock has cleared the major supply area around 10–11 PKR, turning that region into a fresh support base.
From here, I expect a healthy pullback into that zone (shakeout/retest) before the next leg higher. The first major resistance sits around 17.20, and a sustained breakout above that level could open the way towards the 28–30 PKR zone over the longer term.
Volume has been picking up, which suggests real money is starting to rotate in. As long as price holds above 10, the structure remains bullish.
This chart is setting up for a classic accumulation → breakout → retest → markup phase. Longer term investors may want to watch closely how it behaves on the retest before positioning for the bigger move.
Trade ideas
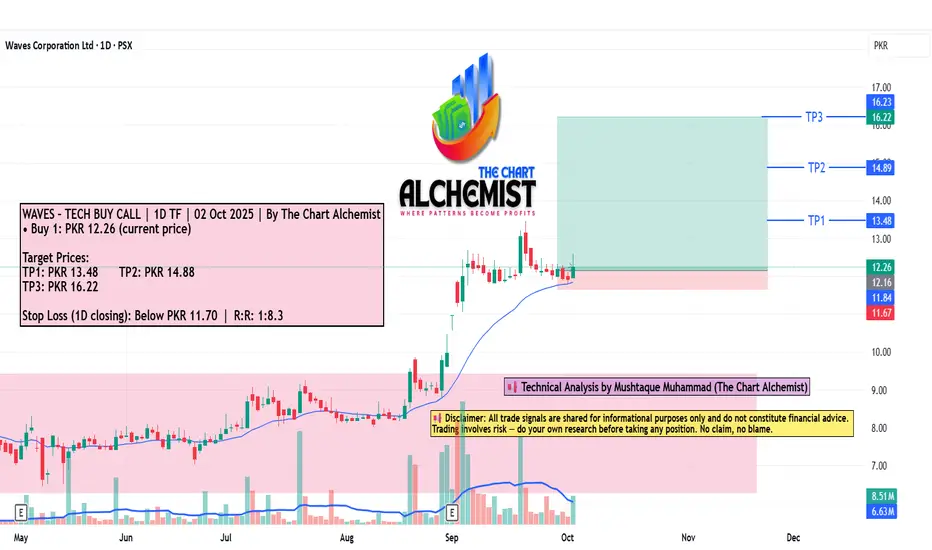
WAVES – TECH BUY CALL | 1D TF | 02 Oct | By The Chart AlchemistWAVES – TECH BUY CALL | 1D TF | 02 Oct 2025 | By The Chart Alchemist
the stock previously accumulated in a trading range (marked with light pink color channel), then broke out in a spike pattern, achieving a high of pkr 13.5. after pulling back, the stock is now forming a db bull flag pattern. we expect the stock to move upward from here and achieve multiple bullish targets.
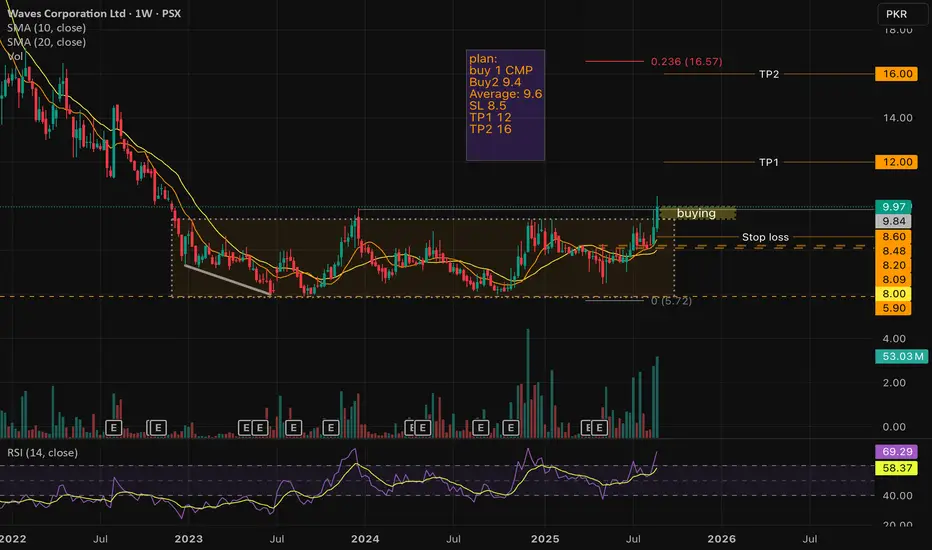
Waves Corporation Ltd (PSX: WAVES) – Weekly Chart BreakoutWaves has finally broken out of a long consolidation zone with strong volume confirmation. Price closed at 9.97 (+10.29%), above both the 10 SMA (8.48) and 20 SMA (8.00).
📌 Trading Plan:
Buy 1: CMP
Buy 2: 9.4
Avg Entry: 9.6
Stop Loss: 8.5
TP1: 12
TP2: 16
📊 Observations:
RSI at 69.29, approaching overbought but still room to run.
Weekly breakout after 2+ years of sideways action.
Strong volume spike supports bullish momentum.
⚠️ Risk management is key: Protect with SL below 8.5.
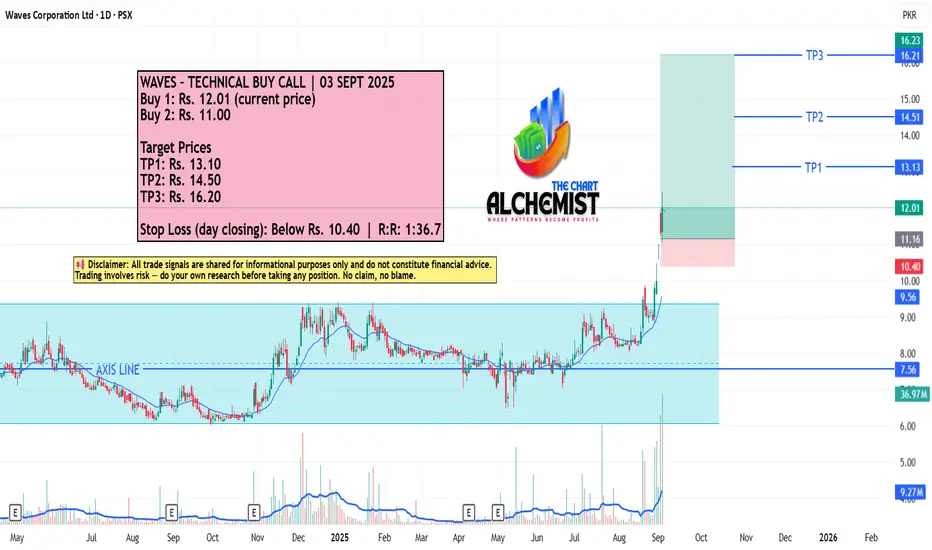
WAVES – TECHNICAL BUY CALL | 03 SEPT 2025 WAVES – TECHNICAL BUY CALL | 03 SEPT 2025
The stock previously broke out of a reaccumulation phase, achieved all targets, and now seems poised for further upside movement.
PSX - WAVES - Long PositionTrend: Bearish
Divergence: Weekly Bullish Divergence
Pattern: Double Bottom
Price borke the Lower High after ranging
Appeared in Volumes today as well
--
Trade Plan:
Entry: CMP
SL: 6
TP: 14

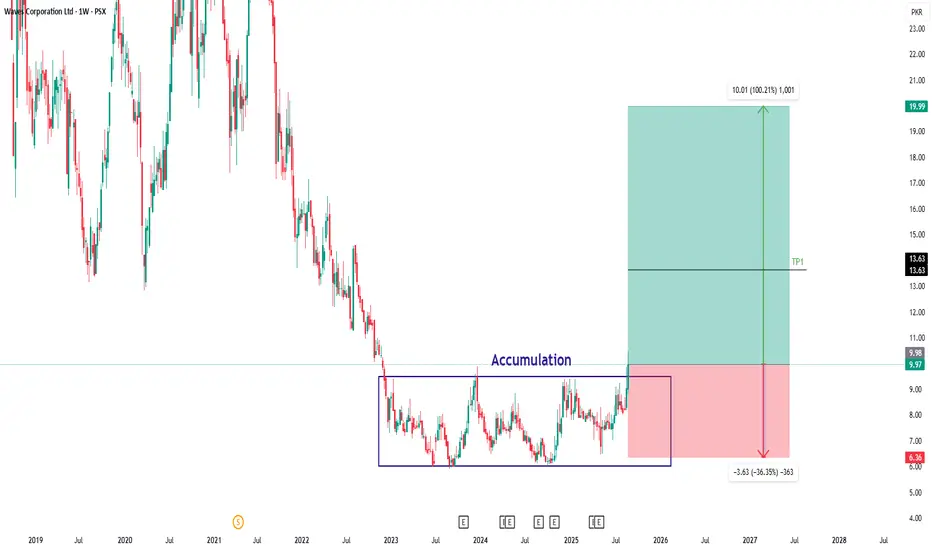
WAVES - KSE100 - Breakout of range?WAVES has successfully broken out of its accumulation zone and closed the weekly candle above the key resistance level, signaling bullish momentum.
Trade Setup:
Entry: On breakout confirmation
Stop Loss (SL): 6.36
Take Profit 1 (TP1): 13.63
Take Profit 2 (TP2): 20
With the breakout and strong weekly close, price action suggests the potential for a 100% upside move in the coming weeks. Risk is well-defined with the SL below structure.
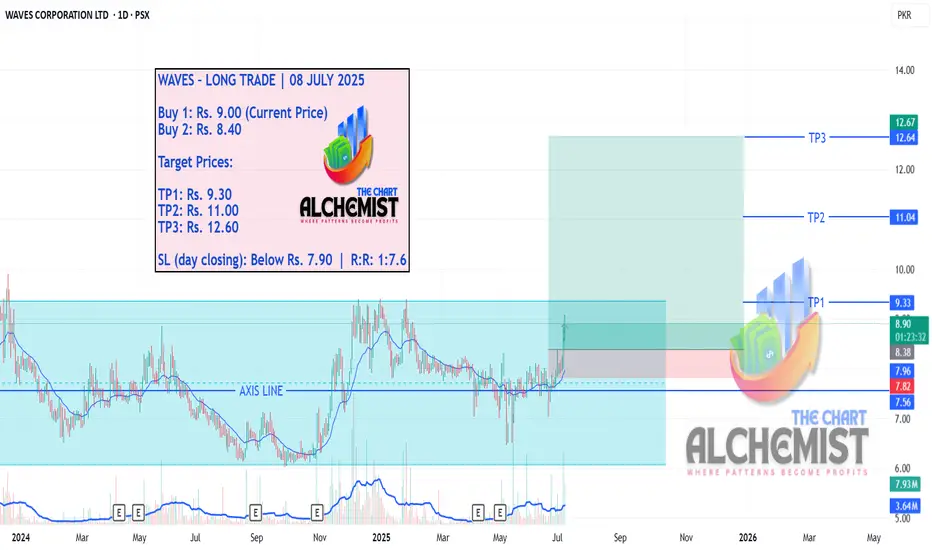
WAVES LONG TRADE 08-07-2025WAVES – LONG TRADE | 08 JULY 2025 (STRIKE ONE REVISIT – RECALL SIGNAL)
WAVES has been consolidating since June 2023 in a broad range. The recent bullish price action indicates strength and potential for breakout, marking a recall signal of the original Strike One opportunity. With multiple targets in play and a strong risk-reward ratio, this setup presents a favorable long entry.
WAVES is BullishPrice has been in an accumulation box for over two years now, and a breakout seems to be on the horizon. Bullish sentiment is further validated by the bullish RSI divergence. When the price breaks previous higher high than we can expect a strong bullish move as per Dow theory. Targets are mentioned on the chart.

Waves - Bull FlagPSX:WAVES forming Double Bottom on Daily TF and breaking out of Bull Flag accumulation. AL and Targets mentioned.

Bullish Divergence on bigger time frames.
Bullish Divergence on bigger time frames.
Currently in a Consolidation box.
Those who cant wait for long, should wait
for the breakout around 9.
Upside targets can be around 11 - 11.50
initially.
Strong Support seems to be around 6.
On the flip side, if this Support is broken,
the next levels would be around 3.

Waves Corporation-BuyWaves corporation is making HH and HL. recently it retraces up to 61.8% of fib level, respect ascending trend line, made very bullish candle pattern and also formed Hidden divergence which is indication of continuation of current bullish trend.
with 1:1 risk reward ratio, buy call can be taken

WAVESBuy WAVES and thanks me later.
waves is in accumulation phase and formed strong bullish divergence on weekly time frame.
If the accumulation box breaks to the upside we will witness the massive bulls rally towards 20+ level.


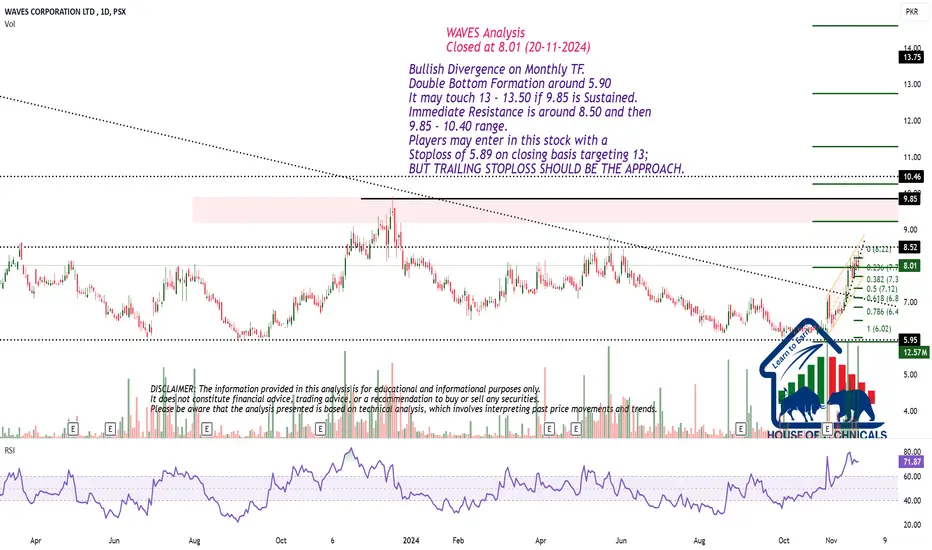
Bullish Divergence on Monthly TF.Bullish Divergence on Monthly TF.
Double Bottom Formation around 5.90
It may touch 13 - 13.50 if 9.85 is Sustained.
Immediate Resistance is around 8.50 and then
9.85 - 10.40 range.
Players may enter in this stock with a
Stoploss of 5.89 on closing basis targeting 13;
BUT TRAILING STOPLOSS SHOULD BE THE APPROACH.
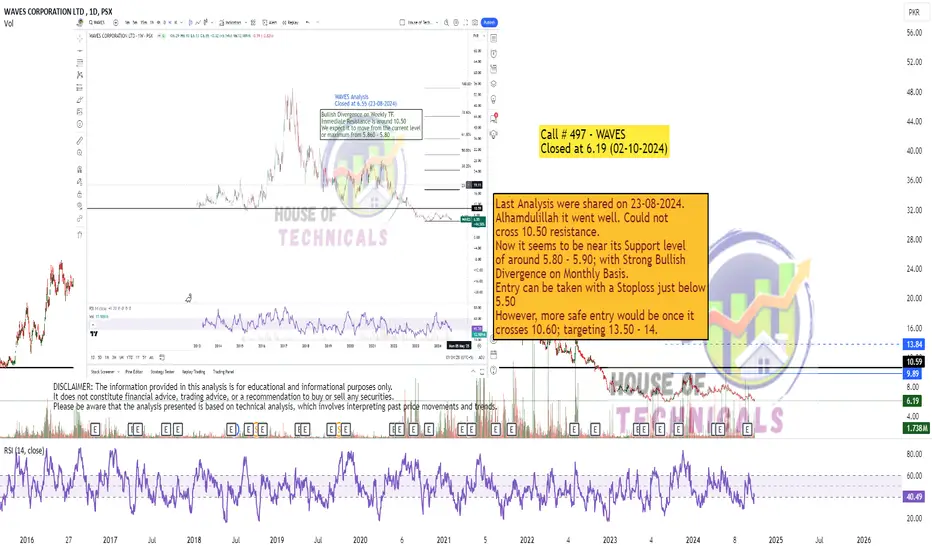
Last Analysis were shared on 23-08-2024.Last Analysis were shared on 23-08-2024.
Alhamdulillah it went well. Could not
cross 10.50 resistance.
Now it seems to be near its Support level
of around 5.80 - 5.90; with Strong Bullish
Divergence on Monthly Basis.
Entry can be taken with a Stoploss just below
5.50
However, more safe entry would be once it
crosses 10.60; targeting 13.50 - 14.
PSX : WAVES WAVES is in downtrend since july 2021
As the market is consistently printing new LHs and LLs.
Currently the market has formed a double bottom on weekly with div and broke the last LH ,
seems like after forming a new HL bulls are getting ready for some upside movement.
initial buy 7.12
2nd buy 6.61
SL 5.80
TP1 8.45
TP2 9.79

WAVES Analysis 2.0 (Long).🚀 Trade Alert: WAVES ABCD & Double Bottom Pattern 🚀
We have identified a compelling trading opportunity in WAVES, showcasing a confluence of bullish patterns:
ABCD Pattern 📈
Double Bottom Pattern ⏬⏫
Entry Point:
Our entry was marked at the Higher High (HH), with the neckline breaking at 8.44.
Current Market Price (CMP):
We recommend buying at the CMP with the following target prices:
Target Prices (TP):
TP 1: 8.84 🥇
TP 2: 9.30 🥈
Technical Indicators:
The Relative Strength Index (RSI) is synchronized, supporting our bullish outlook.
Trade Summary:
Buy at CMP
TP 1: 8.84
TP 2: 9.30
Good Luck! 🍀
Stay informed and trade smart! 📊

WAVESWe can attempt to buy WAVES from specified level as 0.618 FIB also intact.
SL , TP mention in chart.

Waves-psx Waves is in consolidation/triangular place a buy stop at 8.4 with avg buy at 7.10
SL 6.4
TP 9.2
manage your risk accordingly

WAVES | Cup & Handle Pattern Vs Trend Line SupportWAVES displays a promising bullish reversal pattern characterized by the formation of Cup & Handle pattern. Additionally, the stock price is supporting its ascending trend. Our plan entails accumulating the stock within the designated buy zone (7.20 - 7.50 range), while setting stop loss orders below the bottom of its CUP around 6.50 to manage risk effectively.
Anticipation builds initially around its neckline around 8.20 and upon the breakout from the neckline, anticipated around the 9 area.
It is paramount to approach trading with caution and adhere to sound money management principles. Your insights and perspectives on WAVES are encouraged.

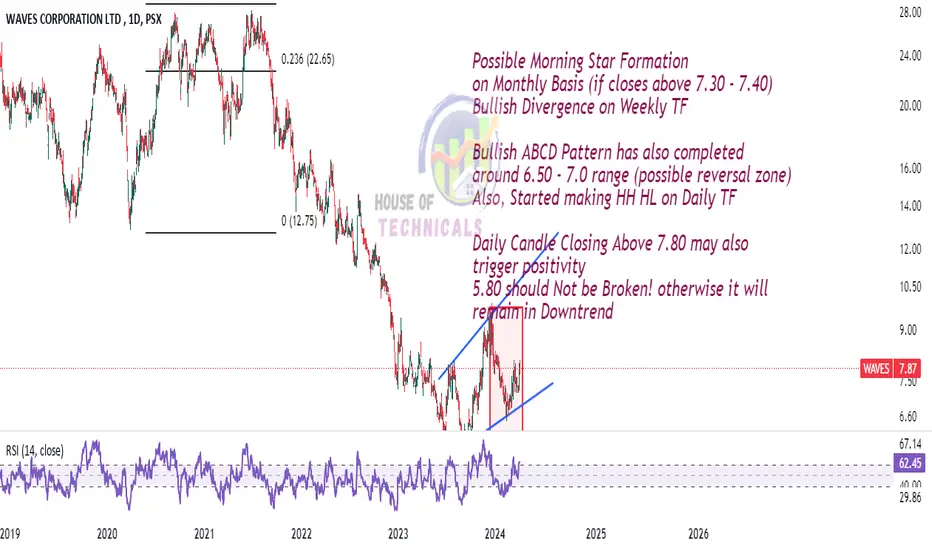
Possible Morning Star FormationPossible Morning Star Formation
on Monthly Basis (if closes above 7.30 - 7.40)
Bullish Divergence on Weekly TF
Bullish ABCD Pattern has also completed
around 6.50 - 7.0 range (possible reversal zone)
Also, Started making HH HL on Daily TF
Daily Candle Closing Above 7.80 may also
trigger positivity
5.80 should Not be Broken! otherwise it will
remain in Downtrend
WAVES is BullishWAVES was in a downward trend, however it broke previous lower high and printed a higher high, it would print a higher low now and then move to new highs as bulls seems to be in control of the price action. Targets are mentioned on the chart.

Waves-PSXWaves psx is currently displaying a promising technical setup making HL at horizontal support with 0.5 Fib support
Buy the pullback !!!
