$MSFT establishing HTF support at 200 day MATagged 200 day MA and bounced. Slight retest already happened. If the daily doesn't form a bear flag then it could easily target the gap at 495.
Options flow supports exactly that with call flow for the next two weeks expirations targeting 495 and 500
Microsoft Corp.
No trades
Trade ideas
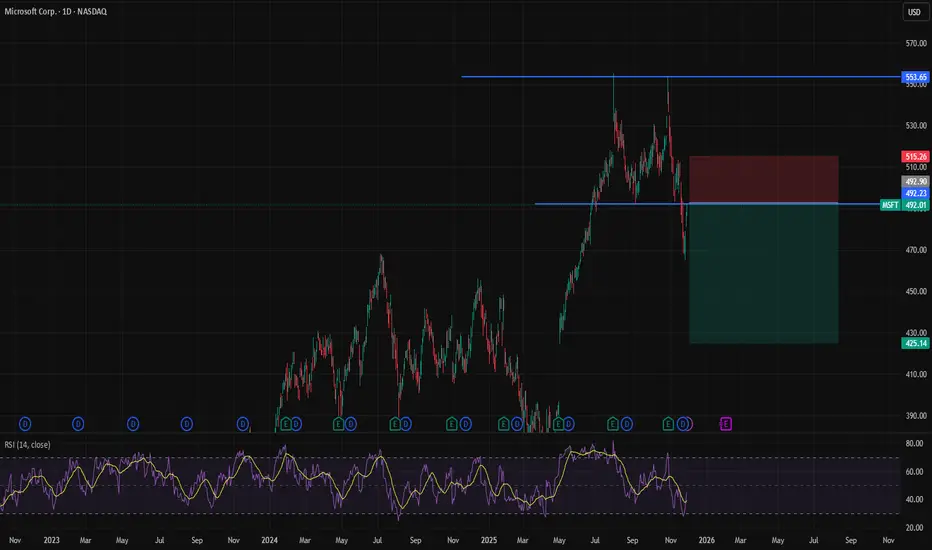
$MSFT Horizontal consolidation If the current context remain, I would see NASDAQ:MSFT doing horizontal consolidation between range $467-$556
$MSFT Bottom $455 oversold $425NASDAQ:MSFT Is a predictable machine $455 is the bottom margin for error could drop $425 in oversold situation.
All their fundamentals align and show the same pattern every time.
typically around this time we should see a dip which finds support at the last wave's highs.
there really isnt more explanation needed for this...
unless... we have a yen carry trade unwind.. that's a different story..

MSFT Swing Buy Setup — Multi-Factor Bullish Confirmation📈 MSFT QuantSignals V3 Swing Analysis | 2025-12-08
MSFT Swing Signal — 2025-12-08
• Direction: BUY CALLS
• Confidence: 65%
• Horizon: 18 days → 2025-12-26 expiry
• Strike Focus: $460.00
• Entry Range: $33.70
• Target 1: $49.80
• Stop Loss: $23.50
• 1W Move: +1.49%
• 2W Move: +2.15%
• Volume: 1.0× vs prior swing
• Swing Range: $480.08 – $492.30
⚠️ Moderate Risk: Consider reducing position size due to moderate confidence.
🎯 TRADE RECOMMENDATION
Direction: BUY CALLS
Confidence Level: 65% (MEDIUM)
Conviction: Medium
⚠️ KATY–LLM CONFLICT DETECTED
Conflict: Direction
LLM Recommendation: BUY CALLS
Katy AI Chart Prediction: BUY PUTS (-1.40% predicted move)
Katy Confidence: 50%
Proceed with caution — signals do not fully align.
🧠 ANALYSIS SUMMARY
Katy AI Outlook
Predicts STRONG_BULLISH trajectory targeting $520+ within 3 weeks
Driven by earnings momentum + AI leadership catalysts
Technical Analysis
Resistance: $493.50 (today’s high)
Support: $482.87 (VWAP)
Trading near 90% of swing range → potential breakout
Bullish divergence across momentum indicators
No major candlestick reversal patterns detected
Market Context
Overall Market: STRONG BULLISH
SPY: Bullish
QQQ: Bullish
Strong alignment with tech-sector momentum.
News Sentiment
Bullish — MSFT featured in favorable TA articles
Instacart x ChatGPT partnership strengthens MSFT AI dominance
Options Flow
PCR 1.31 → bearish-leaning flow
Heavy volume at $420 puts suggests hedging rather than bearish direction
Low theta decay ideal for swings
Risk Level: MODERATE
Watch for clean breakout above $493.50.
💰 TRADE SETUP
Expiry: 2025-12-26 (18 days)
Recommended Strike: $460.00 (0.881 delta — balanced)
Entry Range: $33.10–$34.30 (use exact real-time bid/ask)
Target 1: $49.80 (+50%)
Target 2: $66.40 (+100%)
Stop Loss: $23.50 (-30%)
Position Size: 3% of portfolio

Quant signals MSFT Weekly PUT: Institutional Bearish MomentumDirection: BUY PUTS (SHORT)
Confidence: 65% (Medium)
Strike: $475.00
Entry Price: $4.10
Target 1: $6.15 (50% gain)
Target 2: $8.20 (100% gain)
Stop Loss: $2.87 (30% loss)
Expiry: 2025-12-05 (2 days)
Position Size: 2% of portfolio
Weekly Momentum: BEARISH (-2.82%)
Options Flow: Bearish (PCR 18.23) – heavy institutional put buying
Technical: Oversold RSI 5.2, session low $475.28, resistance $493.50
News: Microsoft lowers AI software sales quotas – negative catalyst
Risk: Medium – Katy AI conflicts (neutral-to-bullish), high gamma risk
MSFT Weekly PUT Signal #2
Direction: BUY PUTS (SHORT)
Confidence: 65% (Medium)
Strike: $482.50
Entry Price: $3.30
Target 1: $4.95 (50% gain)
Target 2: $6.60 (100% gain)
Stop Loss: $2.31 (30% loss)
Expiry: 2025-12-05 (2 days)
Position Size: 3% of portfolio
Weekly Momentum: NEUTRAL (+0.08%)
Options Flow: Bearish (PCR 14.10) – heavy institutional put buying
Technical: Overbought RSI 85.2, weekly high $493.50, support $475.20
News: Negative AI sales catalyst
Risk: Medium – Katy AI conflicts (bullish prediction), requires active management
Microsoft (NASDAQ: $MSFT) Drops as AI Sales Miss Targets Microsoft (NASDAQ: NASDAQ:MSFT ) slid more than 2% after a report from The Information claimed that the company had reduced growth targets for its AI products because sales teams failed to meet expectations. The report highlighted that several Azure sales units missed ambitious quotas tied to Foundry—Microsoft’s enterprise AI platform used to build and manage autonomous AI agents. According to the report, less than 20% of salespeople in one U.S. Azure division hit the 50% Foundry growth target, while another team initially faced a quota requiring them to double sales.
Microsoft quickly refuted the claims, stating that The Information conflated growth projections with internal quotas. The company emphasized that “aggregate sales quotas for AI products have not been lowered,” reaffirming the strength and ambition of its broader AI roadmap. Despite the clarification, the stock reacted sharply, reflecting heightened sensitivity around AI monetization as enterprise adoption continues to lag expectations.
Although AI is transforming workflows and offering automation opportunities, the adoption curve for enterprise-scale AI agents remains slower compared to consumer AI breakthroughs. Competitors including Google, Amazon, Anthropic, Salesforce, and OpenAI all face similar challenges as traditional organizations navigate data integration, reliability issues, and operational risk.
Technical Outlook
From the chart, MSFT has pulled back sharply from its $555 resistance zone and is now retesting a key support level around $465. This area aligns with previous structure and may act as short-term demand. A breakdown below $465 opens room for a deeper decline toward the $450 level. However, holding this support could trigger a rebound back toward the $555 region. Momentum remains neutral-bearish, with price sitting below the recent swing highs.

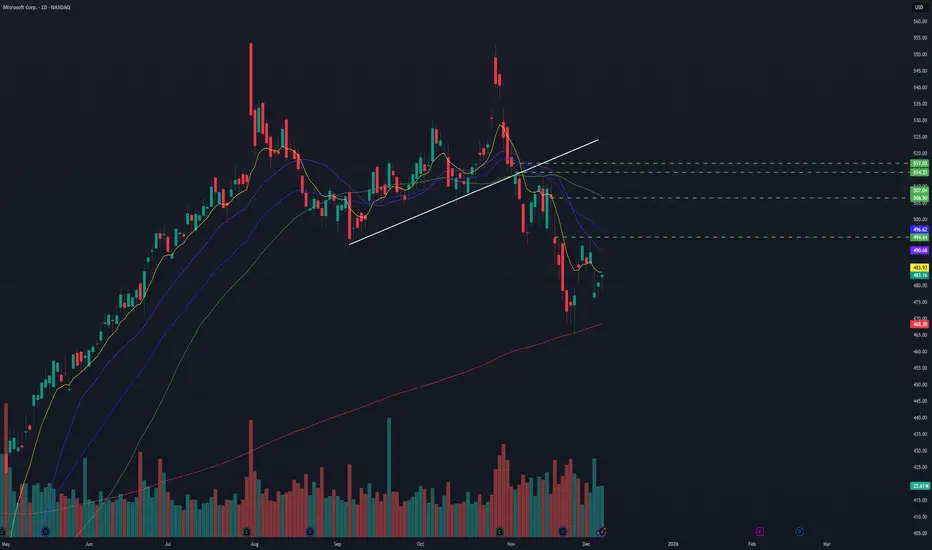
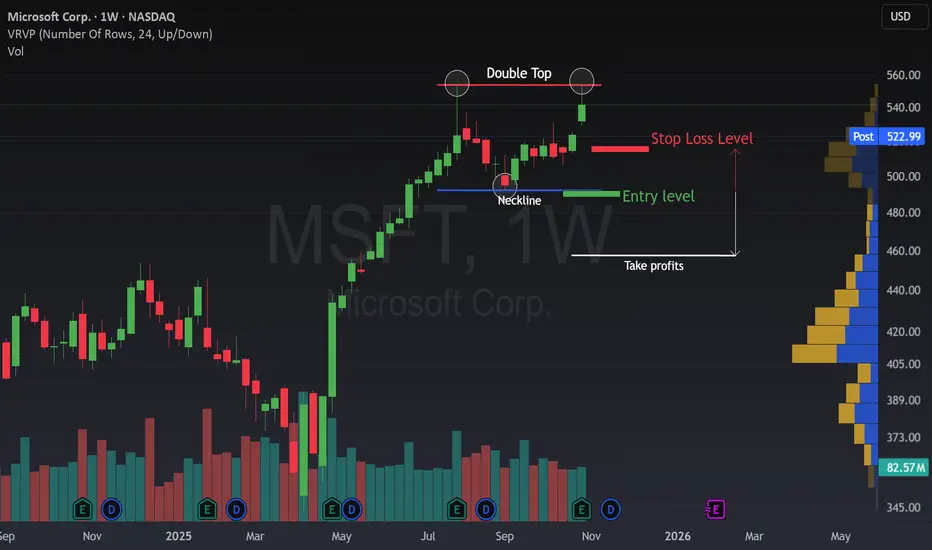
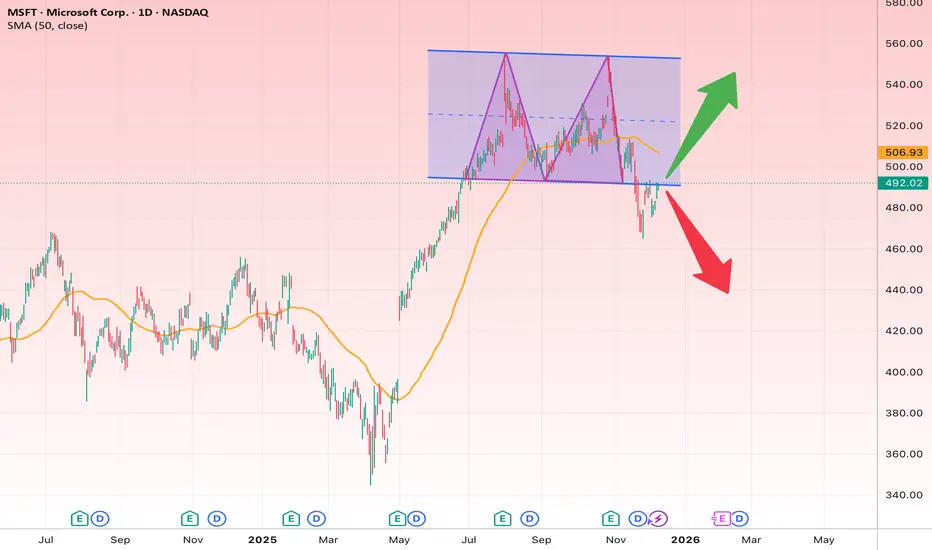
MSFT PullbackPattern Identified: Bearish Double Top pattern confirmed on Microsoft ( NASDAQ:MSFT ) with neckline break and clear measured move objectives. Neckline Break Triggers Measured Move to Gap Fill.
Key Confluence:
First Top: Initial rejection
Second Top: Failed breakout, lower high
Neckline: Support connecting swing lows between tops
Confirmation: Neckline break & retest completed
Measured Move Calculation:
TP1: Distance from highest top to neckline, projected onto the breakout zone = $430
TP2: Gap fill zone from May 1st, 2025 = $400
SL: Above Neckline at previous confirmation

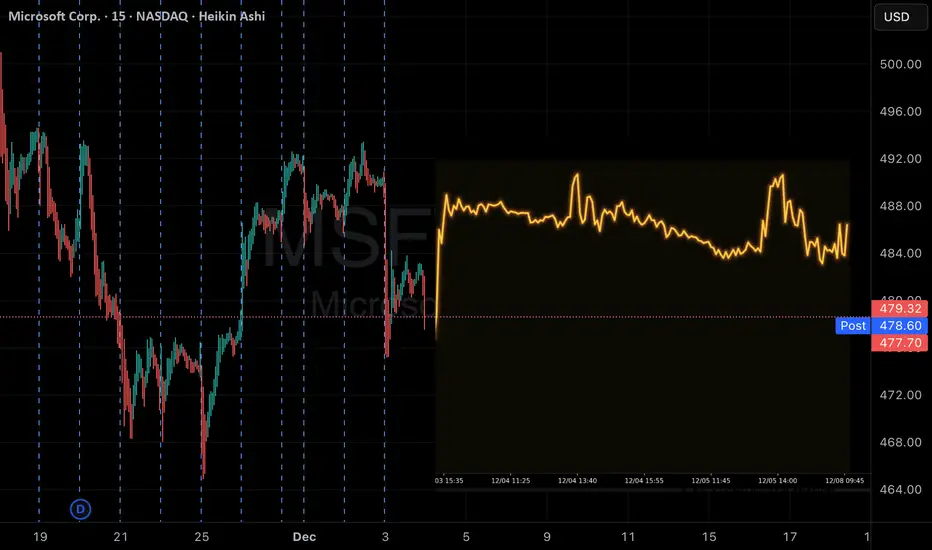
MSFT LongBroader Market Structure
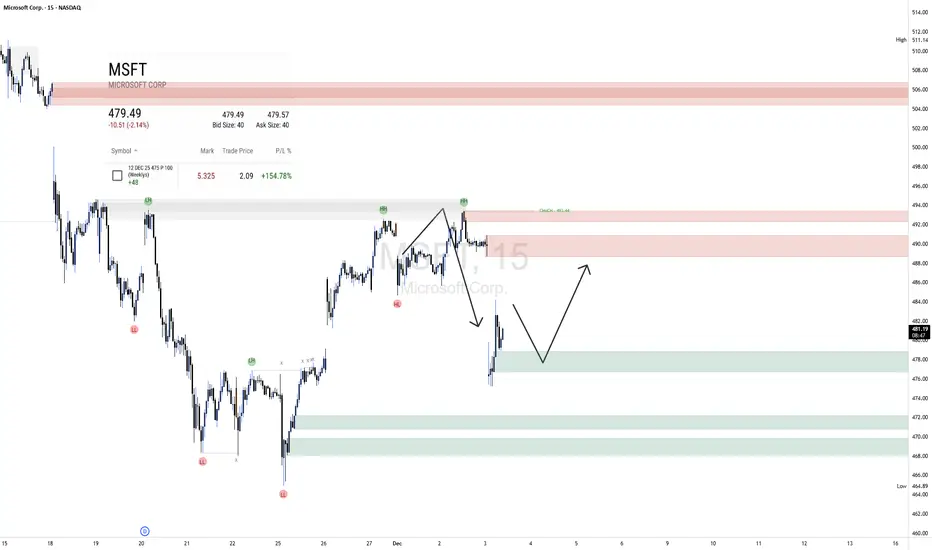
MSFT on the 15-minute chart is in a short-term uptrend following a sequence of higher lows and higher highs from the $464 area. The key structural shift occurred when price printed a CHoCH at $492.44, breaking above the previous swing high and confirming bullish intent. Before that, the market had transitioned from lower lows into a clear higher-low structure, signaling accumulation before expansion. The recent drop from the $492–$494 supply is corrective, not impulsive, which suggests we’re seeing a pullback rather than a reversal unless demand fails.
Supply & Demand Zones
The upper supply around $492–$494 has shown clear weakness for buyers; price rejected immediately with strong momentum and multiple wicks showing absorption and aggressive selling. Higher up, the major supply at $504–$507 remains a strong distribution zone where price previously dropped sharply, indicating institutional control. On the demand side, the closest zone at $478–$475 is fresh and unmitigated; buyers stepped in with strength from that area earlier, producing a decisive rally and ultimately the CHoCH. A deeper demand below $470–$466 is even more important because it initiated the entire trend shift and contains protected lows.
Price Action in the Marked Region
Price is currently declining from supply and pushing toward the green demand region. The move down is controlled rather than impulsive, indicating sell-side momentum is fading as it approaches prior buyer interest. The marked projection makes sense: a dip into $478–$475 would allow liquidity collection before a bounce toward the $488–$492 supply above. If demand holds, expect responsive buying with a clean bullish engulfing candle or long-wick rejection.
Trade Bias, Direction & Invalidation
The bias for now is bullish, looking for a pullback to demand and continuation upward. The expected direction is a retest of $478–$475 followed by a rally toward $488–$492.
A key invalidation level is a clean 15-minute close below $475—if that level breaks, sellers likely target the deeper $470–$466 demand, and the bullish thesis weakens significantly.
Momentum & Candle Behavior
Momentum currently favors sellers in the short term, but the drop is stepping rather than impulsive, suggesting exhaustion into demand. Look for a shift in candle behavior—such as a bullish engulfing bar, absorption wick, or displacement candle—to confirm buyer strength returning.
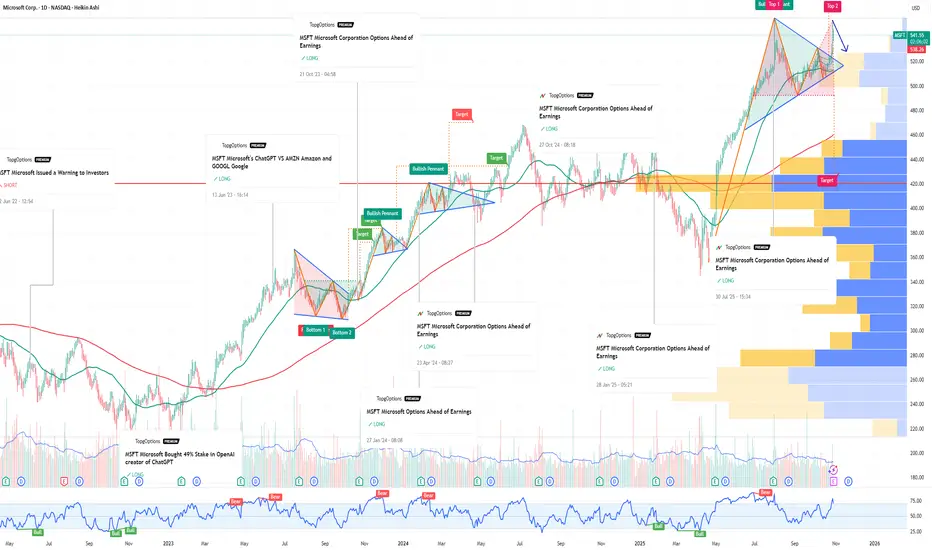
MSFT: Next Long Term Buy ZoneMicrosoft has staged a strong rally since the April tariff-related selloff, rebounding significantly but ultimately failing to set a new meaningful high in October. While the company’s earnings have remained relatively strong, it is still a publicly traded stock and therefore susceptible to broader market conditions that could trigger a pullback.
After my analysis on META identified a strong trade/buy zone around $600 and below, I’ve noticed a very similar setup forming on Microsoft, one that could present an excellent buying opportunity if a deeper drop materializes.
From a purely technical standpoint, using volume-based tools, I see several reasons to be prepared for a potentially larger pullback in this stock.
To start, I’ve marked two major zones to outline the volume-price action: the first is the consolidation range before the tariff driven decline, and the second is the volume profile of the subsequent uptrend.
You’ll notice that price broke out of the previous consolidation range without any meaningful retracement back into that fair value zone, essentially melting up. This creates thin structural support that can easily give way if meaningful sell-side pressure emerges.
Secondly, price has failed twice above the Value Area High of the uptrend’s fair value range near $538. These failures resulted in a failed auction that drove price to the opposite end of the range at $472. What concerns me most is the rejection at the Point of Control (the most heavily traded zone), highlighted in blue. Price reacted sharply from that level, forming a resistance zone that has not been reclaimed, an indication of potential weakness.
Third, price is now losing the uptrend anchored VWAP from the previous swing low. In my view, this is a major support level that typically signals trend continuation, where buyers should be stepping in to defend price. That is not occurring. If price breaks below the Value Area Low where the most recent swing low sits I would be concerned about a possible waterfall move that could bring price back into previous support zones.
If such a drop does occur, I will not panic. Instead, I will recognize it as a potential major buying opportunity in a fundamentally strong and profitable company one that could represent nearly a 25% decline from the highs.
Only time will tell..

QS V3 Weekly Call Opportunity – MSFT Bullish TrendMSFT Weekly Signal | 2025-12-05
MSFT Weekly Call Option
Direction: Buy Calls (Long / Bullish)
Strike: $482.50
Entry Price: $5.62 – $5.70
Profit Target 1: $8.90 (≈60% gain)
Profit Target 2: $11.20 (≈100% gain)
Stop Loss: $3.90 (≈30% loss)
Expiry: Dec 12, 2025 (7 days)
Position Size: 2% of portfolio
Confidence: 58%
Rationale: Katy AI predicts upward trajectory to ~$497 by Friday; MACD bullish divergence suggests potential multi-day reversal.
Risk Notes: High – Friday expiration with gamma effects; low VIX may reduce premium capture. Monitor actively.


A Double Top in MSFT has just appeared.The weekly chart of Microsoft (MSFT) is showing a potential Double Top formation, a classic sign that bullish momentum might be losing strength .
🔹 Bullish Scenario: As long as the price stays above the blue neckline , the uptrend remains intact. Buyers are still in control, and a clear breakout above the recent highs could trigger a move into new all-time highs.
🔹 Bearish Scenario: If the price breaks below the neckline , it could confirm the Double Top setup and open the door for short opportunities.
NASDAQ:MSFT is standing at a critical decision point, will the stock continue its strong rally, or is this the first sign of exhaustion before a larger pullback?
💬 What do you think, are we about to see another breakout, or is the beginning of a deeper correction?
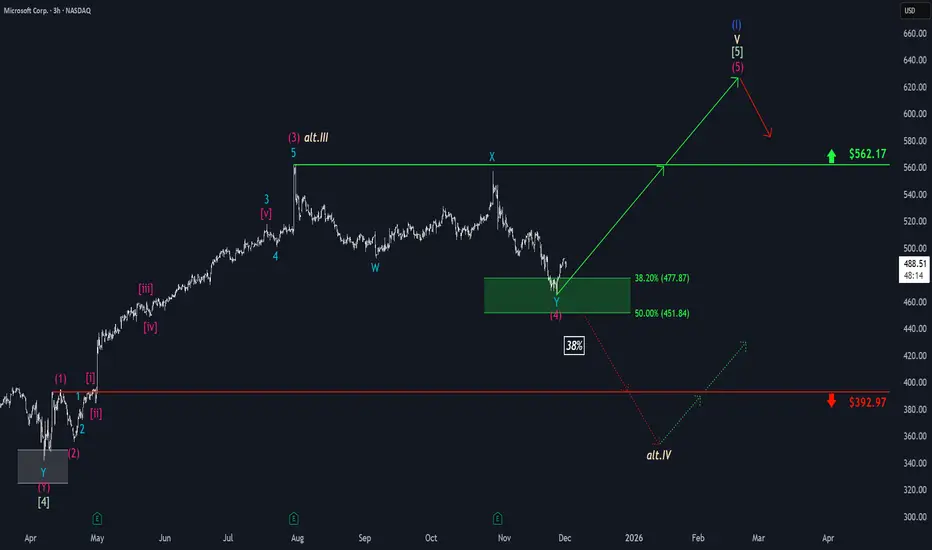
Microsoft: Target Zone Hit!Microsoft has reached our green Long Target Zone between $451.84 and $477.87 as anticipated. In the meantime, the stock has successfully completed the magenta wave (4) and has since broken out of the Target Zone to the upside. We now expect further gains as wave (5) unfolds, targeting a move above the resistance at $562.17, where the larger blue wave (I) is expected to conclude. After that, we anticipate a pronounced correction phase. However, there remains a 38% chance that MSFT could break down through the Target Zone and fall below the support at $392.97. In this case, we would reclassify the last significant high at $562.17 as the top of the beige wave alt.III and prepare for a new low in wave alt.IV .
MSFT Microsoft Corporation Options Ahead of EarningsIf you haven`t bought MSFT before the rally:
Now analyzing the options chain and the chart patterns of MSFT Microsoft Corporation prior to the earnings report this week,
I would consider purchasing the 550usd strike price Puts with
an expiration date of 2025-12-19,
for a premium of approximately $26.70.
If these options prove to be profitable prior to the earnings release, I would sell at least half of them.
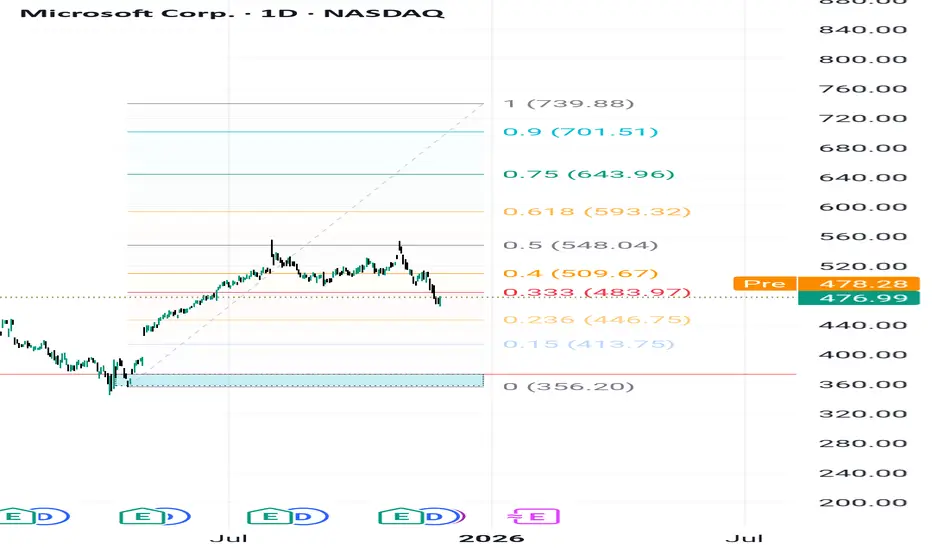
MSFT — Bullish Structure Intact Above 373.22, Targeting 739.88.Microsoft remains in a well-defined long-term bullish structure despite the current pullback from the 0.40–0.50 Fibonacci resistance cluster. The recent decline appears corrective in nature and does not signal any structural weakness as long as the stock preserves its main support foundation.
Key Support (Primary Structural Level): 373.22
The level at 373.22 represents the most critical demand zone on the chart.
It marks:
The origin of the previous bullish impulse,
A zone of strong institutional accumulation,
The base that
continues to anchor the long-term trend.
As long as price stays above 373.22, the broader upward cycle remains intact.
Fibonacci Expansion Targets (Long-Term Investor Levels)
The current impulsive leg projects the following upside targets:
483.97 (0.333)
509.67 (0.40)
548.04 (0.50)
593.32 (0.618)
643.96 (0.75)
701.51 (0.90)
739.88 (1.00 — primary long-term extension)
These levels correspond to strategic zones where institutional models anticipate consolidation or profit-taking.
Market Structure & Investor Outlook
The long-term trend remains strongly bullish.
The current pullback is normal retracement behavior.
Secondary demand pockets sit at 446.75 and 413.75 if the pullback deepens.
Macro structure remains fully intact above 373.22.
Bullish Continuation Scenario (Base Case)
If MSFT holds above 483.97 and regains momentum, the price can progress through:
509 → 548 → 593 → 643 → 701 → 739.88
This represents the natural continuation path of the current expansion.
Bearish Scenario (Limited & Non-Structural)
The only valid bearish scenario for now is a return to retest the key support at 373.22.
This move would represent:
A technical retest,
A liquidity sweep,
A refresh of institutional demand, not a trend reversal
As long as price holds 373.22, the long-term bullish structure remains unchanged.
Conclusion
Microsoft continues to demonstrate strong long-term structural integrity.
The only bearish possibility is a corrective move back toward the 373.22 support, after which the broader trend is expected to resume toward the long-term targets: 509, 548, 593, 643, 701, and 739.88.
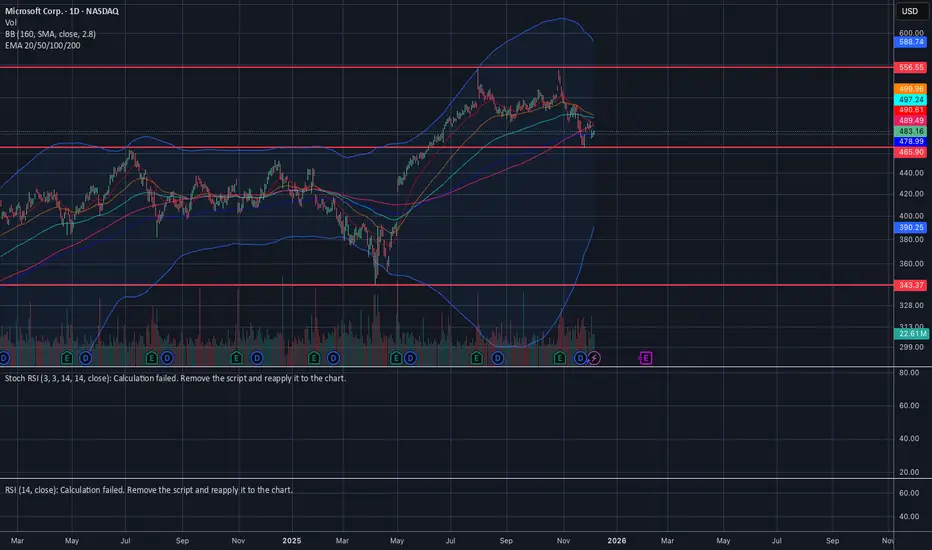
Microsoft at a Breaking Point: Is This Pullback a Trap?Microsoft has broken down from a distribution range / double top zone and is now forming a critical pullback retesting the broken support. This area will determine the medium-term direction.
Bearish Scenario (More Likely)
Rejection from 505–510:
• Target 1: 480
• Target 2: 455
• Target 3: 430
• Stop-loss: Daily close above 515
Bullish Scenario
If price closes above 515:
• Target 1: 525
• Target 2: 545
• Stop-loss: Close below 500
Short Fundamental View
• Strong position in AI, cloud, and enterprise software.
• Copilot and Azure growth remain strong.
• But valuation is stretched at highs, increasing correction risk.
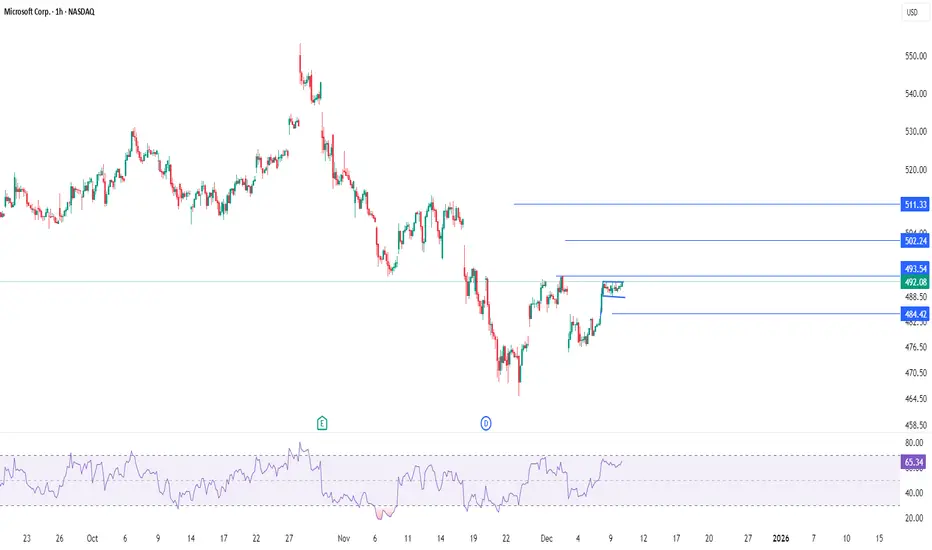
MSFT shortBroader Market Structure
MSFT on the 15-minute timeframe shows an overall bullish trend leading into December, characterized by a sequence of higher highs and higher lows. This trend shifts when price forms a lower high near approximately 493–494 and subsequently breaks the prior swing low around 487, which constitutes a clear CHoCH. This downward break signals that buyers have lost control of the short-term structure and that the market is now vulnerable to a deeper pullback or a transition into a bearish phase. After that downside move, price recovers sharply and breaks back above the internal swing near 488, forming a short-term bullish BOS. However, the most recent price action shows price rejecting from a fresh lower-timeframe high at roughly 491–492, suggesting another potential CHoCH to the downside if it clears the most recent local low.
Supply and Demand Zones (short descriptive paragraphs)
The supply zone around 492–494 is proving to be strong; price dropped sharply from this level earlier, indicating sellers stepped in decisively. When price revisited this zone, it again showed hesitation and rejection, confirming that supply remains active. On the demand side, the area near 482–484 previously held well, with buyers stepping in aggressively and producing a strong impulsive leg upward. That strength makes the demand below price a valid rebound area; however, its strength will degrade if price returns too frequently or approaches it with heavy bearish momentum.
Price Action Within the Marked Region
Inside the highlighted region on the right side of your chart, price has formed a lower high beneath the 491–492 supply ceiling and is now drifting sideways with slight bearish pressure. This indicates that price is respecting nearby supply and failing to push higher. If current momentum continues, price is likely to pull back into the 485–486 area first, and if that fails, extend deeper toward the 482–484 demand. Should the demand zone hold, a bounce back toward 490 would be expected; if it fails, the downside opens further.
Current Trade Bias, Expected Direction & Invalidation
Bias is mildly bearish in the short term due to the rejection at supply and the emerging lower-high structure. Expected direction is a move down into 485–486, and potentially deeper into the 482–484 demand zone. The key invalidation level for the bearish view is a clean break above 492. If price closes above that level with momentum, it negates the downside structure and reopens bullish continuation.
Momentum & Candle Behavior
Momentum currently favors sellers; candles near the top show upper wicks, hesitation, and loss of upward drive. No aggressive bullish engulfing or displacement candles are present at the moment, reinforcing the possibility of further downside before buyers regain control.

Trading Global Assets: An Overview1. Types of Global Assets
Global assets can be broadly classified into several categories:
Equities (Stocks): International stocks allow investors to participate in the growth of companies worldwide. For example, investing in technology firms in the U.S., consumer goods companies in Europe, or emerging market businesses in Asia can provide diversified exposure to global economic trends. Stocks are typically traded on exchanges like the NYSE, NASDAQ, London Stock Exchange, or Tokyo Stock Exchange.
Bonds: Sovereign and corporate bonds issued by foreign governments or companies offer opportunities for income generation and portfolio diversification. For instance, U.S. Treasury bonds are considered safe-haven assets, whereas emerging market bonds may offer higher yields but higher risks.
Currencies (Forex): The foreign exchange market is the largest financial market in the world, with daily trading volumes exceeding $6 trillion. Investors trade currency pairs, such as EUR/USD or USD/JPY, to speculate on exchange rate movements or hedge against currency risks. Forex trading is highly liquid and operates 24 hours, providing constant opportunities for global traders.
Commodities: Gold, oil, silver, and agricultural products are traded globally through futures and spot markets. Commodities are influenced by global supply-demand dynamics, geopolitical tensions, and economic growth trends. For instance, oil prices may react to conflicts in the Middle East, while gold often acts as a safe haven during financial instability.
Derivatives: Options, futures, and swaps allow investors to speculate on the price movement of underlying global assets or hedge existing positions. For example, currency futures can protect multinational companies from adverse currency fluctuations, while equity derivatives can help traders leverage their market positions.
ETFs and Mutual Funds: Global exchange-traded funds (ETFs) and international mutual funds pool investor capital to invest in multiple international assets, providing diversification with relatively lower costs. These funds can focus on specific countries, regions, sectors, or themes, such as emerging markets, technology, or green energy.
2. Benefits of Trading Global Assets
Trading global assets offers several strategic advantages:
Diversification: Investing in multiple countries reduces reliance on a single economy or currency. For example, if the U.S. market underperforms, gains in Asia or Europe can offset losses.
Growth Opportunities: Emerging markets often experience higher growth rates compared to developed economies, offering potential for higher returns.
Hedging Against Domestic Risks: Global investments can protect portfolios from domestic inflation, interest rate changes, or political instability. For instance, holding foreign bonds or currencies may offset domestic stock market volatility.
Access to Innovative Sectors: Some sectors or companies may be dominant in specific regions, such as technology in the U.S., renewable energy in Europe, or manufacturing in China. Global trading allows investors to access these growth drivers.
3. Challenges and Risks in Global Asset Trading
While the opportunities are compelling, trading global assets carries specific risks:
Currency Risk: Investments denominated in foreign currencies are exposed to exchange rate fluctuations. A strong domestic currency can erode returns when foreign earnings are converted back.
Political and Regulatory Risks: Changes in government policies, regulations, or trade restrictions can impact asset prices. For instance, sudden capital controls in an emerging market can limit liquidity and access to investments.
Market Liquidity and Volatility: Some global markets, especially in developing countries, may have lower liquidity, leading to higher volatility and transaction costs.
Time Zone Differences: Global trading requires monitoring markets across different time zones, which can be challenging for individual traders. Major market sessions in New York, London, Tokyo, and Sydney affect liquidity and price movements.
Economic and Geopolitical Factors: Global macroeconomic events, such as interest rate changes, recessions, or conflicts, significantly influence asset prices. Commodity-dependent economies, for example, are vulnerable to fluctuations in oil or metal prices.
4. Trading Strategies for Global Assets
Investors and traders employ various strategies to navigate global markets:
Fundamental Analysis: Evaluating macroeconomic indicators, company earnings, interest rates, inflation, and geopolitical conditions helps investors identify undervalued assets and long-term growth opportunities.
Technical Analysis: Traders use price charts, trends, and technical indicators to forecast market movements. Technical analysis is particularly common in currency, commodity, and equity trading.
Arbitrage: Exploiting price differences of the same asset across multiple markets can generate risk-free or low-risk profits. For example, currency or commodity arbitrage takes advantage of exchange rate discrepancies.
Hedging: Corporations and institutional investors use derivatives like options, futures, and swaps to protect against price fluctuations, currency volatility, or interest rate changes.
Thematic and Sectoral Investing: Targeting specific global trends such as renewable energy, artificial intelligence, or emerging market consumerism allows investors to capitalize on long-term growth themes.
5. Role of Technology in Global Trading
Advancements in technology have revolutionized global asset trading:
Electronic Trading Platforms: Online brokerages and trading platforms enable retail and institutional investors to access international markets instantly.
Algorithmic Trading: Automated trading systems analyze market data and execute trades based on pre-set rules, improving efficiency and reducing emotional bias.
Mobile and Cloud Technology: Traders can monitor portfolios, execute orders, and analyze markets from anywhere in real-time.
Data Analytics and AI: Advanced analytics provide insights into market trends, risk management, and predictive modeling for better decision-making.
6. Regulatory Considerations
Trading global assets requires understanding and compliance with international laws and regulations. Each country has specific rules regarding foreign ownership, taxation, reporting, and trading practices. Regulatory bodies, such as the U.S. Securities and Exchange Commission (SEC), European Securities and Markets Authority (ESMA), and local central banks, govern trading activities to ensure transparency and investor protection. Investors must also be aware of tax implications for capital gains, dividends, and foreign income.
7. Conclusion
Trading global assets opens a world of opportunities for diversification, growth, and risk management. It allows investors to participate in the performance of companies, currencies, commodities, and financial instruments across continents. However, it requires careful consideration of risks, including currency fluctuations, geopolitical instability, regulatory differences, and market volatility. A well-structured approach—combining fundamental and technical analysis, leveraging technology, and adhering to risk management principles—can help investors navigate the complexities of global markets successfully.
In the modern financial landscape, globalization, technology, and innovative financial instruments have made global asset trading more accessible than ever. For long-term investors, it offers exposure to growth engines around the world. For traders, it provides opportunities to capitalize on short-term market inefficiencies. Understanding the dynamics of global economics, market psychology, and risk management is essential for anyone aiming to succeed in this interconnected financial ecosystem.
Microsoft: Overvalued but Still Bullish - Watching the 400–450Microsoft NASDAQ:MSFT
1. Quick Trade Plan (for those who want levels first) 🎯
Market Bias: Long term bullish, but in a late phase of the cycle.
Strategy: Don’t chase highs; buy the correction.
📌 Buy Zones
Primary Buy Zone: 400–450 USD
Strong support cluster and the preferred accumulation zone.
Aggressive Early Entries:
450–470 on sharp dips, but main focus remains 400–450.
⛔ Invalidation Level
345 USD
A break below this level invalidates the mid term bullish structure.
🎯 Take Profit Targets
TP1: ~600
TP2: 680–720
Potential completion of the final fifth wave.
🧭 For Current Holders
Continue holding while above 345.
Use a protective stop below 345 if trading shares.
Options traders may hedge instead.
🆕 For New Buyers
Avoid entering near ATHs.
Wait for the 400–450 pullback.
Use 345 as your hard-risk level.
2. Fundamental Overview: Great Business, Clearly Overvalued 💼📊
Microsoft has delivered very stable mid-teens growth for years:
Revenue growth: 15–17 percent annually
EPS growth: also 15–20 percent annually
Last 3 quarters: EPS +9–12 percent, revenue in the same range
This is a mature mega-cap, not a hyper-growth name.
⚠️ Buybacks Stopped
Company regularly bought back shares for six years
Stopped in March 2023 and hasn’t resumed
This removes a major EPS-boosting engine
📉 Valuation (Peter Lynch style)
EPS growth ≈ 15 percent
P/E ≈ 30
Stock trades at ~2x its fundamental fair value
Conclusion:
Amazing business. Predictable. Cash generative. 🔥
But fundamentally overpriced and in the late stage of its growth curve.
3. Technical Picture: Still Bullish, but Late in the Cycle 📐📈
📅 Long Term Channel Since 2010
Price has stayed inside a massive uptrend channel for 14+ years.
As long as MSFT remains inside it, the primary trend stays bullish.
📏 200-Day Moving Average
MSFT consistently bounces from the 200d MA on the weekly.
That keeps the structural bull trend intact.
🌊 Elliott Wave Context
Currently in the 5th sub-wave of a larger 3rd wave
Upside still possible
Potential final wave targets: 600–700
⏳ What Comes After
Once this major wave completes:
Expect a multi-year sideways cycle (5–7 years) as the market distributes the massive positions accumulated since 2009.
4. Current Structure: A Correction Is Likely Before New Highs 🔄
We already saw an A–B–C correction, but structure suggests another A–B–C, forming a zigzag, before the final move higher.
🎯 Why 400–450 Is the Key Zone
Major liquidity & support cluster
Aligns with channel midline and prior consolidation
Perfect area for a 5th wave launch
If MSFT hits 400–450 and bounces → 600–700 is back on the table.
5. What To Do Based on Your Situation 🧭
✔️ If You Already Hold MSFT
Stay in the trade while above 345
Expect volatility
You can hedge or use a stop below 345
🟦 If You Want to Enter
Don’t FOMO near the highs ❌
Wait for a pullback into 400–450
Start with partial size, add on confirmation
345 = hard stop
⚡ If You Trade Short Term
Shorts are counter-trend
Treat every drop as a tactical move, not a macro reversal
Unless 345 breaks
6. Final Thoughts ✨
Microsoft is still in a powerful long term uptrend, but:
Fundamentally overvalued
Technically late stage of its long cycle
Likely to give a clean buyable correction
Best accumulation zone: 400–450
Invalidation: 345
Upside targets: 600–700
It’s a “buy the dip, not the rip” market for MSFT.
Not financial advice — manage risk according to your plan.

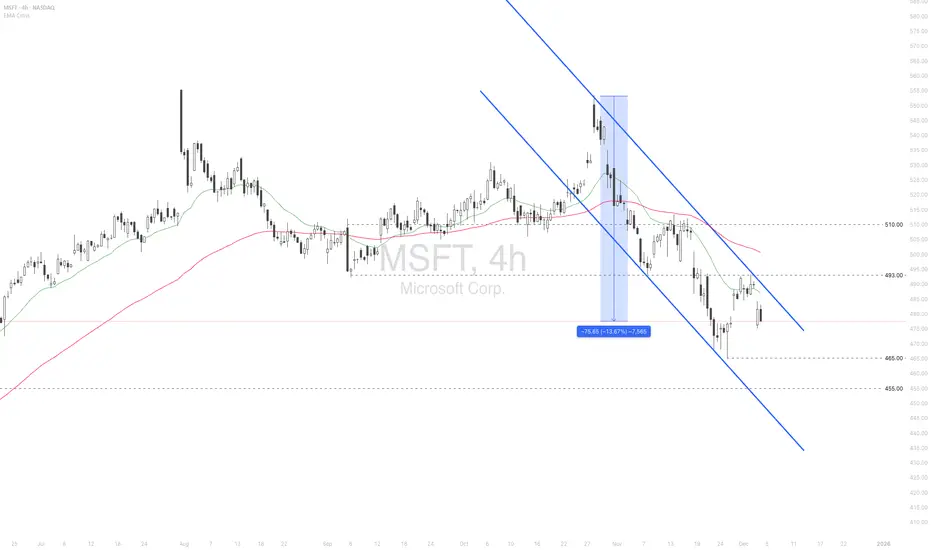
Resurfacing fears of AI overinvestment triggered by MSFT
A report claimed that Microsoft (MSFT) had lowered AI product sales growth targets across several divisions by as much as 50% for the current fiscal year, after many sales teams failed to meet targets for the fiscal year ending June 2025.
Although MSFT swiftly denied the report, it reignited investor concerns about AI monetization and the risk of overinvestment.
Adding to the unease, IBM CEO Krishna warned that even trillions of dollars invested in AI data centers cannot deliver meaningful returns under current cost structures, further fueling market anxiety.
MSFT briefly tested the resistance at 493.00 before falling below EMA21. The price remains below bearish EMAs, indicating a potential downtrend continuation.
If MSFT fails to close above EMA21, the price could retreat toward the following support at 465.00.
Conversely, if MSFT breaches above EMA21 and 493.00, the price may advance toward the next resistance at 510.
Global Banking and Financial Stability1. The Role of Global Banking in the World Economy
Global banking institutions include commercial banks, investment banks, universal banks, central banks, and cross-border financial intermediaries. These institutions perform several core functions that support global economic growth:
1.1 Capital Allocation
Banks collect deposits and channel them into loans for businesses, households, and governments. Efficient capital allocation ensures that productive sectors—manufacturing, technology, infrastructure—receive the funding they need to expand.
1.2 Facilitating Global Trade
Banks finance trade through letters of credit, export financing, and currency exchange. International transactions require trust, documentation, and risk management, which banks provide by acting as intermediaries.
1.3 Payment Systems
Modern banking supports real-time payments, cross-border remittances, SWIFT messaging, and digital fund transfers. These systems form the highway on which global money flows.
1.4 Risk Management and Hedging
Banks design instruments such as derivatives, currency swaps, and interest-rate futures, helping businesses manage forex, commodity, and credit risks. This stabilizes global supply chains and investment strategies.
2. The Architecture of Global Financial Stability
Financial stability means the system continues functioning even when faced with shocks—like economic downturns, geopolitical events, or market volatility. Several pillars support this:
2.1 Robust Banking Regulations
After the 2008 financial crisis, global regulators introduced stronger frameworks:
Basel III norms improved capital adequacy and liquidity requirements.
Stress testing ensures banks can survive market shocks.
Macroprudential regulations prevent systemic risks like credit bubbles.
These safeguards ensure banks hold enough capital and liquidity to absorb losses.
2.2 Central Bank Oversight
Central banks like the Federal Reserve, European Central Bank, Bank of England, RBI, and others play a major role in maintaining stability by:
Setting interest rates
Controlling inflation
Providing emergency funding through lender-of-last-resort facilities
Supervising financial institutions
Regulating payment systems
Their decisions directly affect borrowing costs, credit supply, currency values, and overall financial stability.
2.3 International Institutions
Bodies such as the IMF, World Bank, Bank for International Settlements (BIS), and Financial Stability Board (FSB) create global standards, provide financial aid during crises, and coordinate cross-border regulations. Their involvement becomes crucial during sovereign debt crises and currency collapses.
3. Key Risks to Global Banking Systems
Despite advancements in regulation, global banks face several systemic risks:
3.1 Credit Risk
The possibility that borrowers fail to repay loans. High default rates—especially in corporate or real-estate sectors—can weaken bank balance sheets.
3.2 Liquidity Risk
When banks cannot meet short-term obligations due to insufficient cash. Liquidity crises often trigger bank runs or emergency central bank interventions.
3.3 Market Risk
Changes in interest rates, currency prices, or asset valuations can reduce the value of a bank’s holdings. Sudden rate hikes or stock market crashes may cause large unrealized losses.
3.4 Operational and Cyber Risk
Digitalization increases the risk of cyberattacks on banks, potentially disrupting payment systems or exposing customer data. Technology failures also pose operational threats.
3.5 Contagion Risk
Because banks are interconnected, the failure of one major bank or a country’s financial system can create chain reactions globally. This was seen during:
The 2008 Lehman Brothers collapse
The 2011 Eurozone debt crisis
The 2023 regional bank failures in the U.S.
Interconnectedness magnifies both strength and vulnerability.
4. The Drivers of Financial Stability in the Current Global Environment
4.1 Strong Bank Balance Sheets
Global banks today hold higher capital buffers and liquidity reserves. This increases their ability to withstand market shocks.
4.2 Digital Transformation in Banking
Technology improves efficiency, risk monitoring, and compliance. Real-time data analytics help banks detect stress early and manage exposures more effectively.
4.3 Banking Consolidation
Mergers create larger, stronger banks with diversified operations. This reduces individual institution risk but can also create “too-big-to-fail” challenges.
4.4 Improved Crisis Management Frameworks
Many countries now have:
Deposit insurance
Resolution mechanisms for failing banks
Better stress tests
Contingency funding arrangements
These tools reduce panic and ensure orderly handling of distressed institutions.
5. Emerging Challenges for Global Financial Stability
5.1 Geopolitical Tensions
Trade wars, sanctions, and military conflicts affect currency stability, commodity prices, and cross-border capital flows.
5.2 Inflation and Interest Rate Volatility
High inflation forces central banks to raise rates. Rapid hikes increase borrowing costs and can strain banking sectors—especially in emerging markets.
5.3 Shadow Banking Risks
Non-bank financial institutions—hedge funds, fintech lenders, investment funds—play a growing role but operate with less regulation. Their instability can spill into the banking system.
5.4 Climate and Sustainability Risks
Climate-related disasters, ESG compliance pressures, and the transition to green economies impact credit portfolios, insurance markets, and investment strategies.
5.5 Digital Currencies and Decentralized Finance (DeFi)
While innovation brings opportunities, it also poses risks:
Volatile crypto markets
Lack of regulatory frameworks
Potential loss of monetary policy control
Cyber-vulnerabilities
Central Bank Digital Currencies (CBDCs) may reshape global banking in unpredictable ways.
6. The Path Forward: Strengthening the Future of Global Finance
Ensuring long-term global financial stability requires coordinated efforts across governments, banks, international organizations, and the private sector. Key priorities include:
6.1 Strengthening Regulation and Supervision
Continuous evolution of Basel norms, cyber-resilience frameworks, and cross-border regulatory cooperation is essential.
6.2 Enhancing Financial Inclusion
Stable banking systems must serve not just corporates but also small businesses and individuals. Digital banking, UPI-type platforms, and low-cost financial services reduce inequality and strengthen economies.
6.3 Building Resilient Digital Infrastructure
Banks must invest heavily in cybersecurity, cloud reliability, AI-driven risk analysis, and fraud prevention.
6.4 Sustainable and Responsible Banking
Green financing, climate-risk assessment, and ESG compliance will increasingly shape global credit flows and stability metrics.
6.5 Crisis Preparedness
Regular stress tests, liquidity buffers, and emergency response frameworks help ensure rapid containment of shocks without widespread disruption.
Conclusion
Global banking is the lifeline of modern economies, facilitating capital flow, trade, investment, and innovation. Financial stability depends on well-regulated, well-capitalized, and well-supervised banking institutions that can withstand economic and geopolitical shocks. As globalization deepens and new risks like cyber threats, climate change, and digital currencies emerge, maintaining stability will require constant vigilance, updated regulatory frameworks, and resilient financial infrastructure. Ultimately, the strength of the global banking system shapes the strength of the global economy, influencing growth, employment, and prosperity for billions of people.
“A textbook double top”“A textbook double top, confirmed and retested. A setup with a good risk-reward ratio. Confirmed both technically and fundamentally.”