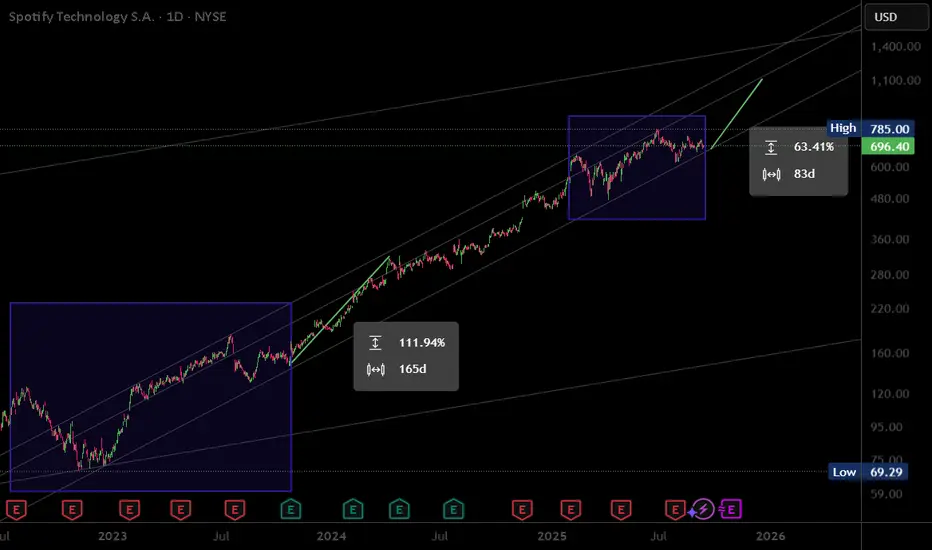
Spotify: Potential Continuation PatternsSpotify rallied to a new high early in the summer. Now, after a period of consolidation, some traders may expect further upside.
The first pattern on today’s chart is the series of lower highs between June 27 and September 9. The streaming-media company pushed above the falling trendline on Thursda
Next report date
—
Report period
—
EPS estimate
—
Revenue estimate
—
3.36 CHF
1.12 B CHF
15.40 B CHF
147.14 M
About Spotify Technology S.A.
Sector
Industry
CEO
Daniel Ek
Website
Headquarters
Luxembourg
Founded
2006
ISIN
LU1778762911
FIGI
BBG00KGDPKM3
Spotify Technology SA engages in the provision of digital music services. It operates through the Premium and Ad-Supported segments. The Premium segment provides subscribers with online and offline streaming access of music and podcasts on computers, tablets, and mobile devices. The Ad-Supported segment offers users with limited on-demand online access of music and unlimited online access of podcasts on computers, tablets, and mobile and smart devices. The company was founded by Daniel Ek and Martin Lorentzon on December 27, 2006 and is headquartered in Luxembourg.
Related stocks

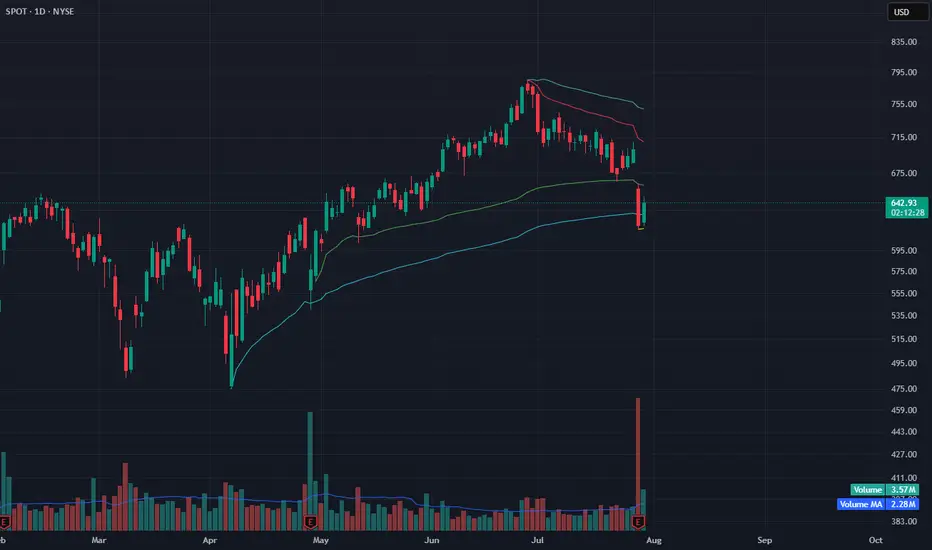
Previously after price made a pattern like this, it went up.In the rectangles I see similar patterns. After the first one the price went up. The earnings pattern similar too. We'll see the next earnings report. I also drew trend lines and/or price channels.
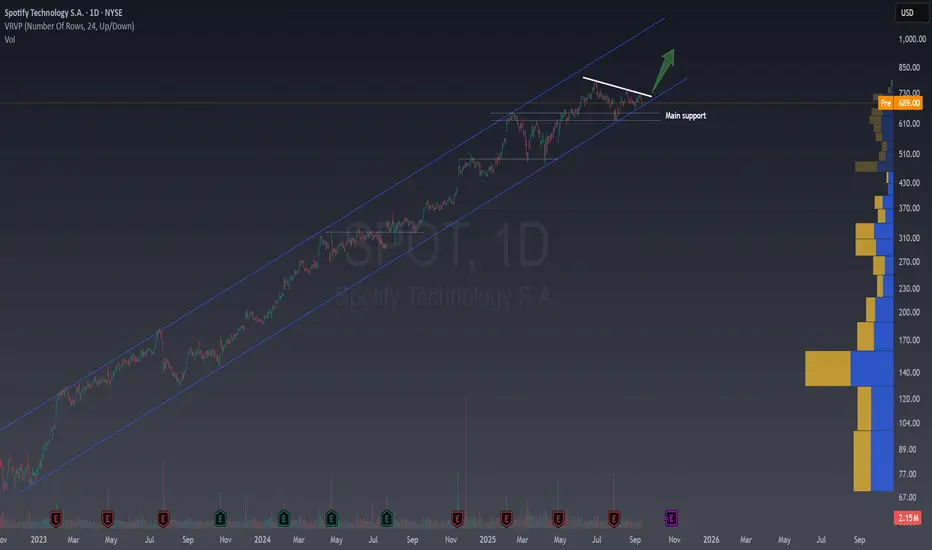
This Is Why Spotify Is In The Radar Of Everyone NowThis Is Why Spotify Is In The Radar Of Everyone Now
NYSE:SPOT has been respecting a strong ascending channel, now testing a key resistance (white line) which could be part of a triangle chart pattern.
🔼 Bullish case : A breakout above resistance could trigger strong momentum and drive price to
in short... Short SPOTTechnically we are in a distribution phase.
Price battling around 50MA, once it fails it gonna test 200MA and bounce a little but gonna continue slide further more
Target 1 - 600
Target 2 - 500
Stop Loss - 760
No wonder if it goes further down to 400 or 300, we'll revisit this later.

When to buy the dip of Spotify?
Prices are at strong support, coinciding also with a 50% retracement level
A slight rise in RSI is a bullish sign
The convergence of the 50 and 20 day EMAs could be a source of resistance
Conclusion: let prices break above the 50 and 20 EMAs and wait for a retracement before buying

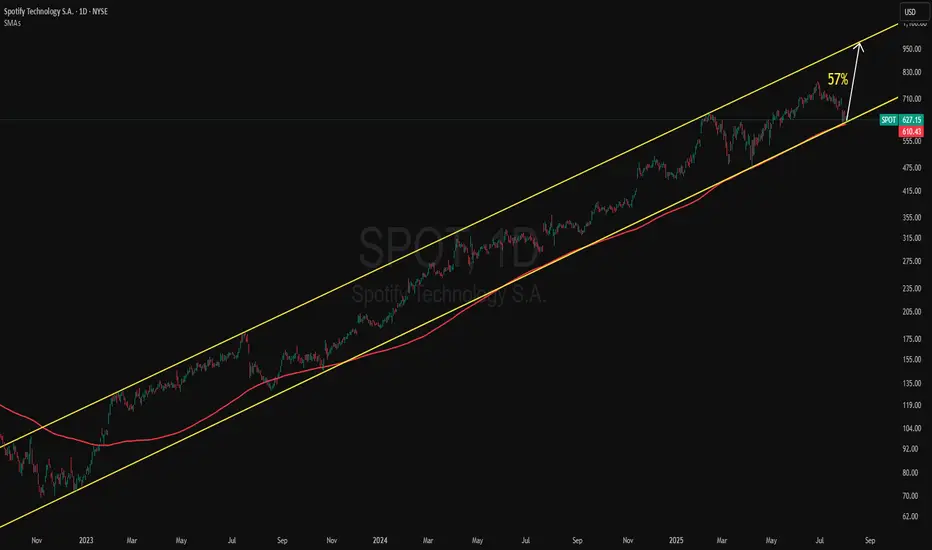
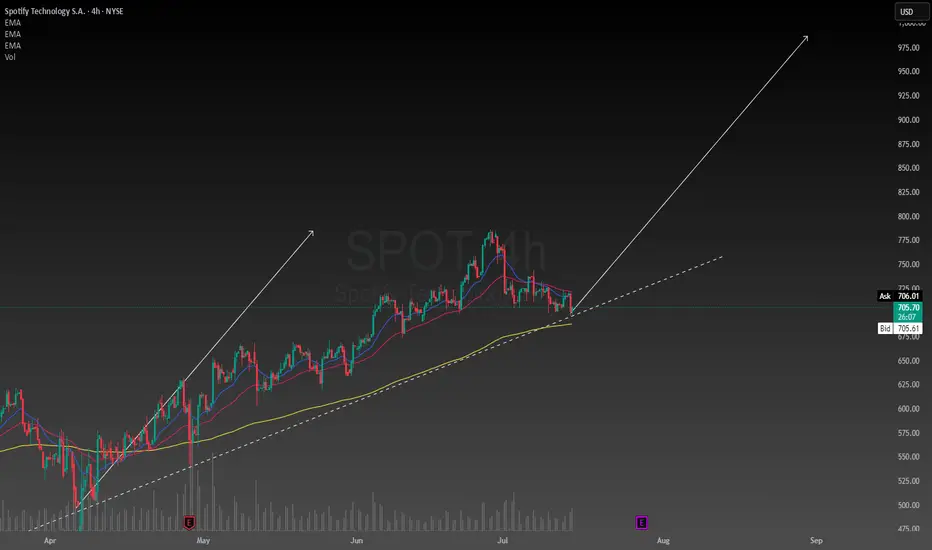
SPOT: Rebounding Off the 150 SMA -- Upper Channel Next?SPOT (Spotify) has been trading within a well-defined ascending parallel channel since late 2022. The recent dip brought price action close to the lower boundary of the channel, right at the 150-day moving average, which acted as support several times in the past.
This confluence between trendline
SPOTIFY-Turn the Music Up!NYSE:SPOT
Why did profit drop?
Spotify reported an operating loss of $75M — at first glance, that looks bad. But there’s logic behind it:
• Increased spending on marketing and podcast development (long-term investment)
• Higher royalty payments — short-term pressure
• Expansion of features and
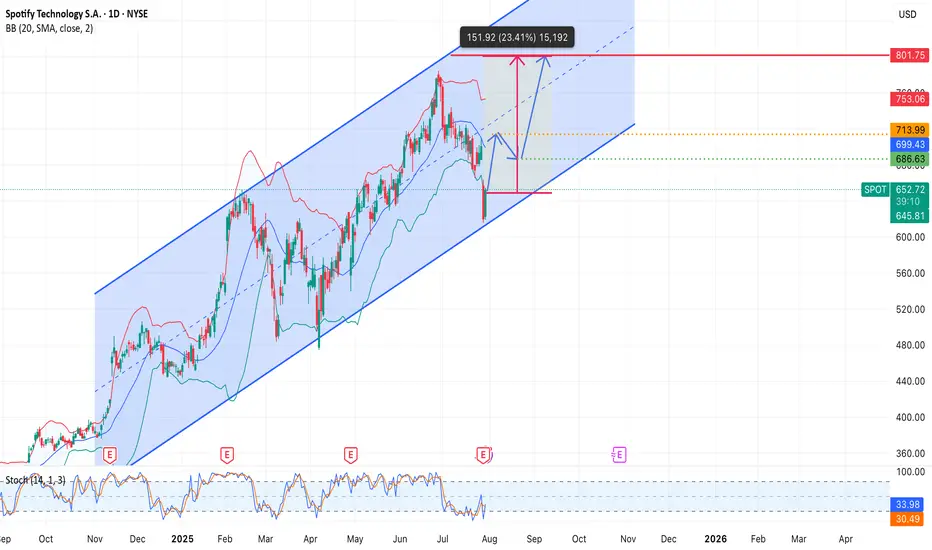
SPOT Reversing at VWAP Support – Signs of Seller ExhaustionAfter a sharp drop, SPOT is showing early signs of reversal at a key anchored VWAP support zone. The intraday bounce occurred on low volume, which may indicate seller exhaustion rather than aggressive dip-buying.
Price is holding near the blue VWAP anchored from the April low, a level that previous
ShortifyI don't post all my trade ideas ahead of time but I will share another short position that I executed before posting, this time in Spotify.
Short entered at $770, stop lost at $790.
Added to my position when we lost the monthly level of support.
The end of the 5 Wave Supercycle.
Trailing stop loss,

Raising the bar for SpotifySpotify has been my favorite stock so far this year. Primarily because resilience in uncertain economies. Subscription-based services, especially freemium models, are seen as defensive. Spotify is the number one music streaming service in the world and unless that changes people will keep using it e
See all ideas
Summarizing what the indicators are suggesting.
Neutral
SellBuy
Strong sellStrong buy
Strong sellSellNeutralBuyStrong buy
Neutral
SellBuy
Strong sellStrong buy
Strong sellSellNeutralBuyStrong buy
Neutral
SellBuy
Strong sellStrong buy
Strong sellSellNeutralBuyStrong buy
An aggregate view of professional's ratings.
Neutral
SellBuy
Strong sellStrong buy
Strong sellSellNeutralBuyStrong buy
Neutral
SellBuy
Strong sellStrong buy
Strong sellSellNeutralBuyStrong buy
Neutral
SellBuy
Strong sellStrong buy
Strong sellSellNeutralBuyStrong buy
Displays a symbol's price movements over previous years to identify recurring trends.
Curated watchlists where SPF is featured.


Frequently Asked Questions
The current price of SPF is 137.50 CHF — it has decreased by −4.51% in the past 24 hours. Watch Spotify Technology SA stock price performance more closely on the chart.
Depending on the exchange, the stock ticker may vary. For instance, on SIX exchange Spotify Technology SA stocks are traded under the ticker SPF.
We've gathered analysts' opinions on Spotify Technology SA future price: according to them, SPF price has a max estimate of 730.26 CHF and a min estimate of 391.63 CHF. Watch SPF chart and read a more detailed Spotify Technology SA stock forecast: see what analysts think of Spotify Technology SA and suggest that you do with its stocks.
SPF stock is 4.73% volatile and has beta coefficient of 1.12. Track Spotify Technology SA stock price on the chart and check out the list of the most volatile stocks — is Spotify Technology SA there?
Today Spotify Technology SA has the market capitalization of 118.35 B, it has decreased by −3.80% over the last week.
Yes, you can track Spotify Technology SA financials in yearly and quarterly reports right on TradingView.
Spotify Technology SA is going to release the next earnings report on Oct 28, 2025. Keep track of upcoming events with our Earnings Calendar.
SPF earnings for the last quarter are −0.39 CHF per share, whereas the estimation was 1.83 CHF resulting in a −121.50% surprise. The estimated earnings for the next quarter are 1.83 CHF per share. See more details about Spotify Technology SA earnings.
Spotify Technology SA revenue for the last quarter amounts to 3.92 B CHF, despite the estimated figure of 3.98 B CHF. In the next quarter, revenue is expected to reach 3.97 B CHF.
SPF net income for the last quarter is −77.40 M CHF, while the quarter before that showed 209.63 M CHF of net income which accounts for −136.92% change. Track more Spotify Technology SA financial stats to get the full picture.
No, SPF doesn't pay any dividends to its shareholders. But don't worry, we've prepared a list of high-dividend stocks for you.
EBITDA measures a company's operating performance, its growth signifies an improvement in the efficiency of a company. Spotify Technology SA EBITDA is 1.69 B CHF, and current EBITDA margin is 9.76%. See more stats in Spotify Technology SA financial statements.
Like other stocks, SPF shares are traded on stock exchanges, e.g. Nasdaq, Nyse, Euronext, and the easiest way to buy them is through an online stock broker. To do this, you need to open an account and follow a broker's procedures, then start trading. You can trade Spotify Technology SA stock right from TradingView charts — choose your broker and connect to your account.
Investing in stocks requires a comprehensive research: you should carefully study all the available data, e.g. company's financials, related news, and its technical analysis. So Spotify Technology SA technincal analysis shows the sell today, and its 1 week rating is sell. Since market conditions are prone to changes, it's worth looking a bit further into the future — according to the 1 month rating Spotify Technology SA stock shows the neutral signal. See more of Spotify Technology SA technicals for a more comprehensive analysis.
If you're still not sure, try looking for inspiration in our curated watchlists.
If you're still not sure, try looking for inspiration in our curated watchlists.