I am bullish on TSLAI have not changed my buy bias for this baby.
II will continue adding TSLA to my portfolio with $360 and $400 as my medium-term take profits.
Share your thought.
If you found this helpful, like, follow and share
TSLA trade ideas

$TSLA: Breakout Wave Dimensions🏛️ Research Notes
Apart from known compression patterns for Tesla, there is another squeeze happening on smaller scale:
That area will be processed to derive the chart-based levels and see how market reacts to them.
Triangle
Breakout Expansion

Follow-through buying on TSLA?Following a one-sided 6.0% gain in Tesla’s share price on Thursday, this helped lift the S&P 500 and Nasdaq to fresh records. As shown in the chart below, the TSLA Stock rallied through a 6M resistance level of US$360.03 to a high of US$368.99, levels which have not been seen since earlier this year.
Further buying could now be seen for the Stock towards the resistance between US$389.72 and US$383.09. However, before reaching said area, a pullback may occur, retesting US$360.03 as support, with a dip into 1M support from US$343.88 possible.
Written by the FP Markets Research Team

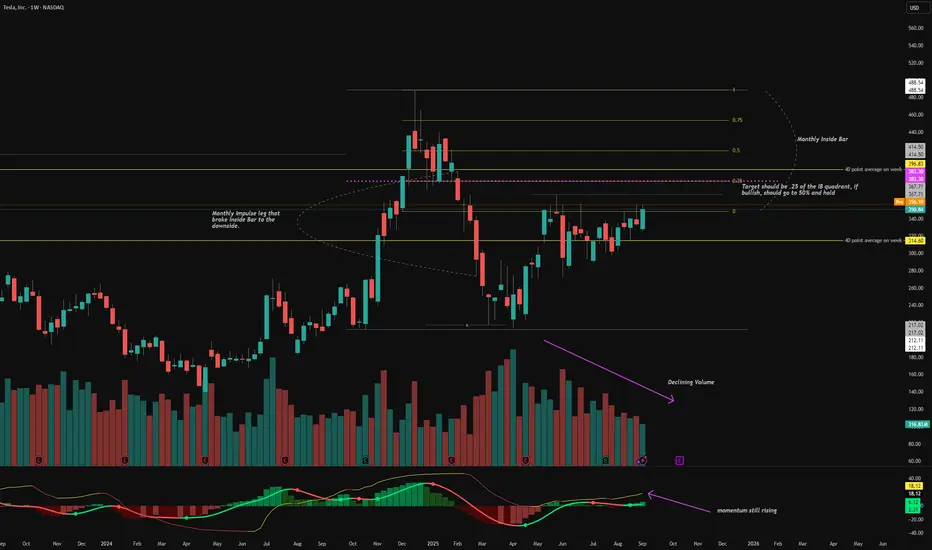
TSLA - LongTSLA looks to be heading to the 25% of the Inside Bar on the monthly. Need to have strict risk management on this incase it falls through. Weekly looks good, with targets of 25% and 50% of the Inside Bar quadrant. TSLA also moves an average 40 points per week, so the upside looks more accurate then downside.
TSLA 1D Time frame Tesla (TSLA) Daily Snapshot
Current Price: $346.97
Change: +0.61% from the previous close
Intraday Range: Not specified
Trend: Bullish continuation
🔎 Key Levels
Resistance:
R1: $347.17 – $350.85 (short-term resistance zone)
R2: $360.56 – $362.90 (medium-term resistance zone)
Support:
S1: $324.94 – $330.14 (short-term support zone)
S2: $313.64 (trendline support)
S3: $302.62 (horizontal support)
📈 Technical Indicators
RSI (14): 57.10 — Neutral
MACD: 5.23 — Sell signal
Moving Averages:
5-day EMA: $339.84 — Buy
50-day SMA: $324.49 — Buy
200-day SMA: $330.33 — Buy
📌 Market Sentiment
Catalysts: Positive market sentiment, with TSLA outperforming key competitors in recent sessions.
Sector Performance: Tech sector showing strength, with TSLA leading gains among peers.
📅 Outlook
Bullish Scenario: A breakout above $347.17 could lead to a push toward $360.56–$362.90.
Bearish Scenario: A drop below $324.94–$330.14 may test support around $313.64.
Overall Bias: Moderately bullish, with positive momentum but facing near-term resistance.

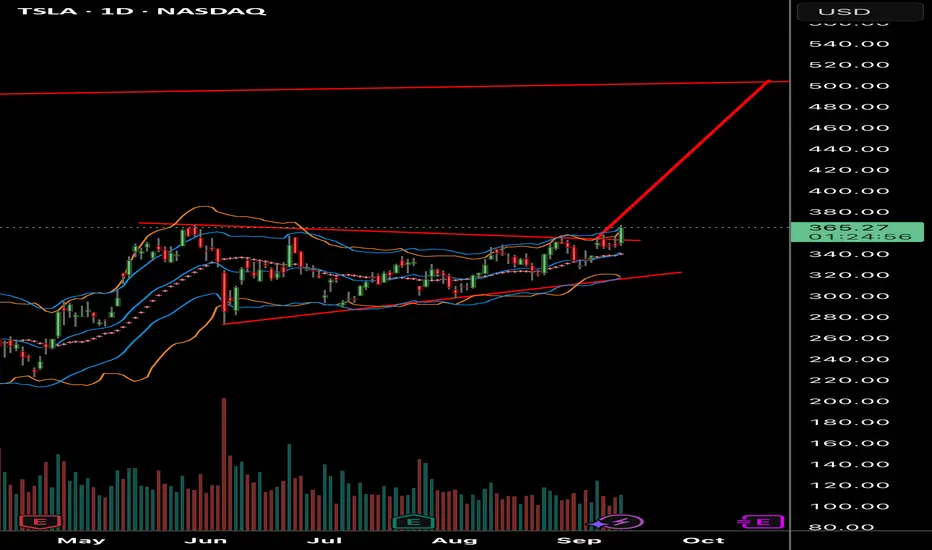
$TSLA - channel breakout on the daily. possible $400 soonTSLA - Stock finally seeing channel breakout after long consolidation. calls above $370 looking good for a move towards $378 and $400. Stock is decent at indicator. needs to hold $365 to hold the breakout move.

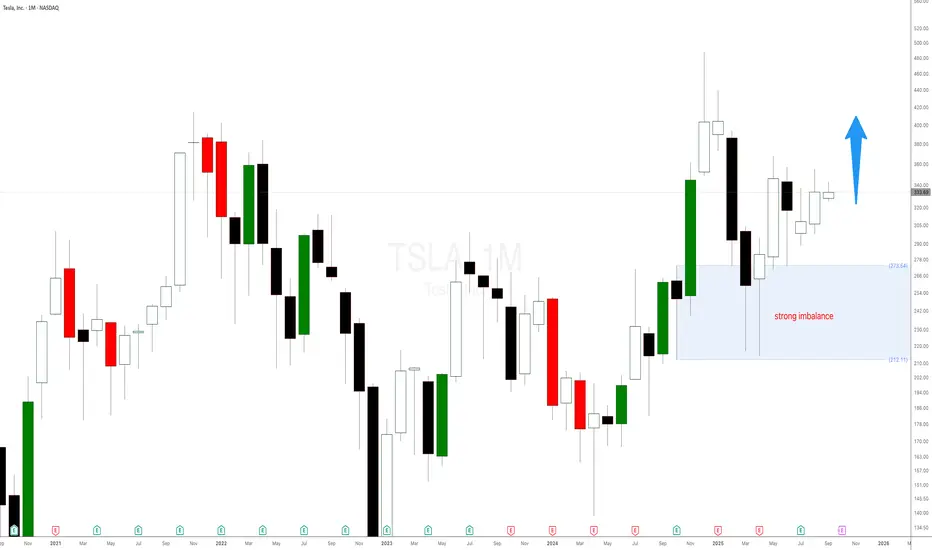
Tesla stock is printing new highs helped by the strong imbalanceTesla stock is printing new highs helped by the strong weekly imbalance as expected and mentioned in a previous Tesla stock analysis. The weekly demand level at $298 is playing out well. There is still a lot of room for NASDAQ:TSLA stock to keep on rallying. You can use the smaller timeframes to add more long positions or new imbalance to trade with even higher probability.
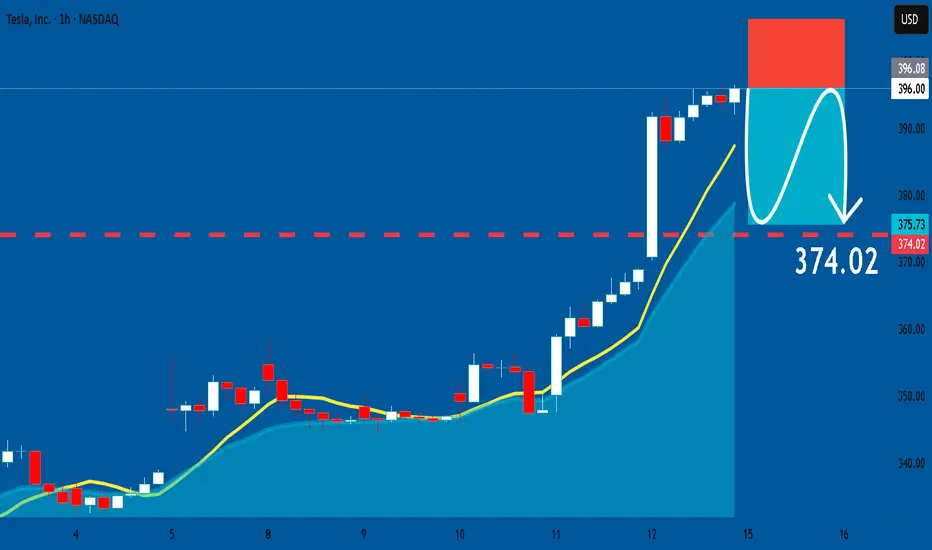
TESLA : Short Signal Explained
TESLA
- Classic bearish setup
- Our team expects bearish continuation
SUGGESTED TRADE:
Swing Trade
Short TESLA
Entry Point - 396.08
Stop Loss - 406.37
Take Profit - 374.02
Our Risk - 1%
Start protection of your profits from lower levels
Disclosure: I am part of Trade Nation's Influencer program and receive a monthly fee for using their TradingView charts in my analysis.
❤️ Please, support our work with like & comment! ❤️
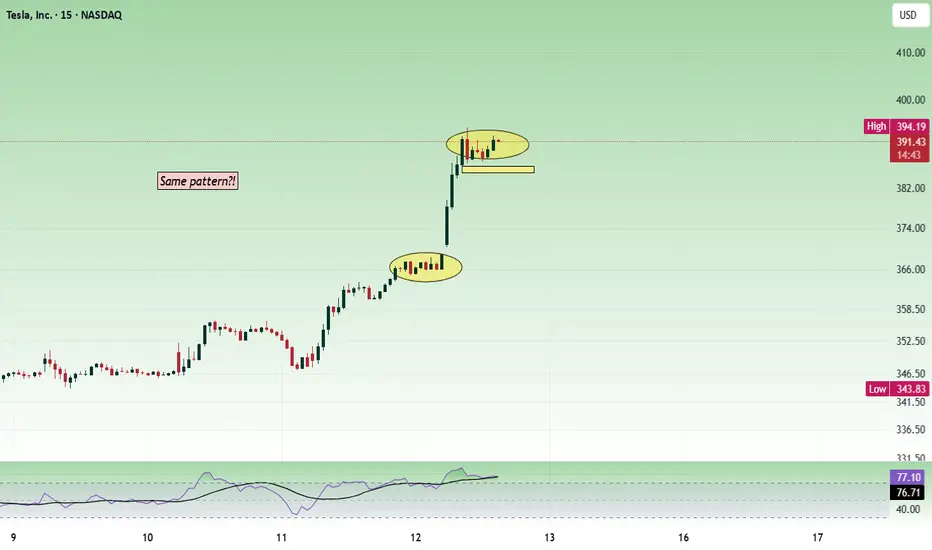
Tesla - consolidation patternUsually, whenever the price gives a breakout, we will think the price will reverse or have a pullback. Sometimes the same trend will continue after a small consolidation. I am seeing similar type of consolidation here.
Buy above 390 with the stop loss of 387 for the targets 383, 396, and 399. We can expect resistance or some profit booking around 400.
Always do your analysis before taking any trade.
TSLA Market Preview for Monday, September 8, 2025,
Price Action & Market Structure
* TSLA is trading around 354–356, up +3.6% overnight, showing relative strength compared to SPY.
* Price broke out of a descending wedge, now consolidating near upper channel resistance.
* Momentum is cooling after the strong overnight run, but structure remains bullish unless price loses 352 support.
Key Levels
* Resistance Zones (Upside Targets):
* 357.5–360 → Near-term rejection zone.
* 362.5 → 365.0 → GEX cluster + Call Wall resistance.
* 370.0 → Major Gamma Wall / Highest positive NET GEX.
* Support Zones (Downside Risk):
* 352.8–354.0 → Local breakout retest support.
* 343.8–345.0 → Strong structural support + previous demand zone.
* 335.0 → HVL anchor + Put hedge support.
Options Sentiment (GEX & IV)
* GEX: Balanced but slightly tilted bullish → Calls 49.4% vs Puts 3.5%.
* IVR: Low at 8.5, options are cheap → potential for strong directional move.
* Gamma Walls:
* 370 → Strong Call Wall (cap).
* 335 → Strong Put Support (floor).
This positioning suggests TSLA is “boxed” between 335 support vs 370 resistance, with intraday swings possible.
Indicators
* MACD (15m): Just made a bearish crossover after extended green histogram → short-term pullback risk.
* Stoch RSI: Rolling down from overbought → signals cooling momentum.
Scenarios for Today
Bullish Case (favored if 352 holds):
* Hold 352–354 support → reclaim 357.5.
* Targets: 362.5 → 365 test, with potential extension to 370 Gamma Wall.
Bearish Case (watch if 352 breaks):
* Lose 352 → retrace quickly to 345 zone.
* If heavy market weakness (SPY fails), could extend to 335 HVL.
Trading Thoughts
* Scalp Longs: Look for bounces near 352–354 support, aiming for 360+.
* Fade Shorts: If price rejects 357.5–360 zone without volume confirmation.
* Stops:
* Longs → below 352.
* Shorts → above 360.5.
Summary
TSLA remains stronge as long as 352 holds, bulls have room to test 360–365 and possibly squeeze toward 370. If 352 fails, expect a deeper retrace to 345–335. Options flow leans bullish, but intraday volatility is likely.
⚠️ This analysis is for educational purposes only, not financial advice. Manage risk and confirm with live price action before trading.

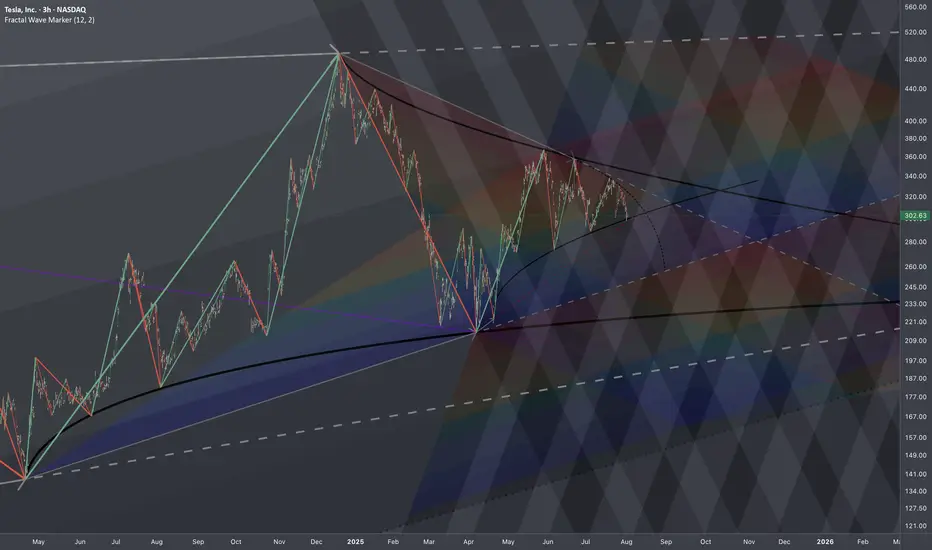
$TSLA: Branching Effect🏛️ Research Notes
Reaching branching effect through cross-cycle interconnection. Alongside I'll test some elements mentioned below.
Local Progressions
Rhyme and levels derived from apparent cycle compression.
Added channels with darkening gradient that cover bullrun from mid 2019, driven by angle of tops.
In the local scope, as price deepens into denser zone the probability of disproportional reaction gets higher. t would probably complete its intermediate and even longer-term cycles before escaping the boundary.

TSLA (daytrading) 2 plan for itPlan 2 could be possible because:
(p1 price is on sma 50 d1,p2 could be sma 200)
TSLA still has a small gap below that might need to be filled.
This week doesn’t look good for the overall market.
I will continue to watch it closely

TSLA 45Minutes Time frameTSLA 45-Minute Snapshot
Current Price: $346.97 USD
Change: +0.18% from the previous close
Intraday Range: Not available
🔎 Technical Indicators
RSI (14): 53.64 — Neutral
MACD: 1.78 — Buy signal
Moving Averages:
5-period SMA: $347.01 — Sell signal
10-period SMA: $346.78 — Buy signal
20-period SMA: $347.82 — Sell signal
50-period SMA: $340.53 — Buy signal
📈 Market Sentiment
Pivot Points:
R1: $347.52
R2: $348.18
R3: $348.95
S1: $345.32
S2: $344.65
S3: $343.99
📅 Outlook
Bullish Scenario: A breakout above $347.52 could lead to a push toward $348.18 and higher.
Bearish Scenario: A drop below $345.32 may test support around $344.65.
Overall Bias: Neutral to slightly bullish, with mixed signals from moving averages.

The Anatomy of a TSLA Retracement TradeBased on a detailed analysis of Tesla's recent price action, a compelling bearish thesis suggests that the stock is poised for a significant retracement. The current market structure indicates that the recent rally may be unsustainable, necessitating a retest of a critical support level to re-establish a more stable foundation.
The Bearish Hypothesis: Retracement to Trendline Support
The core thesis is that the price is set to retrace and test the integrity of the ascending diagonal support trendline. This is not an indication of a full trend reversal, but rather a high-probability correction. T
This corrective phase will likely see the price descend to the lower boundary of the channel. A retest of this key support trendline is a common and healthy technical pattern.
Trade: A short position could be considered upon a clear rejection at the recent highs or upon a decisive breakdown of a minor support level, with the primary profit target being the ascending diagonal support trendline.

TSLA Options Alert $420C–Don’t Miss OutTSLA LEAP Analysis Summary (2025-09-13)
Summary of each model report (key points)
Grok/xAI
Declined to provide an analysis.
Gemini/Google
Strongly bullish LEAP view.
Monthly and weekly RSI rising (monthly 64.2, weekly 70.9) → institutional accumulation pattern.
Low VIX (~14.8) makes LEAP calls relatively cheap.
Recommends BUY LEAP CALLS (Sep 18, 2026). Preferred strike: $370 call (~0.60–0.65 delta). Entry premium quoted ≈ $91.50. Stop: 35% of premium. Confidence ≈ 85%.
Claude/Anthropic
Bullish across monthly/weekly/daily momen...
🔥 Unlock full content: please check out my profile

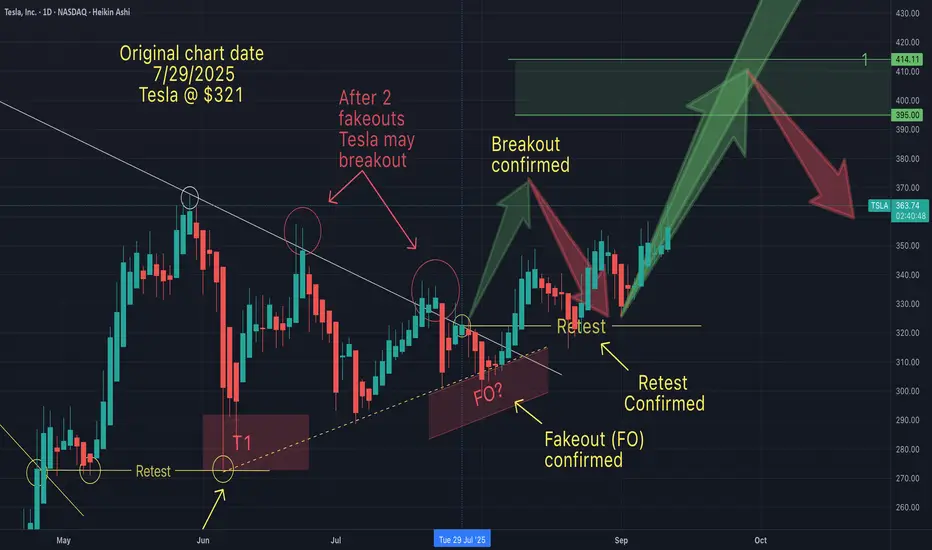
Is Tesla on it's way to $400+On July 29th I suggested that Tesla was about to break out to the upside (after fakeouts).
Then on Sep 4th I suggested that after a restest (of the breakout line), Tesla would begin its climb. This portion of the anticipated pattern now been confirmed.
One question now remains...will Tesla hit my T1 ($395 - $414).
What do you think? I'd like to know what the sentiment is out there. I'd like to hear your thoughts.
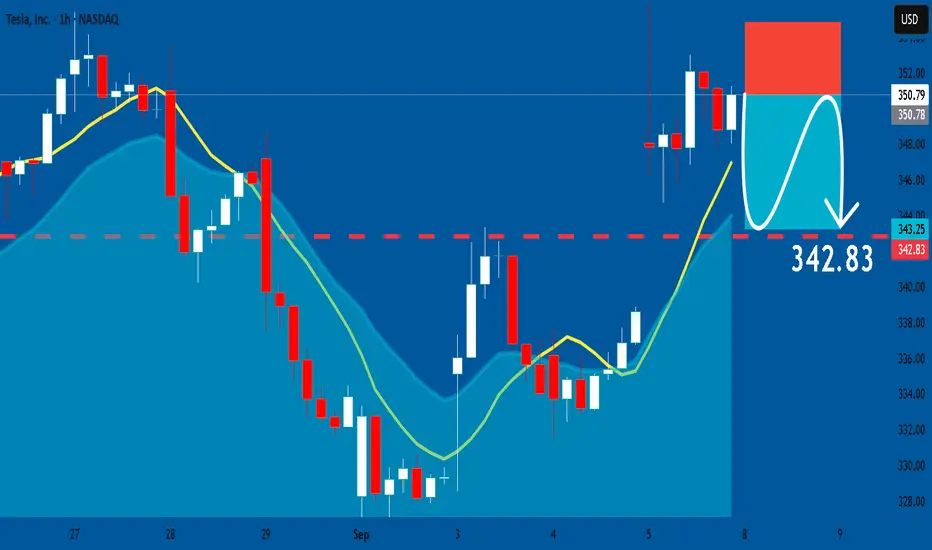
TESLA: Bearish Continuation & Short Signal
TESLA
- Classic bearish setup
- Our team expects bearish continuation
SUGGESTED TRADE:
Swing Trade
Short TESLA
Entry Point - 350.79
Stop Loss - 354.84
Take Profit - 342.83
Our Risk - 1%
Start protection of your profits from lower levels
Disclosure: I am part of Trade Nation's Influencer program and receive a monthly fee for using their TradingView charts in my analysis.
❤️ Please, support our work with like & comment! ❤️
My levels to chase $TSLA bull momentumInvestors are optimistic about potential Fed rate cuts and Tesla’s push into robotics and autonomous driving.
Tesla received a permit to begin testing autonomous vehicles on public roads in Nevada. This follows its limited robotaxi rollout in Austin and signals broader ambitions for nationwide autonomous ride-hailing services.
Elon Musk claims that “80% of Tesla’s value will be Optimus,” referring to its humanoid robot initiative. With EV growth slowing, Musk is pivoting Tesla’s narrative toward AI and robotics.
There are equal numbers of Tesla haters and lovers!

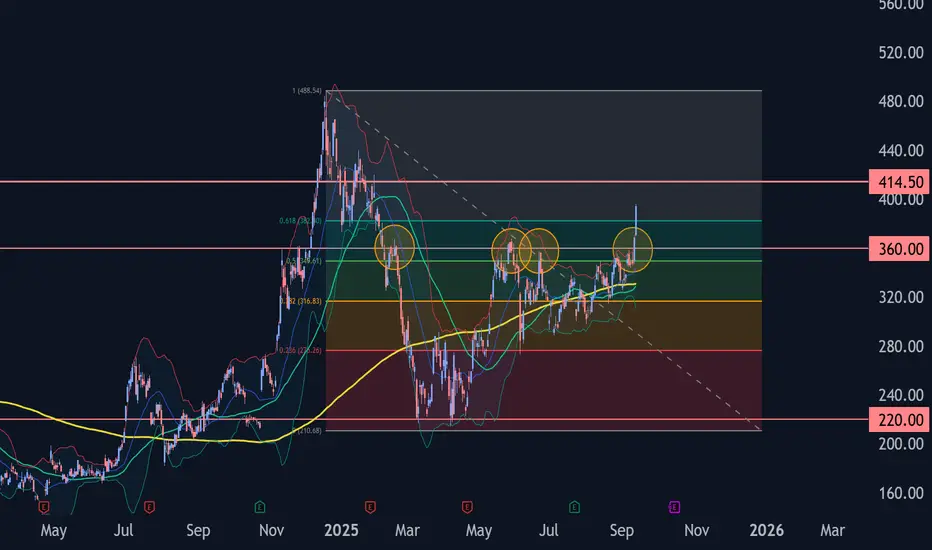
Tesla Wave Analysis – 12 September 2025- Tesla broke resistance area
- Likely to rise to resistance level 414.50
Tesla recently broke the resistance area located at the intersection of the resistance level 360.00 (which has been reversing the price from February), resistance trendline of the daily up channel from July and the 50% Fibonacci correction of the downward impulse from December.
The breakout of this resistance area accelerated the active impulse wave 3 of the intermediate impulse wave (3) from June.
Tesla can be expected to rise to the next resistance level 414.50 (target price for the completion of the active impulse wave 3).
TSLA Volatility Contraction Pattern (VCP) LONG When TSLA breaks above 350 and closes, the price will launch to $390 very quickly.
A VCP is a technical pattern, showing lessening declines in a range bound formation. A bull flag showing higher-lows is the best, as seen with TSLA.
Volatility is going to breakout sharply to the upside. If you TSLA above 350 just buy and hold, you’re too late trying to get a better deal.
🚀🚀🚀🌖
Could we see another Bullish leg on #TSLAmore consolidation here will confirm this wave scenario with targets of
324
384
The invalidation of this scenario is the break of 240.7 (-5%)
Trade safe

TSLA about to POPClear play that I’ve been sharing with friends and it’s playing out perfectly so far