$TSLA Daily Bands Finally TightNASDAQ:TSLA daily bands are finally tight. Can see a bigger move here. OTM calls came in at the lows this morning. 350C 11/21/25 @ 25.43 for 2.5 million
TSLA trade ideas
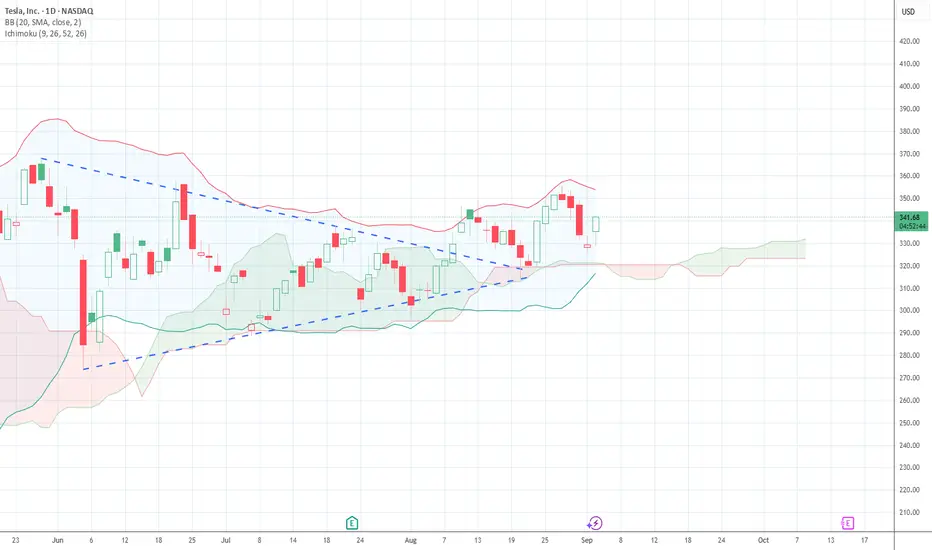
TSLA support $324.48 has to hold for longTSLA bounced off $35 range support this morning on 4 hour was oversold. Needs to hold $324.48 bottom of uptrend support to see wave 5 target of $426 otherwise the trade is no longer valid and will need to wait for another support and oversold condition to go long

#TESLA - $40 Swing?Date: 14-08-2025
#Tesla - Current Price: 339
#Tesla Pivot Point: 339 Support: 331 Resistance: 347
#Tesla Upside Targets:
| 🎯 Target 1 | 356 |
| 🎯 Target 2 | 365 |
| 🎯 Target 3 | 374 |
| 🎯 Target 4 | 384 |
#Tesla Downside Targets:
| 🎯 Target 1 | 323 |
| 🎯 Target 2 | 314 |
| 🎯 Target 3 | 304 |
| 🎯 Target 4 | 295 |
#TradingView #Nifty #BankNifty #DJI #NDQ #SENSEX #DAX #USOIL #GOLD #SILVER

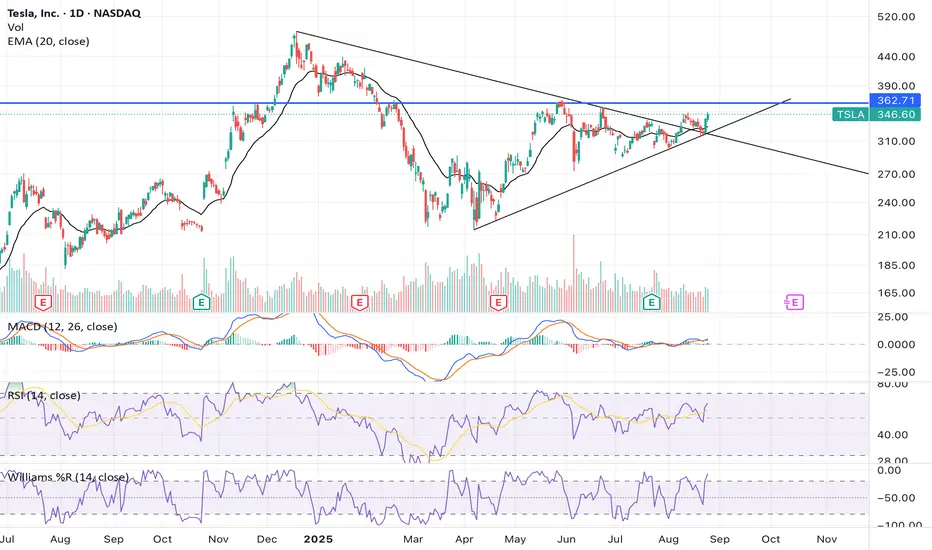
Tesla, it cant be this easy.Tesla is following the trendlines like a FINRA book would have you believe, which makes me suspicious. Just the same, dont fight whats in front of you. Should run into some resistance from 362ish. Stay nimble.
TSLA – Daily Fib Continuation: Watch $350–355 for Break & Go (taTL;DR: TSLA is holding above the 0.5 retrace (~$334). A daily close above $355 opens $366 → $372 → $381. Lose $334 → $330 and the setup degrades toward $324/314.
Thesis
The prior swing’s Fibonacci map shows confluence at $350–355 (0.786/0.886 + round-number supply).
Structure is compressing above $334–335 support. A clean break/hold above $355 would likely trigger an extension leg to 1.272/1.414/1.618 at $366.7 / $372.5 / $381.0.
Below $334, momentum likely rotates back into the $330 → $324 → $314 demand ladder.
Key Levels
Support: $334.5 (0.5), $330.0 (0.382), $323.9 (0.236), $314.2 base
Trigger/Resistance: $347–350 (0.786–0.886), $355.5 (1.0)
Upside Targets: $366.7 (1.272) / $372.5 (1.414) / $381.0 (1.618) then $396.7 / $408.0 / $422.2 / $444.9
Trade Plan (alerts + confirmations, no auto-trading)
Scenario A – Break & Go (preferred)
Confirmation: Daily close above $355.
Execution: Drop to M15 for structure; take a retest of $350–355 as support.
M5 confirm: Bullish engulfing + MACD uptick.
Risk: Invalidation below $347 (or last M15 swing-low).
Targets: $366.7 → $372.5 → $381.0 (scale out).
Scenario B – Pullback Buy
Price tags $334–336 and holds (wicks rejection).
M15 forms HL; M5 prints engulfing + MACD cross.
Risk: Invalidation below $329.9.
Targets: $347 → $355 → $366.7.
Scenario C – Bearish Breakdown
Invalidation of bull idea: Full M15 body below $329.9 → look for $324 → $314. No longs until reclaimed.
Risk (keep it tight)
Risk %: 0.5–1% per idea.
Placement: Below invalidation or last M15 swing.
Scaling: 30/30/40 across targets; move stop to breakeven after Target 1.
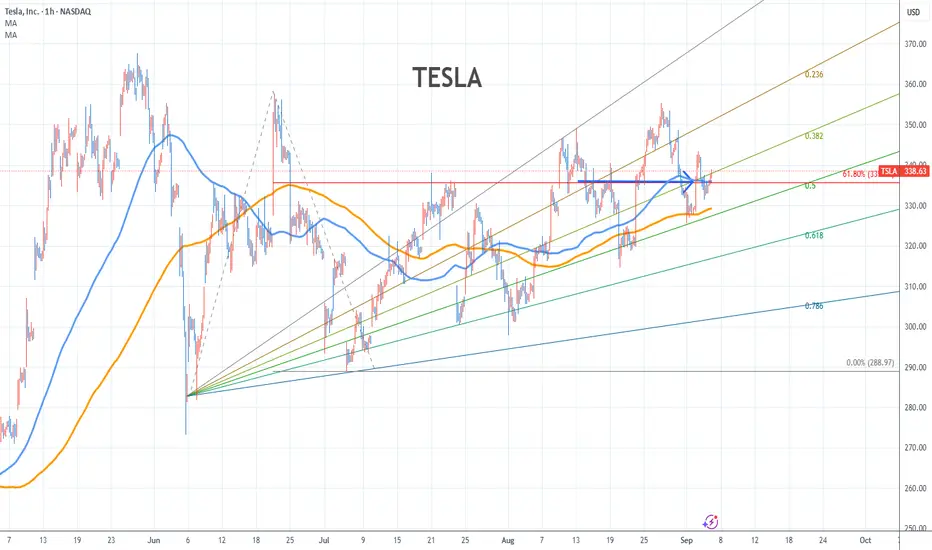
Tesla Stock Chart Fibonacci Analysis 090425Trading Idea
1) Find a FIBO slingshot
2) Check FIBO 61.80% level
3) Entry Point > 335/61.80%
Chart time frame:B
A) 15 min(1W-3M)
B) 1 hr(3M-6M)
C) 4 hr(6M-1year)
D) 1 day(1-3years)
Stock progress:A
A) Keep rising over 61.80% resistance
B) 61.80% resistance
C) 61.80% support
D) Hit the bottom
E) Hit the top
Stocks rise as they rise from support and fall from resistance. Our goal is to find a low support point and enter. It can be referred to as buying at the pullback point. The pullback point can be found with a Fibonacci extension of 61.80%. This is a step to find an entry-level position. 1) Find a triangle (Fibonacci Speed Fan Line) that connects the high (resistance) and low (support) points of the stock in progress, where it is continuously expressed as a Slingshot, 2) and create a Fibonacci extension level for the first rising wave from the start point of the slingshot pattern.
When the current price goes over the 61.80% level, that can be a good entry point, especially if the SMA 100 and 200 curves are gathered together at 61.80%, it is a very good entry point.
As a great help, TradingView provides these Fibonacci speed fan lines and extension levels with ease. So if you use the Fibonacci fan line, the extension level, and the SMA 100/200 curve well, you can find an entry point for the stock market. At least you have to enter at this low point to avoid trading failure, and if you are skilled at entering this low point, with the fibonacci6180 technique, your reading skill of to chart will be greatly improved.
If you want to do day trading, please set the time frame to 5 minutes or 15 minutes, and you will see many of the low points of rising stocks.
If you prefer long-term range trading, you can set the time frame to 1 hr or 1 day
What do you think about TSLA?!If it goes down it cannot be a small move. If it goes up it will be a common pattern (consolidation then breakout).
I think we well see it in two or three days!

Check if it can rise above 347.21
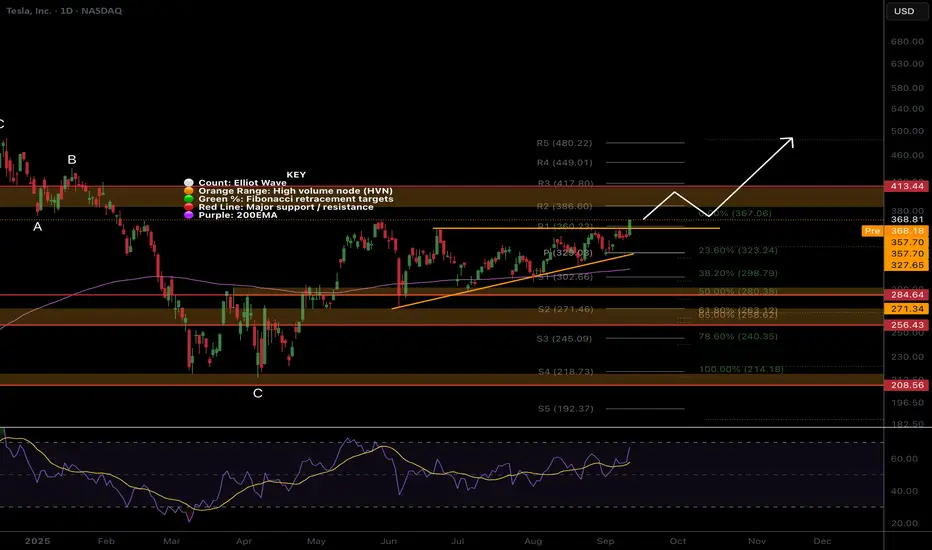
Hello, traders!
Follow us to get the latest updates quickly.
Have a great day!
-------------------------------------
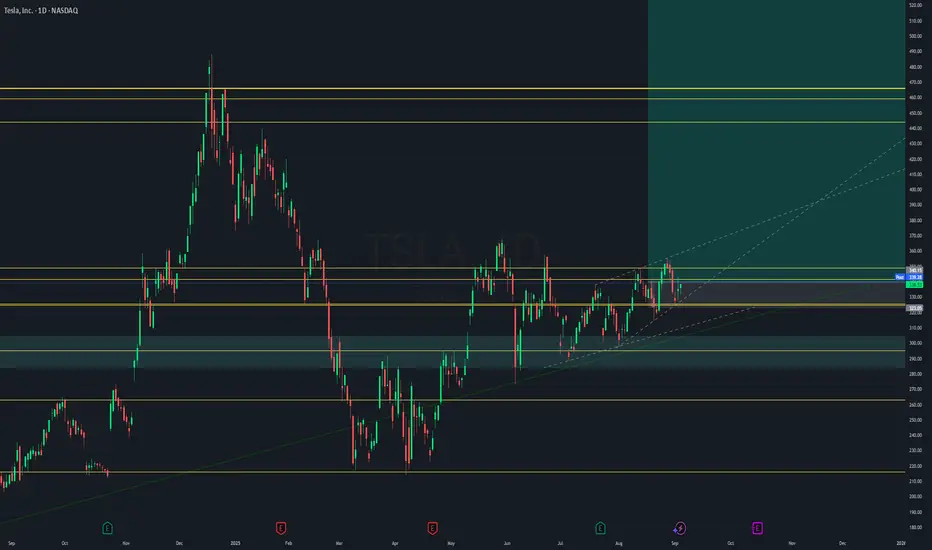
(TSLA 1D chart)
The key is to determine which direction the price breaks out of the two support and resistance areas of 268.07-311.48 and 347.21-382.40.
For a step-up trend to occur, the price must remain above 334.09-347.21.
However, a step-up trend is highly likely only if the price rises above the support and resistance levels of 382.40 and 421.06 on the 1W and 1M charts.
Even so, a larger increase is likely if the price rises above the 334.09-347.21 range on the 1D chart.
-
The 268.07-311.48 range also falls within the HA-High indicator.
Therefore, it's important to remember that the current position is not a buy position, but rather a sell position.
However, for new buys, it's best to initiate them when support is found near the M-Signal indicator on the 1M chart, if possible.
Therefore, when the 268.07-311.48 range acts as a support zone, it can be considered a buying opportunity.
However, since it's within the HA-High indicator zone, trades should be executed with short and quick responses.
The key volatility period is around October 7th, but before that, we should check the movements around September 5th and September 12th.
At this time, the trend is likely to be determined by which direction the price moves: the 268.07-311.48 range or the 347.21-382.40 range.
-
Thank you for reading to the end.
I wish you successful trading.
--------------------------------------------------

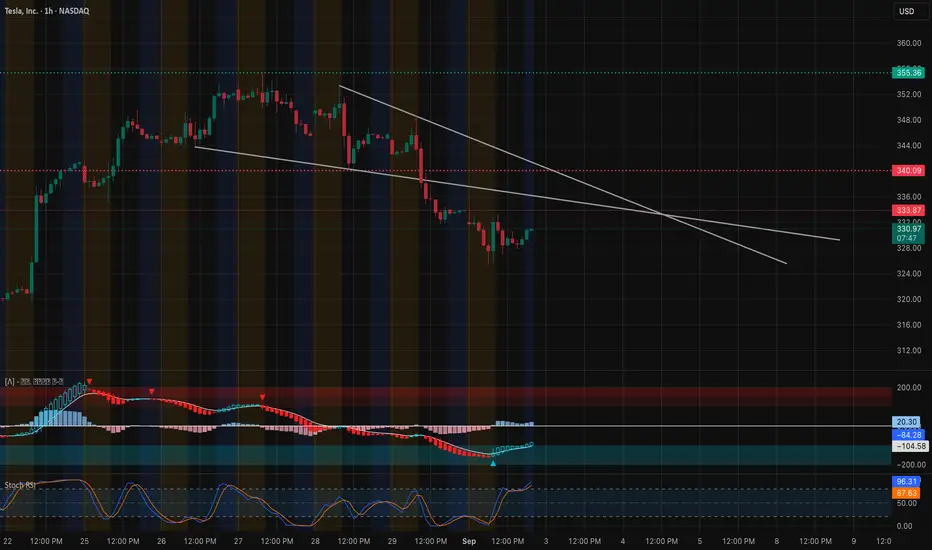
TSLA Technical Analysis-September 3Tesla remains in a short-term downtrend, capped by descending resistance lines. Price is hovering around 330, trying to base after multiple failed rallies. MACD is curling higher, showing early bullish divergence, while the Stoch RSI is lifting from oversold, suggesting some room for upside momentum if buyers step in.
* Resistance:
* First test sits at 333–335, right at descending trendline resistance.
* If cleared, the next upside targets are 342.5 → 345, with stronger supply stacked at 350–355.
* Support:
* Immediate support is 325, reinforced by the put wall.
* A breakdown below opens risk into 322.5 and deeper toward 315–314, which marks the recent swing low and key defense for bulls.
Trend remains pressured, but signs of stabilization are emerging — bulls need to reclaim 335 to start shifting momentum.
🔍 Options / GEX Confirmation
* Resistance Clusters:
* 335 confirmed as resistance by options flow.
* Above that, 345–350 aligns with major call walls, matching chart supply zones.
* Support Layers:
* 325 → strong put support.
* 322.5 and 320 → layered GEX support levels.
* 315 → final line of defense; losing this risks accelerating downside.
This confirms the chart setup: TSLA is boxed between 325–335, with the next directional break likely defining momentum into next week.
🎯 Trade Scenarios
* Bullish: Break above 335 with volume → upside targets 342.5 → 345 → 350.
* Bearish: Rejection at 333–335 and failure to hold 325 → opens downside to 322.5 → 315.
🧠 Final Take
TSLA is at a decision zone between 325–335. Bulls defending 325 and breaking 335 could spark a rally into the 340s, but failure to hold support risks a retest of 315. Options data confirms these levels as the critical battlegrounds.
TESLA Bullish Wave C still underway...NASDAQ:TSLA is a tough count, the entire macro chart looks like a complex correction (wave 4?) with many series of 3 wave structures.
A triangle in wave B of the current wave appears complete, leading to a terminal thrust up with a target of the High Volume Node resistance at $410 followed by a poke above the swing high touching the R1 pivot at $548.
RSI remains at the EQ.
Analysis is invalidated below the wave B triangle.
Safe trading

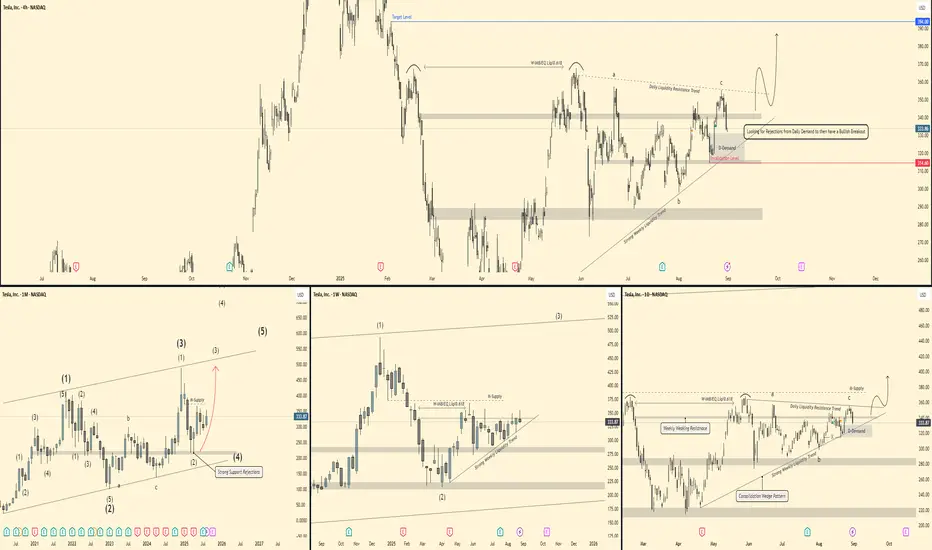
Tesla - Mutli-timeframe breakdown 🕰 Monthly View
Price is respecting a long-term ascending channel.
Strong rejections from support confirm bullish momentum.
Current wave count suggests we are working through a larger impulsive structure – potential for Wave (3) continuation higher.
If momentum holds, upside could target the 450–500 zone in the longer run.
📆 Weekly View
Structure shows a 3-wave correction complete (ABC) into demand.
Price has tapped weekly demand + liquidity trendline.
Currently bouncing, with a breakout potential toward 375–400 (supply zone).
Breakout of the wedge pattern would confirm strength and continuation higher.
📅 Daily View
Price is reacting off Daily Demand (≈320–325 zone).
Strong liquidity resistance trend overhead (≈355–365).
If rejections hold and demand stays valid, a bullish breakout setup forms → target near 390–400.
Invalidation if we close below 314 (daily demand break).
⏱ 4H View
Local liquidity sweep into demand.
Bullish scenario: push toward 350–355 short-term.
Watch for confirmation: rejection candles + momentum shift needed before entry.
🎯 Bias & Trade Idea
Bias: Bullish (buy from demand)
Entry Zone: 320–330 (Daily Demand)
Targets:
Short-term → 355
Mid-term → 390–400
Invalidation: Daily close below 314
⚠️ Risk Note
Tesla is highly volatile. Stick to clear confirmations at demand before entry, and manage risk tightly below invalidation.
TESLA RISING SUPPORT|LONG|
✅TESLA is trading in an uptrend
Along the rising support line
Which makes me bullish biased
And the pair is about to retest the rising support
Thus, a rebound and a move up is expected
With the target of retesting the level above at 350$
LONG🚀
✅Like and subscribe to never miss a new idea!✅

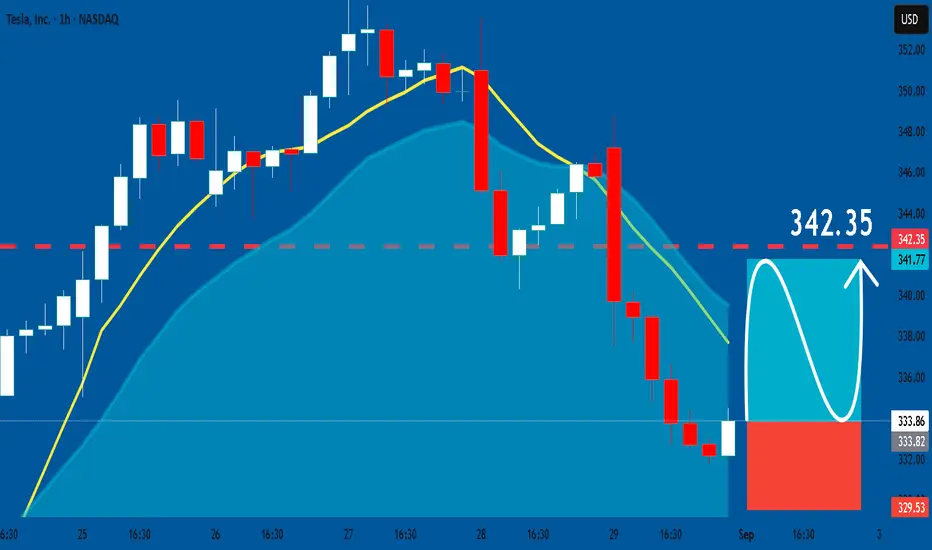
TESLA: Long Trade with Entry/SL/TP
TESLA
- Classic bullish setup
- Our team expects bullish continuation
SUGGESTED TRADE:
Swing Trade
Long TESLA
Entry Point - 333.86
Stop Loss - 329.53
Take Profit - 342.35
Our Risk - 1%
Start protection of your profits from lower levels
Disclosure: I am part of Trade Nation's Influencer program and receive a monthly fee for using their TradingView charts in my analysis.
❤️ Please, support our work with like & comment! ❤️
TESLA Expected Growth! BUY!
My dear friends,
Please, find my technical outlook for TESLA below:
The price is coiling around a solid key level - 333.86
Bias - Bullish
Technical Indicators: Pivot Points High anticipates a potential price reversal.
Super trend shows a clear buy, giving a perfect indicators' convergence.
Goal - 344.59
Safe Stop Loss - 327.03
About Used Indicators:
The pivot point itself is simply the average of the high, low and closing prices from the previous trading day.
Disclosure: I am part of Trade Nation's Influencer program and receive a monthly fee for using their TradingView charts in my analysis.
———————————
WISH YOU ALL LUCK

TSLA has got the momentum ^.^Brother Elon is back on business. 1 trillion bonus Yummy!
Technicals are favor Tesla Stock,
Large Greenbar has broken out of resistance.
More investors are joining the rally, This may break previous highs.
Come and make some money.
Risk ? Don't worry about it because its 1 Trillion.

TESLA stock to gain more heights again!Tesla has finally broke out of that ardous consolidation it was in! investors can look for the buying opportunities for a probable pullback on a shown order block!
Tesla Near Term SpeculationBuilding on the flag formation from the past 3 years, its possible an rising wedge could form. Very early days and highly speculative, but if price plays out somewhat like my chart, an ascending wedge could form. Indicating that Tesla may have hit a near/mid term high and can't won't break through for a few years, with several implied price crashes going into 2026 and 2027.
Economic conditions and the apparent slow down in sales, would also support the technical analysis with macro fundamentals.
Very curious to see how things play out, again, highly speculative, just wanted to post to remind myself to keep and eye on this. The potential volatility is presenting interesting trades ahead.

$TSLA Approaching Noisy Area?Tesla has been on a tear the past 2 days. It's difficult to catch the top and I may be wrong, but we're approaching a noisy area when following the trend line in the daily & weekly chart. I think it will re-trace back downwards.

Breakout time $TSLA$570 inbound
The start of the Energy abundance and Robotaxi era is upon us. Autonomous robots will transport everything within the next 10 years.
Optimus wave will follow shortly behind over the next 5 years.
TAM Potential: 10X autonomous transport.
How high this eventually goes is almost laughable, time to sit back and watch compound growth and all its magical glory.
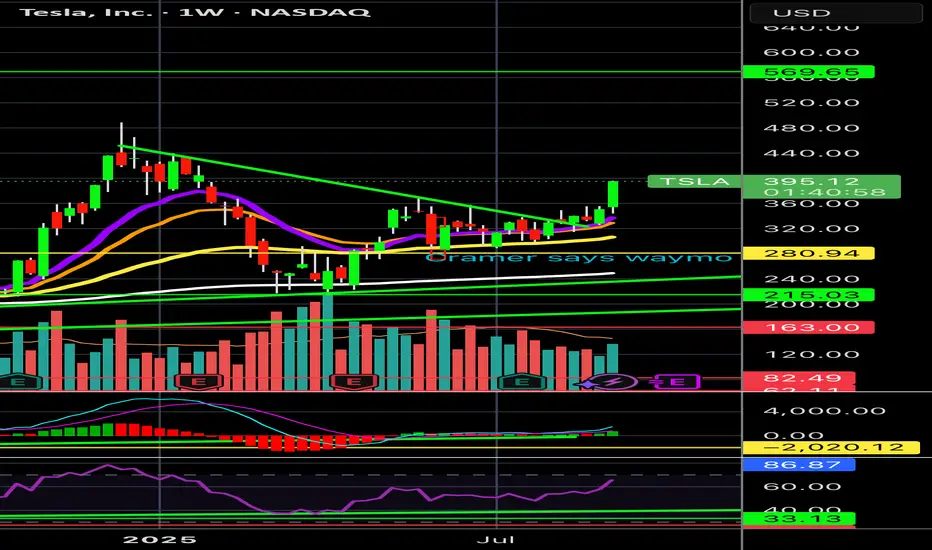
Tesla Wave Analysis – 12 September 2025- Tesla broke resistance area
- Likely to rise to resistance level 414.50
Tesla recently broke the resistance area located at the intersection of the resistance level 360.00 (which has been reversing the price from February), resistance trendline of the daily up channel from July and the 50% Fibonacci correction of the downward impulse from December.
The breakout of this resistance area accelerated the active impulse wave 3 of the intermediate impulse wave (3) from June.
Tesla can be expected to rise to the next resistance level 414.50 (target price for the completion of the active impulse wave 3).
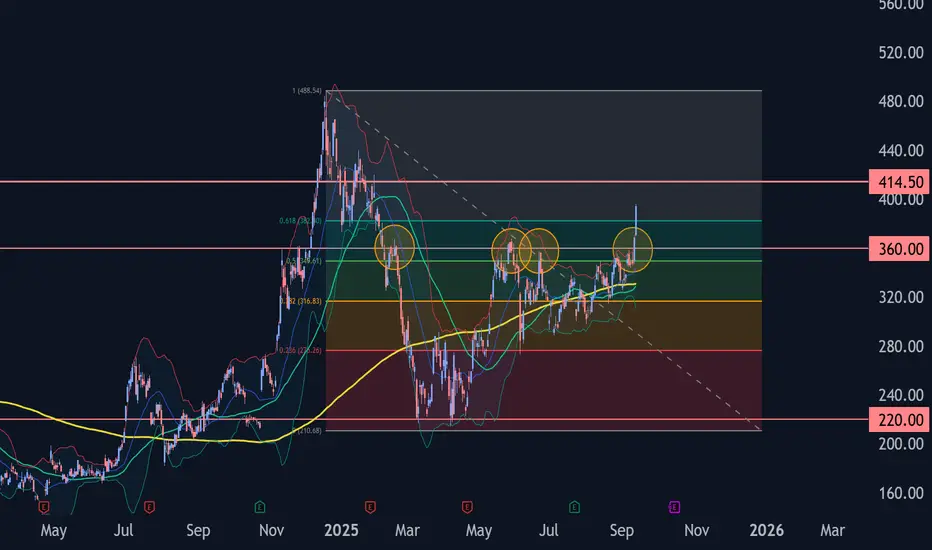
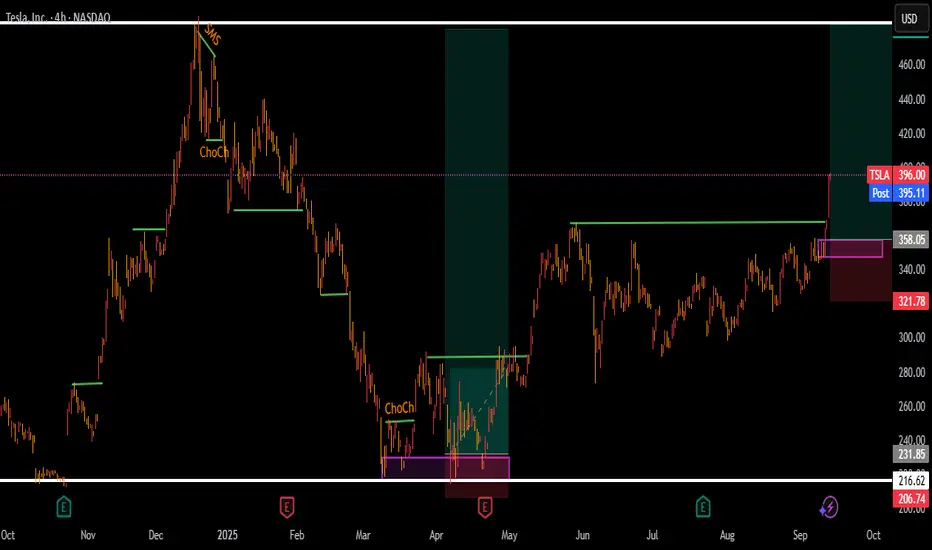
Tesla Breakout? For the majority of the calendar year TESLA has been in a range between $220 - $365 with a clear midpoint of $295.
From March to the beginning of May TESLA bounced between range low and the midpoint until finally breaking through into the upper half of the range where it has stayed ever since. However, there is a clear diagonal resistance level that is preventing higher highs.
So will TESLA breakout, or will it lose the midpoint? Structurally it is clear that the bulls have a set level they are happy to buy at (Midpoint) but the bears are getting more aggressive with their selling, hence the lower highs. This compression inevitably leads to an impulse move but the direction is not so clear.
Bullish scenario: A clean breakout with volume that makes a new higher high, signaling a shift in structure. A pullback and retest of the breakout would be an ideal opportunity to go long and aim for that range high before expecting resistance.
Bearish scenario: The lower highs keep printing until the midpoint is lost and price accepts below it, that would then signify to me the new trading range is between Range Low and Midpoint.
The fakeout scenario is a risk but with price so close to the midpoint already it follows the same invalidation criteria as the bullish scenario, the midpoint is vital to both sides.

TSLA Barrier Triangle Breakout!Tesla’s initial triangle analysis was invalidated by a larger barrier triangle which price price is now breaking out of with a pattern target of the HVN resistance at $400. Continued upside should see price ‘running the pivots’ the R5 target at $480.
RSI is getting into overbought but has room to grow.
Standard deviation Band Analysis
Price has been riding the fair value regression line for some time and appears to finally be breaking out above it. Previous breakout saw a rejection at the SD+2 threshold $500 which is now around $550, so watch out for an initial rejection here. Continued upside could see an irrational price around $1000.
SD band charts available on my Substack as I can't share here! Link in Bio, its free!
Possible retrace before upside moveThe initial upward move from 214 is corrective in nature. Since the current correction to 273 doesn't seem to be proper ABC correction, I am expecting further C wave correction to the Green box. Breaking the Red Box and the trendline with a retest will invalidate further downward correction. Based on the Major Indexes structure, I am not expecting Tesla to retrace below 213 as depicted by red line .
Note
**Disclaimer** : All details shared here is for educational purpose only. Please do your own research and consider appropriate risk management before making short term or long-term investment decisions.
Approach Market always with probabilities and make sure risk management in place.
Request your support by like, comment and follow
