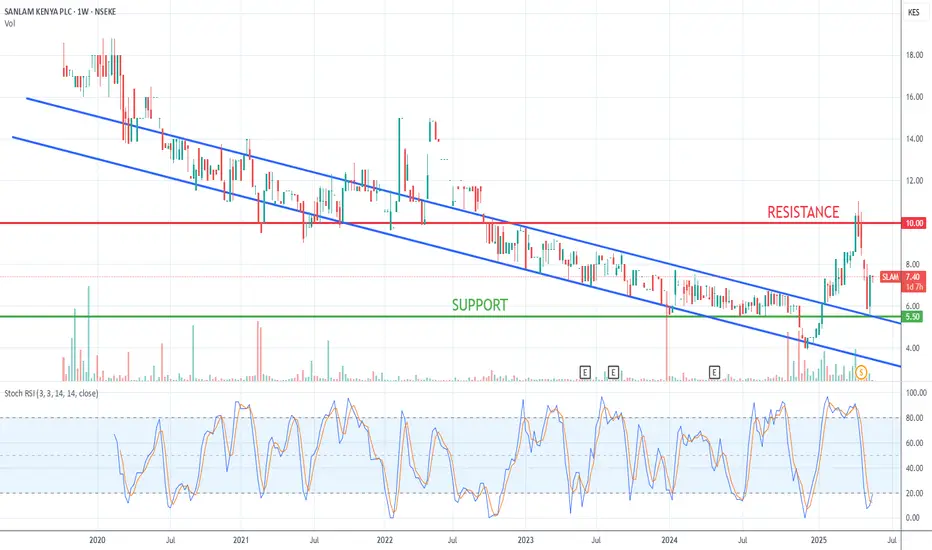
Sanlam V2 analysisWe already shared an analysis on Sanlam, and the position did extremely well. I am keeping it simple for future positioning as long as fundamentals remain attractive.
1. Accumulate between Kes 6 & 8
2. If the stock price breaks above kes 10.00 resistance, it will probably trade in a channel, with k
Sanlam Kenya PLC
No trades
3.08 KES
959.87 M KES
12.94 B KES
120.16 M
About Sanlam Kenya PLC
Sector
Industry
CEO
Patrick Tumbo
Website
Headquarters
Westlands
Founded
1946
IPO date
Apr 28, 1995
Identifiers
2
ISIN KE0000000414
Sanlam Kenya PLC is a holding company, which engages in the provision of long-term insurance services. It operates through the following business segments: Life Risk, Life Savings, Participating, and Non-Life segments. The Life Risk segment provide protection against risk of premature death, disability or critical illness and, in the case of annuity contracts, extended longevity. The Life Savings segment provide both savings and protection. The Participating segment involves flexible savings products that allow policyholders to benefit from participating in the performance of a wide range of underlying items. The Non-life segment issues contracts to corporate and individual customers. The company was founded on October 26, 1946 and is headquartered in Westlands, Kenya.
Related stocks

SANLAM KENYASanlam has a predictable price action that I have been using to day trade or weekly trade the stock. This is the chart I have used this year to look for entries and exits.
For long-term investors, look at the Stochastic, RSI chart.
Sanlam has the potential for a profitable short-term trade or a
See all ideas
Summarizing what the indicators are suggesting.
Oscillators
Neutral
SellBuy
Strong sellStrong buy
Strong sellSellNeutralBuyStrong buy
Oscillators
Neutral
SellBuy
Strong sellStrong buy
Strong sellSellNeutralBuyStrong buy
Summary
Neutral
SellBuy
Strong sellStrong buy
Strong sellSellNeutralBuyStrong buy
Summary
Neutral
SellBuy
Strong sellStrong buy
Strong sellSellNeutralBuyStrong buy
Summary
Neutral
SellBuy
Strong sellStrong buy
Strong sellSellNeutralBuyStrong buy
Moving Averages
Neutral
SellBuy
Strong sellStrong buy
Strong sellSellNeutralBuyStrong buy
Moving Averages
Neutral
SellBuy
Strong sellStrong buy
Strong sellSellNeutralBuyStrong buy
Displays a symbol's price movements over previous years to identify recurring trends.
Frequently Asked Questions
The current price of SLAM is 9.00 KES — it has increased by 0.22% in the past 24 hours. Watch Sanlam Kenya PLC stock price performance more closely on the chart.
Depending on the exchange, the stock ticker may vary. For instance, on NSEKE exchange Sanlam Kenya PLC stocks are traded under the ticker SLAM.
SLAM stock has risen by 0.45% compared to the previous week, the month change is a 7.14% rise, over the last year Sanlam Kenya PLC has showed a 26.76% increase.
SLAM reached its all-time high on Feb 19, 2020 with the price of 18.80 KES, and its all-time low was 3.90 KES and was reached on Dec 10, 2024. View more price dynamics on SLAM chart.
See other stocks reaching their highest and lowest prices.
See other stocks reaching their highest and lowest prices.
Today Sanlam Kenya PLC has the market capitalization of 5.73 B, it has increased by 3.02% over the last week.
Yes, you can track Sanlam Kenya PLC financials in yearly and quarterly reports right on TradingView.
SLAM net income for the last half-year is 51.63 M KES, while the previous report showed 688.45 M KES of net income which accounts for −92.50% change. Track more Sanlam Kenya PLC financial stats to get the full picture.
No, SLAM doesn't pay any dividends to its shareholders. But don't worry, we've prepared a list of high-dividend stocks for you.
As of Feb 14, 2026, the company has 164 employees. See our rating of the largest employees — is Sanlam Kenya PLC on this list?
Like other stocks, SLAM shares are traded on stock exchanges, e.g. Nasdaq, Nyse, Euronext, and the easiest way to buy them is through an online stock broker. To do this, you need to open an account and follow a broker's procedures, then start trading. You can trade Sanlam Kenya PLC stock right from TradingView charts — choose your broker and connect to your account.
Investing in stocks requires a comprehensive research: you should carefully study all the available data, e.g. company's financials, related news, and its technical analysis. So Sanlam Kenya PLC technincal analysis shows the buy rating today, and its 1 week rating is strong buy. Since market conditions are prone to changes, it's worth looking a bit further into the future — according to the 1 month rating Sanlam Kenya PLC stock shows the strong buy signal. See more of Sanlam Kenya PLC technicals for a more comprehensive analysis.
If you're still not sure, try looking for inspiration in our curated watchlists.
If you're still not sure, try looking for inspiration in our curated watchlists.