Is Samsung's Chip Bet Paying Off?Samsung Electronics is navigating a complex global landscape, marked by intense technological competition and shifting geopolitical alliances. A recent $16.5 billion deal to supply advanced chips to Tesla, confirmed by Elon Musk, signals a potential turning point. This contract, set to run until lat
Samsung Electronics Co., Ltd. Sponsored GDR
No trades
Next report date
—
Report period
—
EPS estimate
—
Revenue estimate
—
118 USD
31.86 B USD
235.15 B USD
About Samsung Electronics Co., Ltd.
Sector
Industry
Website
Headquarters
Suwon-si
Founded
1969
IPO date
Jun 11, 1975
Identifiers
3
ISIN US7960508882
Samsung Electronics Co., Ltd. engages in the manufacturing and selling of electronics and computer peripherals. The company operates through following business divisions: Device Experience (DX), Device Solutions (DS), Samsung Display (SDC), and Harman. The DX division offers televisions, monitors, refrigerators, washing machines, air conditioners, smartphones, network systems, and computers. The DS division deals with semiconductor components including DRAM, NAND Flash, and mobile APs. The SDC division provides OLED panels for smartphones. The Harman division consists of digital cockpits, car audio, and portable speakers. The company was founded on January 13, 1969 and is headquartered in Suwon-si, South Korea.
Related stocks
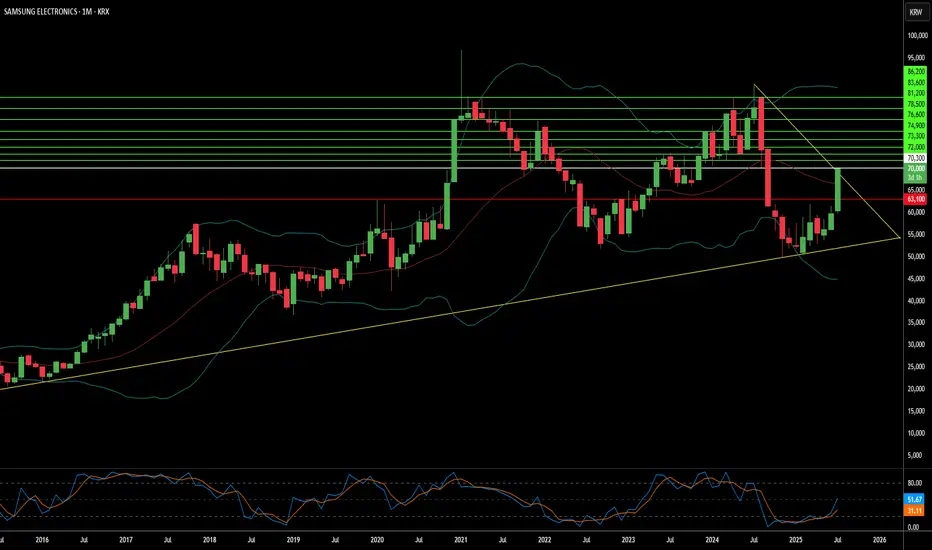
The key is whether it can rise above 61800
Hello, traders.
If you "Follow", you can always get new information quickly.
Have a nice day today.
-------------------------------------
(Samsung Electronics 1D chart)
HA-Low indicator and HA-High indicator have begun to converge.
Accordingly, a trend is expected to occur soon.
Since the pri

Samsung to move lower, confirm double top and break channel?Bearish for Samsung
Possible double top in place
Also implies that USDKRW would move higher as Samsung fails hence Samsung is mostly the KRW currency.
As global equity indices roll over in 2025 this could move lower

Good time to buy Samsung stocksIt went down a lot, and checked the floor.
It gave a fake rebound and fell back.
So, now it's ready for a go.
What do I mean?
Many individual investors entered thinking the price will go up, and they are losing hopes seeing a little minus %.
They will give up, and only after that process the price

Mr.Million | Why Samsung is a Great Buy @ ~ 45,000 KRW!Reasons to be bullish? 📈
1. Completion of an ABC correction
2. Strong support zone
3. Potential bullish RSI divergence (Daily)
Also - No good news for Samsung? Sounds like a great time to buy!
🔥~ 45,000 KRW = Strong Buy 🚛🚛🚛

Samsung Head and shouldersVery long term pattern of head and shoulders has emerged on Samsung. This is the UK traded stock. Whether you can short it or not I don't know but extreme caution on going long is probably a good idea.


SAMSUNG ELECTRONICS - KRXSAMSUNG ELECTRONICS - KRX
Est-ce le meilleur moment pour un achat ?
Mon analyse :
*Sur un graphique hebdo (W1)
- SAMSUNG ELECTRO est dans une tendance haussière depuis 2016
- Une zone résistante qui limite le mouvement haussier et une zone de soutient qui limite le mouvement baissier
*Sur u

Samsung Galaxy S25 Series to Adopt Snapdragon ExclusivelySamsung is poised to make a strategic shift with its upcoming Galaxy S25 series by exclusively integrating Qualcomm's Snapdragon 8 Gen 4 SoC. This move marks a departure from earlier plans to use Samsung's Exynos chips across all models.
Key Points:
1. Snapdragon 8 Gen 4 Dominance:
- The G

See all ideas
Summarizing what the indicators are suggesting.
Neutral
SellBuy
Strong sellStrong buy
Strong sellSellNeutralBuyStrong buy
Neutral
SellBuy
Strong sellStrong buy
Strong sellSellNeutralBuyStrong buy
Neutral
SellBuy
Strong sellStrong buy
Strong sellSellNeutralBuyStrong buy
An aggregate view of professional's ratings.
Neutral
SellBuy
Strong sellStrong buy
Strong sellSellNeutralBuyStrong buy
Neutral
SellBuy
Strong sellStrong buy
Strong sellSellNeutralBuyStrong buy
Neutral
SellBuy
Strong sellStrong buy
Strong sellSellNeutralBuyStrong buy
Displays a symbol's price movements over previous years to identify recurring trends.
SSNLF5047730
Samsung Electronics Co., Ltd. 7.7% 01-OCT-2027Yield to maturity
—
Maturity date
Oct 1, 2027
See all SMSN bonds