Sony Wave Analysis – 22 January 2026- Sony broke long-term support level 24.00
- Likely to fall to support level 22.00
Sony reopened today with the sharp downward gap – after the price broke below the strong long-term support level 24.00 (former monthly low from June and July of 2025).
The breakout of the support level 24.00 acceler
Sony Group Corporation Sponsored ADR
No trades
Next report date
—
Report period
—
EPS estimate
—
Revenue estimate
—
−0.20 USD
7.49 B USD
84.99 B USD
5.97 B
About Sony Group Corporation
Sector
Industry
CEO
Hiroki Totoki
Website
Headquarters
Tokyo
Founded
1946
IPO date
Dec 1, 1958
Identifiers
3
ISIN US8356993076
Sony Group Corp. engages in the development, design, manufacture, and sale of electronic equipment, instruments, devices, game consoles, and software for consumers, professionals and industrial markets. It operates through the following segments: Game and Network Services, Music, Pictures, Home Entertainment and Sound, Imaging Products and Solutions, Mobile Communications, Semiconductors, Financial Services, and Others. The Game and Network Services segment deals with gaming machines, software and network services. The Music segment produces and publishes music and provides image media platforms. The Pictures segment handles film production, television program creation, and media networks. The Home Entertainment and Sound segment offers LCD televisions, home audio, Blu-ray Disc players and recorders, and memory-based portable audio devices. The Imaging Products and Solutions segment provides digital imaging products, professional solutions, and medical goods. The Mobile Communications segment deals with mobile phones and Internet services business. The Semiconductors segment provides image sensors and camera modules. The Financial Services segment manages the life insurance and non-life insurance operations and banking business. The Others segment includes personal computer (PC) business, overseas Blu-ray Disc, DVD and CD manufacturing, and battery business. The company was founded by Akio Morita and Masaru Ibuka on May 7, 1946 and is headquartered in Tokyo, Japan.
Related stocks

Sony Primed for Explosive Gains| Are You On Board?📈 SONY Long-Term Outlook: A Powerful Multi-Decade Bullish Setup
Sony’s price history tells the story of a giant evolving through different market cycles, reflecting both fundamental strength and classic price behavior expected in large-cap growth leaders.
🌊 Wave Theory Confluence — Clear Impu

Sony Wave Analysis – 30 April 2025- Sony broke resistance zone
- Likely to rise to resistance level 27.00
Sony recently broke the resistance zone between the resistance level 25.60 (which stopped the previous waves (1) and B) intersecting with the resistance trendline of the daily up channel from January.
The breakout of this resi

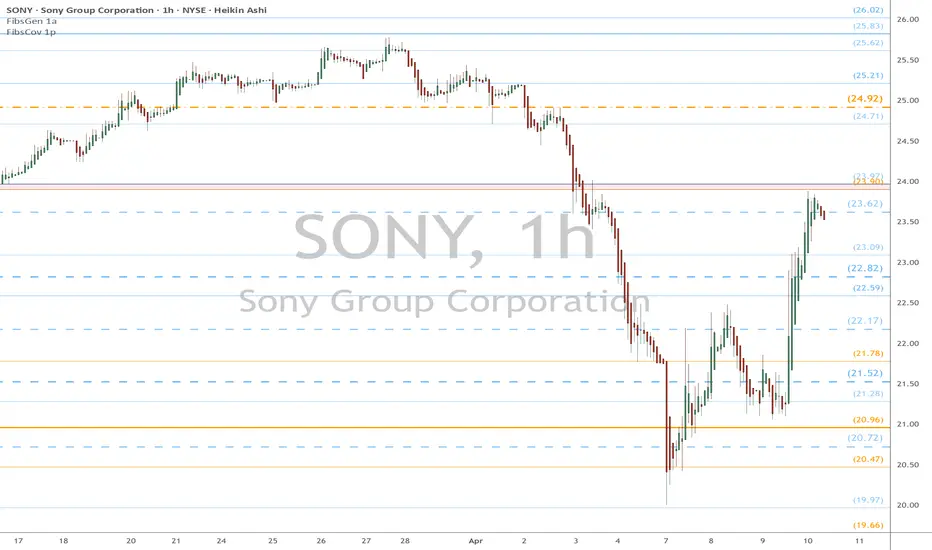
SONY eyes on $24: Tariff Relief bounce at resistance to Dip Buy SONY bounced into a key resistance that bulls must break.
Looking for a dip or Break-n-Retest for long entries or adds.
Japan looks to be on Trump's good side so this might recover.
$ 23.90-23.97 is the exact resistance zone to watch.
$ 22.82-23.09 is the first support to watch for the dip.
======
Steady momentum for SonyTSE:6758 Sony is exploring a possible continuation to the upside after the stock has confirmed the breakout from the re-accumulation range. All long, mid, and short-term momentum indicators indicate a steady flow of upward momentum. The Ichimoku shows a consistent uptrend confirmation, with prices

6758 | SONY GROUP CORPORATIONSony Group Corporation (SONY) has captured attention with a fresh breakout, signaling renewed momentum in its stock performance. This technical move suggests potential upside, driven by strong fundamentals and innovation across its key segments, including gaming, entertainment, and electronics. Inve

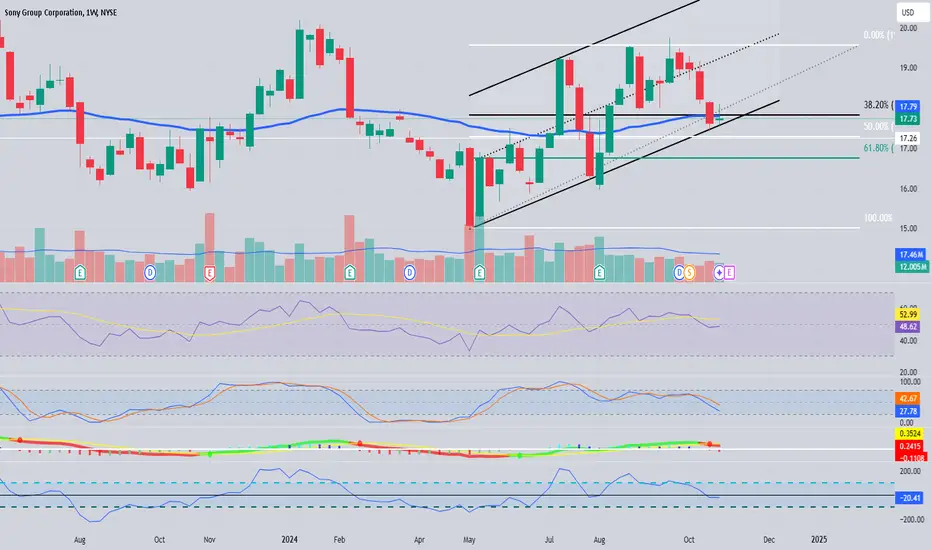
Two Types of UptrendsSony Group (6758) - Weekly Chart
There are two types of uptrends within an overall upward trend.
This statement might sound confusing at first.
What I mean is that there are "easy-to-understand" uptrends and "difficult" uptrends.
The chart shows two blue circles.
Which one represents an easy-to

After the Doji a blessing but what nextAfter a Doji candle, Sony had a bullish engulfing candle carrying it further up in the upward parallel channel, there is a possibility of correction, but the CCI and RSI and SRSI indicators do not appear to state the asset is oversold, it actually has good CCI and SRSI readings and it is currently r

Risky Doji, chance of reversalPositives-There is a Doji on the weekly time frame hovering above the 50 EMA, after a downward trend. The candle is resting around 50 % Fib level. The Doji candle is also on the bottom of an upward parallel channel.
Negatives- It is election week, and the markets could be in flux and the SRSI leve
SONY -where to shorthi traders
Let's have a look at SONY on a 1D time frame.
The price has been ranging.
Well-developed bearish divergences are present.
Either it will roll down from where it's now or it will give us a push towards the key resistance (top of the range).
The speculative set-up is shown on the chart

See all ideas
Summarizing what the indicators are suggesting.
Neutral
SellBuy
Strong sellStrong buy
Strong sellSellNeutralBuyStrong buy
Neutral
SellBuy
Strong sellStrong buy
Strong sellSellNeutralBuyStrong buy
Neutral
SellBuy
Strong sellStrong buy
Strong sellSellNeutralBuyStrong buy
An aggregate view of professional's ratings.
Neutral
SellBuy
Strong sellStrong buy
Strong sellSellNeutralBuyStrong buy
Neutral
SellBuy
Strong sellStrong buy
Strong sellSellNeutralBuyStrong buy
Neutral
SellBuy
Strong sellStrong buy
Strong sellSellNeutralBuyStrong buy
Displays a symbol's price movements over previous years to identify recurring trends.
INTY
Evolve International Equity UltraYield Hedged ETF Units Trust UnitsWeight
12.46%
Market value
1.08 M
USD
Explore more ETFs