XAU/USD | Gold Approaching Key Intraday Supply Zone! (READ)By analyzing the #Gold chart on the 4H timeframe, we can see that after dropping to 3998 dollars, price found strong demand and has now climbed back up to around 4050 dollars.
Keep an eye on the 4056–4064 zone for a potential SELL reaction, as this is a key supply area.
This analysis will be updated soon, and all important supply and demand zones are already marked on the chart.
Please support me with your likes and comments to motivate me to share more analysis with you and share your opinion about the possible trend of this chart with me !
Best Regards , Arman Shaban
Trade ideas

XAUUSD Long: Buyers Eye Push Toward $4,100 ResistanceHello traders! XAUUSD is developing a clear technical structure after reacting multiple times to both the Supply and Demand zones, forming a well-defined pattern of price behavior. Recently, Gold rejected the Supply Line after creating a new Pivot Point near the $4,230 area — the same region where a previous strong rejection occurred. This confluence confirms that sellers remain active at the upper boundary of the market. Earlier, the market formed a Double Top pattern near the same Supply Zone, which triggered a strong bearish reversal. After the breakdown, price retested the $4,100 level several times, turning it into a meaningful local resistance. Multiple breakout attempts above this level failed, signaling strong selling pressure from the supply area.
Currently, XAUUSD is testing the Demand Line that has been respected consistently throughout the recent bullish leg. Each touch of this trendline resulted in a higher pivot point, confirming active buyers stepping into the market. This area aligns with the $4,000–$4,010 Demand Zone — a key support cluster where price has reacted with strong bullish impulses before.
My scenario as long as XAUUSD holds above the Demand Line and the $4,000–$4,010 support, the bullish structure remains valid. A rebound from this zone may initiate a fresh move toward the $4,100 Supply Zone (TP1), where the next important reaction is expected. A clean breakout above $4,100 would strengthen the bullish scenario and open the path toward $4,150–$4,170, aligning with the upper Supply Line. If Gold fails to hold above the Demand Zone, sellers may regain control and push the price lower toward the $3,960 support, signaling a deeper correction phase. For now, the market favors buying pullbacks near demand while monitoring price action closely around the $4,100 resistance. Manage your risk!

Monk Mode for Traders: The Discipline That Changes EverythingHey whats up guys, everything is about focus. If you feel stuck its might because you are just consuming trade ideas on the Trading view, scrolling Trading instagram or watching another YouTube trading videos. It feels good like working on yourself but it's not real self-development.
When I need to improve I something. Im using extreme Monk Mode to fully focus on project. Trading is mine and I hope also your lifetime project. As a trader you must master multiple aspects and elements in this area to succeed.
In the recent post I introduce schedule for the disciplined trader. This is for those who already made it and are full time traders. Today Im going to give you tips how to go extreme to acquire new skills or exit 9 - 5 slavery.
⁉️ What Monk Mode Actually Means
You don't need to wear a robe, incense, or sitting in silence for hours. Monk mode is less people, more focus. You are not running away from the world. You are simply closing the doors for a while so you can build in peace. Isolation helps you to focus only on that project and yourself. It's a bit extreme and you can do it only for some period of the time but you will come back unrecognized.
📌 I would describe it as:
• A temporary period of extreme simplicity
• Removing everything not aligned with your goals
• Working on ONE main mission. Not three. ONE !
• Mastering your mind through fewer choices and fewer distractions
📌 How long you isolate yourself and focus decides how you improve
• 30 days → reset
• 60–90 days → transformation
• 6 months → new identity
📌 Always tie it to a goal:
• Finish and Deeply understand One Trading strategy
• Pass Specific Prop Challenge
• Improve my Risk to reward ratio
• Backtest my strategy on 500 traders
📌 Come Out from Monk Mode When:
• Your mission is complete
• Your routines click
• Your discipline feels natural
• Your system is built
Then you return to normal life. Celebrate a bit. Spend time with people you love.
Take a break, but keep the strongest 50–70% of the habits, thats how you permanently update. You will might not be perfect on first time, thats normal no one is. But you will see such improvements, you will start thinking about next round. But don't go extreme, social life is important always take breaks between monk modes.
🧪 Running Monk Mode has 2 phases
• Cutting distractions and cheap dopamine
• Adding a traction and increasion focus (obsession on project)
1️⃣ Lets Cut Distraction's
❌ 1. Adjust your phone - Social media and set Do not disturb permanently
Delete the apps or block them during your work window. I know it can feel hard, but harder it feels more you need it. Social media and short term content is distraction loop. During the monk mode Im cutting it completely. In normal life ( I have 30 minutes planned window) Social media are not bad if you visit them with intention. Just for curiosity put phone usage timer on your main desktop you will see how much time you waste daily if its more then 90 minutes, you got it. Thats whats holding you back.
❌ 2. Reduce Social Activity
When I am in Monk mode, I say no to most social stuff for a short period of time. No parties, Bar meetings and Alcohol. Not even meeting for coffee. As Im father then family duties must stay. That is non negotiable. But outside of that, I shrink my interactions down to almost zero unless the meeting clearly helps my Monk mode goal.
Example
If I am focused on passing a prop challenge or backtesting some element I want to add to my strategy and someone invites me to a weekend full of drinking and late nights, it is a hard no.
If a trader that also trades same strategy invites me to a serious work session to review data or refine something, I will go. That supports the mission.
❌ 3. Cut porn and junk dopamine completely.
This is the uncomfortable part almost nobody wants to talk about, but it matters.If you are constantly stimulating yourself with porn and random adult content, your brain is fried with dopamine. Your focus span goes to zero. Your discipline collapses.
• No porn
• No “thirst trap” scrolling
• No mindless sexual content
• No dating apps
This should not be only for a monk mode. Porn is cancer for your focus cut it out from your life completely. After a few days without this junk, your energy levels change. You wake up more driven. You sit at the charts and you actually want to work. You start feeling like a hunter again, not a zombie.
❌ 4) Cancel Netflix and stop Watching news
Netflix is waste of time. Same is for the news. It doesn't matter knowing what orange mans says or how some sport results ended. You need to focus on your project
2️⃣ Lets put some Traction
✅ 1. One Project — Your Core Mission 🎯
This is your main quest, for traders, Monk Mode is powerful, because it removes decision fatigue.it could be:
• Backtesting 500+ trades of one model
• Building your strategy framework properly
• Creating your full trading plan
• Passing a prop challenge with discipline
• Fixing your routine and sticking to it
Rules:
• Choose ONE project / Mission
• Work on it daily
• Don’t switch
• Clear finish line
✅ 2. One book 📖
School didn’t prepare you for trading. You have to learn the parts nobody teaches:
• Mindset
• Psychology
• Discipline
• Focus
• Execution
• Stoicism
• Peak performance
30 minutes a day is enough.
Books give you depth. Unlike social media gives you shallow noise of social feeds. I suggest you Atomic Habits - from James clear if never read it. Also FLOW from Mihaly Csikszentmihalyi
✅ 3.One meditation - to reset your mind 🧘♂️
Monk mode without meditation is like a gym without weights. I keep it simple. Twenty minutes every day, but you can start with 10 minutes if you didn't meditate ever.
You can find some guided meditations on YouTube. But, dont let yourself catch in to a trap by scrolling and finding meditation. Prepare one in advance and put It to the playlist or just:
• Sit down
• Close your eyes
• Focus on your breath
• Let thoughts pass without judging or chasing them
Meditation help you regain control over your attention
✅ 4..One workout 💪
You can do either gym or calisthenic training. But not hard cardio, rather resistance training that builds strength. Instead of cardio you got walks. When Im in the monk mode I do Powerlifters training. Its simple, it increases your strength and I do not have to think about training complexity to much. I just come to the gym and finish my session in 45 minutes.
Measure you max weights and add 10%. Then start with 60% of the weight and add 5% every week. You can do more complex weight progression after 4 weeks but that would be for whole article. Search for Stefan Corte Powerlifting training. But dont overthink it. In Monk mode you want stupid repetitive routine.
Squats 6 x 6 - 60% - 65% - 70% - 75%
Bench 6 x 6 - 60% - 65% - 70% - 75%
Deadlift 6 x 6 - 60% - 65% - 70% - 75%
👉 Train hard 3 times a week - Mo / We / FR .. take a break on the weekends.
👉 Other 3 days focus on mobility training and stretching
👉 Take a break one day
Don't forget for 10 minutes warm
Do proper stretching after the training session.
✅ 5. Long walks (No phone , No music) 🚶♂️🌲
Long walks for clarity and aha moments. I go out for around 60 minutes, ideally in nature, with no phone and no music. Just walking, being present and thinking on my project
TIP - if you go for walk on the mornings and fasted, you body will take energy from fats.
As you are in the mode when focusing on project. Ideas begin to connect. You ll start seeing patterns, solutions, better rules. Many parts of my strategies, my routines, even my lifestyle changes were born on these walks.
✅ 6. Eat like an athlete, not a garbage bin 🥦
Food is another big lever. In Monk mode I prefer to work in a light, fasted state during the main focus hours. I have my first real meal after I finish my most important work for the day. Before that I of course drink water, but nothing that spikes blood sugar. Because when you are full, heavy and bloated, your brain slows down. That is the last thing you want when you need to do deep work.
Keep it simple
1. Protein
2. Good carbs
3. Healthy fats
4. Minimal junk
Obviously in normal life I sometimes eat in Mc Donald or have Popcorn when taking daughter to the cinema. But No pizza and chips, No such a things in Monk mode. You are trying to become sharp, not sleepy.
🎯 Thats all easy said but how to do it if I got 9 - 5 job?
Simple you need to adjust your schedule, when you remove Netflix, Social media and contacts you gain new time, but you will have to put it somewhere in a day. I highly suggest to make it on the morning because after work you will be tired and your focus will not be so sharp.
📅 Plan for people those who has 9 - 5 job Every days start with good sleep so go sleep early and always at the same time. If you start practicing walks without distracting you brain with phone, you will sleep better.
⏰ Wake at 4:00 win the morning
Always follow your morning routine - Meditation, Backtesting, Book, Workout
Do this every days even on weekends. Don't overtrain have 2 types of training heavy one and one lighter focused on mobility and stretching. These 4 hours is how you win the day. Before it even started.
Once you are back from job if you have kids you must give them your time. If you dont have kids do some more intentional work on Project - backtesting , analyzing the charts etc... But be careful with starting to hard burning yourself. 90 minutes a day on the project is maximum. No hard work in one day beats consistency of smaller daily consistent work. So dont overshoot the start.
📝 Then Journal your day, write down what you learned and selfreflect on progress in each parts of monk mode - Meditation, Project - Backtesting, Notes from book, Work out.
✍️ Make plan for the next day and go for walk without phone or music. You will see what happens on that walk. Then just come home have a shower and go sleep
🔁 Next day repeat. On the Saturdays and Sundays add one more bigger window for work on the project to summarize what did you learn during the week. Then you do some relax activities as sauna, massage, visit family members, spend time with kids, give more time to reading.
If you do this consistently for 3 months. You will see miracle happen, not only in your trading career but in your life will change go for 6 months and you will come back as different person.
Are you in to upgrade yourself for 2026 ? Let me know
David Perk
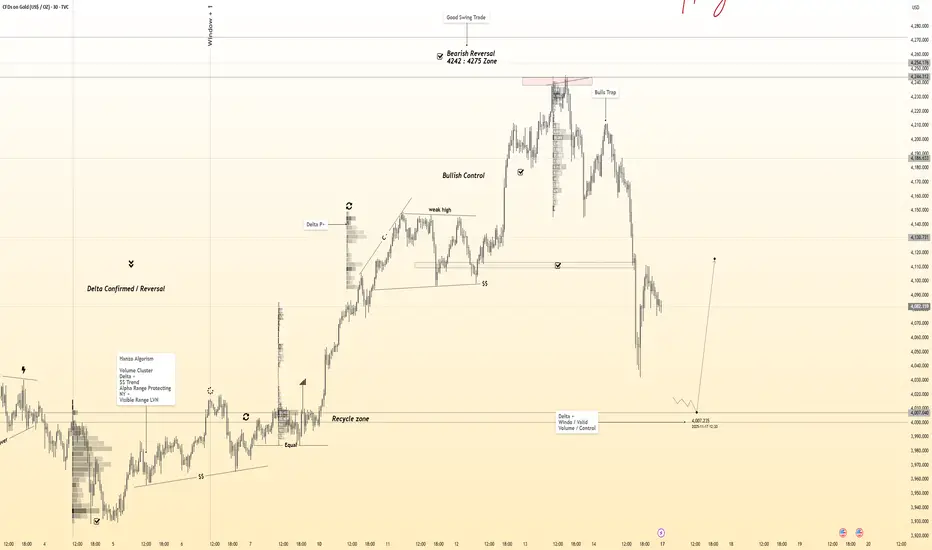
Gold 30-Min — Volume Buy Reversal Triggered⚡Base : Hanzo Trading Alpha Algorithm
The algorithm calculates volatility displacement vs liquidity recovery, identifying where probability meets imbalance.
It trades only where precision, volume, and manipulation intersect —only logic.
✈️ Technical Reasons
/ Direction — LONG / Reversal 4068 Area
☄️Bullish momentum confirmed through strong candle body.
☄️Structure shifted with higher-low near key demand base.
☄️Volume expanding confirms order-flow alignment upward.
☄️Buyers reclaimed imbalance with sustained clean break.
☄️Algorithm detects rising momentum under low liquidity.
⚙️ Hanzo Alpha Trading Protocol
The Alpha Candle defines the day’s real control zone — the first battle of momentum.
From this origin, the Volume Window reveals where the next precision strike begins.
⚙️ Hanzo Volume Window / Map
Window tracked from 10:30 — mapping true market behavior.
POC alignment exposes institutional bias and breakout potential zones.
⚙️ Hanzo Delta Window / Pulse
Delta window monitors real buying vs. selling power behind each move.
Tracks volume aggression to expose who controls the candle — buyers or sellers.
When Delta aligns with Volume Map, momentum becomes undeniable.

GOLD → Mixed data forms a symmetrical triangle FX:XAUUSD is bouncing off support at 4030, with bulls trying to maintain the current trend. The fundamental backdrop is currently weak for gold, which is why there are bears in the market. The PMI report is coming up...
Mixed US employment data (NFP growth to 119K, but unemployment rose to 4.4%) has created uncertainty. The probability of a Fed rate cut in December remains at 40%. Fed officials remain cautious, warning of the risks of premature easing.
Focus on the 4070-4082 area and local trend resistance...
Gold is awaiting new signals from PMI data. A breakout of the range is likely if there are significant deviations from forecasts (Manufacturing PMI: 52, Services PMI: 54.8)
Technically, a symmetrical triangle is forming on the chart, which could keep the market within its boundaries if the fundamental background remains unchanged. However, a breakout of either boundary could trigger a distribution in the direction of the break
Resistance levels: 4080, 4110
Support levels: 4040, 4030, 4006
In the medium term, gold currently looks weak. The reaction to support is weakening, a cascade of levels and a downward resistance line are forming. The market may test the 4080 area, but if the PMI is weak, gold will return to attack the trend support. However, a break above 4082 and a close above this zone could give us a chance for growth.
Best regards, R. Linda!
Gold 30-Min — Volume Sell Reversal Triggered⚡Base : Hanzo Trading Alpha Algorithm
The algorithm calculates volatility displacement vs liquidity recovery, identifying where probability meets imbalance.
It trades only where precision, volume, and manipulation intersect —only logic.
✈️ Technical Reasons
/ Direction — SHORT / Reversal 4081 Area
☄️Bearish rejection confirmed through sharp candle body.
☄️Lower-high forming beneath resistance supply region.
☄️Volume decreasing confirms exhaustion in price rally.
☄️Sellers regained imbalance with heavy top rejection.
☄️Algorithm detects fading demand and shift to control.
⚙️ Hanzo Alpha Trading Protocol
The Alpha Candle defines the day’s real control zone — the first battle of momentum.
From this origin, the Volume Window reveals where the next precision strike begins.
⚙️ Hanzo Volume Window / Map
Window tracked from 10:30 — mapping true market behavior.
POC alignment exposes institutional bias and breakout potential zones.
⚙️ Hanzo Delta Window / Pulse
Delta window monitors real buying vs. selling power behind each move.
Tracks volume aggression to expose who controls the candle — buyers or sellers.
When Delta aligns with Volume Map, momentum becomes undeniable.

XAUUSDHello Traders! 👋
What are your thoughts on GOLD?
Gold reached the resistance zone and the upper boundary of the descending channel, but failed to break above it and was strongly rejected.
This reaction indicates that selling pressure remains dominant in this area.
The ongoing downward correction is expected to continue at least toward the support zone and the lower boundary of the channel.
While the long-term trend remains bullish, gold may remain corrective and slightly bearish in the medium term until key levels are reclaimed.
Don’t forget to like and share your thoughts in the comments! ❤️

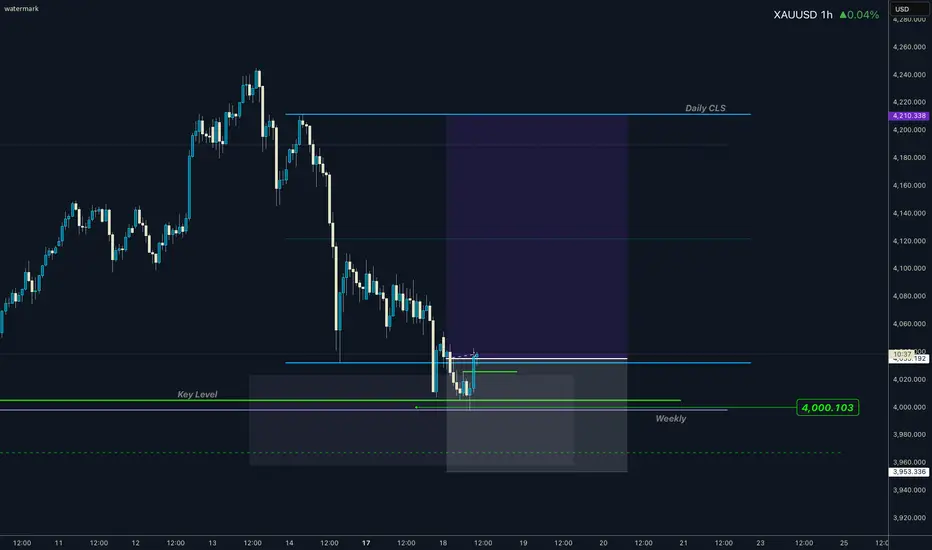
GOLD I Daily CLS I Model 1 nested in Weekly CLSHi friends, new range created. As always we are looking for the manipulation in to the key level around the range. Don't forget confirmation switch from manipulation phase to the distribution phase to make the setup valid. Stay patient and enter only after change in order flow. If price reaches 50% of the range take partial or full close.
📌 HTF - Higher Timeframe view
🧩 Complete proces and Strategy explained 👇 Click Below
🎯 Why your market approach also should be mechanical ?
NO Fixed Mechanical Trading Logic - You are guessing random patterns
NO Defined trading plan - Every trade different logic
NO Same logic in each trade - Not possible to backtest
NO Backtests on at least 300 trades - Not knowing Statistics
➡️ No Statistics ➡️ No Edge ➡️ Mindset ProblemS
🧠 Core of mindset problems
If you don't know your statistics on large enough data sample. You don't know your probabilities of win rate once the losing streak happen and it happens to every strategy. You will start doubting, hesitating to take next trade because you don't know statistics of your losses. In the end you will be doubting strategy and then jump to different one. You will be in the endless loop for years, looking for new better strategy. 👊 Your ultimate goal as a trader is not to be a generalist who knows 10 000 patterns. But rather create one system with narrowed criteria of each element of the trade to remove subjective and emotional decisions as much as possible and stick to this system no matter what. Practice it 10 000 times become a MASTER.
✨ Trading Mastery is reflection of your life
Have a longterm plan, No Alcohol & Drugs, Ignore others, Focus on your journey , Backtest regularly, Review your weeks, Journal mistakes, Exercise, Sleep well, Read books, Walks in nature (no phone) , Meditate, Reduce social media time, Spend time with family, Live Life.
Trading is hard, but not impossible. I believe in you 💪
David Perk aka Dave Fx Hunter
Gold possible move Gold is currently bouncing from a rising trendline support around 4022–4040, indicating buyers are still active in this zone. If price holds above this support, we may see a bullish move toward the first resistance at 4089, followed by 4133. A breakout above these levels can push price toward the upper target zone around 4212–4243.
However, if price breaks below the trendline, further downside toward 3996 may follow.

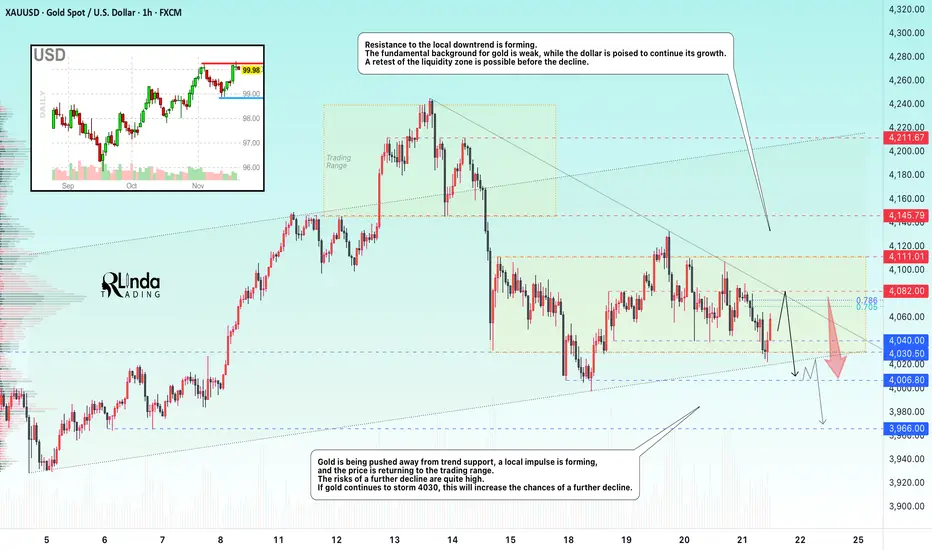
Lingrid | GOLD Weekly Analysis: Coiled Spring at Key CrossroadsOANDA:XAUUSD price action has settled into a tense, range-bound struggle, repeatedly testing the ascending trendline that has defined its path since late October. This persistent retest is a double-edged sword: while it demonstrates underlying buying interest, it also signals exhaustion and a growing risk of failure. The market is now at a critical juncture where the next decisive move will determine the immediate direction. A close below this trendline would be a significant bearish signal, such a break often triggers a deeper corrective pullback to complete an ABC pattern. Conversely, a strong breakout above the recent lower high near $4,130 could reignite the bullish momentum and target the $4,200 resistance zone.
The broader structure on the 4-hour chart reveals a clear downward channel forming from the peak in mid-October, with price currently trapped between the channel’s upper boundary and the ascending trendline support. This creates a tightening triangle pattern, a classic consolidation formation that typically precedes a sharp, directional move. Key levels to watch are the immediate support around $4,020 and the more substantial monthly low near $3,930. The current corrective move phase suggests the market is digesting prior gains, and the upcoming catalyst—whether it’s a fundamental driver or pure technical exhaustion—will likely force a resolution. The repeated tests of resistance near $4,230 have so far been unsuccessful, reinforcing the view that bulls lack the conviction to push higher without a catalyst.
For us the strategy is simple: wait for the breakout. The neutral stance is warranted as long as price remains within the converging trendlines. A close below the ascending trendline would be a clear sell signal, targeting the $3,930 support area. On the flip side, a sustained move above $4,150, especially with increasing volume, would be a buy signal, opening the path toward $4,200 and potentially $4,300. Until then, the market is in a holding pattern, with the balance of power shifting with every candle. The key takeaway is that the longer price trades in this narrow range, the more explosive the eventual breakout is likely to be, making patience the most valuable tool for navigating the coming week.
If this idea resonates with you or you have your own opinion, traders, hit the comments. I’m excited to read your thoughts!

Gold: Fakeout Completed, Pennant Target is on goingHi guys!
Gold just completed a textbook sequence of bearish structures. After the strong drop that formed the flagpole, price consolidated inside a pennant pattern. This type of setup typically continues in the direction of the prior move, and the measured target sits around $3,946, which aligns with your highlighted zone.
Before breaking lower, price formed an inverse head and shoulders, the reaction to the target of this pattern happened and we saw a clear fakeout right above the trendline.
As long as Gold stays below this broken trendline, the expectation is for a retest/rejection, followed by continuation toward the pennant’s full target.
The overall structure still favors the downside unless the market reclaims the fakeout region convincingly.
Disclaimer: As part of ThinkMarkets’ Influencer Program, I am sponsored to share and publish their charts in my analysis.

XAUUSD(GOLD): From Previous Setup to this,POV remain the sameGold touched our risk entry and zone and dropped around +800 pips. We expect the price to continue falling and break through the channel. Once we have confirmation, we can focus on the risk area rather than having two selling entries. You can choose from three targets based on your setup. Please manage your risk effectively while trading gold. We wish you the best.
Good luck and trade safely.
Team Setupsfx_

GOLD → Retest 4050 in a weak market...FX:XAUUSD is bouncing off support at 4000 and forming a correction towards 4050, an important resistance level. The market's main focus is on the September employment report (NFP), which will be released on Thursday.
Key pressure factors:
The strong dollar is supported by hawkish statements from the Fed and risk aversion. The probability of a rate cut in December has fallen to 42%.
Support for gold: Demand for government bonds has lowered the yield on 10-year Treasuries, allowing gold to rebound to $4045.
A series of negative labor market reports keeps risks alive.
Gold remains under pressure. A break below $4000 will open the way to $3950, while a rise above $4050 will require weak NFP data or dovish Fed rhetoric. The week will determine the direction
Resistance levels: 4050, 4090
Support levels: 4000, 3965
The market is beginning to doubt the local bullish structure. Strong trend support is breaking down and the previously broken level is being retested. If the bears keep the price below 4045-4050, gold could continue to decline. However, it is worth keeping an eye on the news in the second half of this week...
Best regards, R. Linda!

Lingrid | GOLD Key Confluence Zone -Long OpportunityOANDA:XAUUSD is testing the confluence support after completing a clean pullback from the previous weekly high (PWH) and the resistance zone. The market structure shows price reacting along the channel border while holding above the broader triangle breakout region and key psychological level at 4,000. If buyers defend 4,000 once again, a recovery becomes the primary scenario as bullish momentum attempts to rebuild. Price action continues to follow a higher-low pattern that supports a renewed upside push if the support floor remains intact.
⚠️ Risks:
A decisive break below channel may shift momentum toward the deeper support zone near 3,900.
Strong USD flows or unexpected macro data could limit upside recovery attempts.
Failure to maintain the higher-low structure may weaken the bullish rebound setup.
If this idea resonates with you or you have your own opinion, traders, hit the comments. I’m excited to read your thoughts!

Gold 30-Min — Volume Buy Reversal Triggered⚡Base : Hanzo Trading Alpha Algorithm
The algorithm calculates volatility displacement vs liquidity recovery, identifying where probability meets imbalance.
It trades only where precision, volume, and manipulation intersect —only logic.
✈️ Technical Reasons
/ Direction — LONG / Reversal 4005 Area
☄️Bullish momentum confirmed through strong candle body.
☄️Structure shifted with higher-low near key demand base.
☄️Volume expanding confirms order-flow alignment upward.
☄️Buyers reclaimed imbalance with sustained clean break.
☄️Algorithm detects rising momentum under low liquidity.
⚙️ Hanzo Alpha Trading Protocol
The Alpha Candle defines the day’s real control zone — the first battle of momentum.
From this origin, the Volume Window reveals where the next precision strike begins.
⚙️ Hanzo Volume Window / Map
Window tracked from 10:30 — mapping true market behavior.
POC alignment exposes institutional bias and breakout potential zones.
⚙️ Hanzo Delta Window / Pulse
Delta window monitors real buying vs. selling power behind each move.
Tracks volume aggression to expose who controls the candle — buyers or sellers.
When Delta aligns with Volume Map, momentum becomes undeniable.
XAUUSDHello Traders! 👋
What are your thoughts on GOLD?
Gold continues to trade in a range-bound and choppy structure, showing back-and-forth movement with no clear directional bias in the short term.
In the current zone, price is trapped between channel resistance and key support, and a breakout from either side will determine the next strong move.
We expect gold to form a short-term upward correction toward the upper boundary of the descending channel and the resistance zone.
Once price reaches this area, a bearish rejection is likely, leading to a continuation of the downward trend toward lower support levels.
If gold breaks below the 4050 support zone and the daily candle closes below this zone,
this will confirm further downward continuation without any bullish pullback, signaling a stronger bearish wave.
As long as gold remains below the resistance zone and channel top, the short-term bias stays bearish.
Any upward movement is likely to be corrective, providing a potential setup for continuation to the downside.
Don’t forget to like and share your thoughts in the comments! ❤️

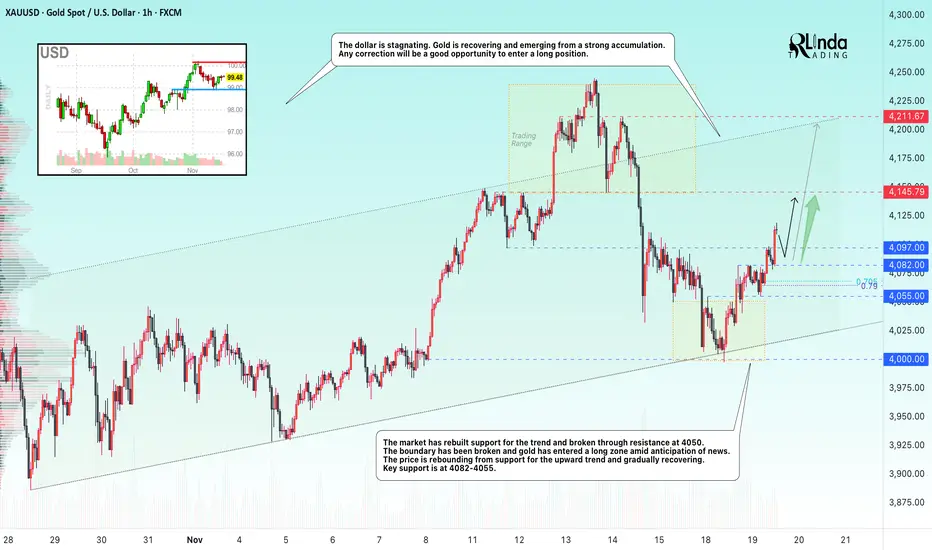
GOLD → Market support, exit from consolidationFX:XAUUSD is feeling market support ahead of the news. The price is rebounding from trend support, breaking through strong resistance and enjoying high interest from bulls...
The rise in demand for defensive assets is driven by concerns about the overvaluation of technology stocks and weak US labor market data. The number of applications for unemployment benefits rose significantly in October. Private employers cut jobs for four weeks. The Fed minutes may show disagreement over the regulator's future policy, and the probability of a rate cut in December is estimated at 50/50. The market's attention is focused on September NFP data (forecast: +50K).
Gold is awaiting signals from the Fed and employment data. The Fed's cautious stance and weak NFP data could support further price growth.
Resistance levels: 4145 - 4211
Support levels: 4097, 4082, 4055
Gold is entering a long zone. Any correction could be a good opportunity to enter the market. Pay attention to key support levels for trend trading...
Best regards, R. Linda!
Gold 30-Min — Volume Sell Reversal Triggered⚡Base : Hanzo Trading Alpha Algorithm
The algorithm calculates volatility displacement vs liquidity recovery, identifying where probability meets imbalance.
It trades only where precision, volume, and manipulation intersect —only logic.
✈️ Technical Reasons
/ Direction — SHORT / Reversal 4090 Area
☄️Bearish rejection confirmed through sharp candle body.
☄️Lower-high forming beneath resistance supply region.
☄️Volume decreasing confirms exhaustion in price rally.
☄️Sellers regained imbalance with heavy top rejection.
☄️Algorithm detects fading demand and shift to control.
⚙️ Hanzo Alpha Trading Protocol
The Alpha Candle defines the day’s real control zone — the first battle of momentum.
From this origin, the Volume Window reveals where the next precision strike begins.
⚙️ Hanzo Volume Window / Map
Window tracked from 10:30 — mapping true market behavior.
POC alignment exposes institutional bias and breakout potential zones.
⚙️ Hanzo Delta Window / Pulse
Delta window monitors real buying vs. selling power behind each move.
Tracks volume aggression to expose who controls the candle — buyers or sellers.
When Delta aligns with Volume Map, momentum becomes undeniable.

Bias Still Bearish, But Confirmation Below 4050 Is Needed1. What Happened Yesterday
Gold continued to trade inside the well-defined 4050–4100 range discussed in the previous analysis.
Aside from a few small spikes, price respected the boundaries perfectly, confirming this as the current “decision zone” for the market.
2. Current Market Context
My outlook remains bearish, but as mentioned yesterday, nothing meaningful happens until 4050 breaks cleanly.
This level is acting as the floor of the range, while 4100 caps every bullish attempt.
We are simply waiting for confirmation.
3. Technical Outlook
The levels are very straightforward:
- Below 4050 → bearish continuation
A decisive break opens the path toward 3900, which remains the primary downside target.
- Above 4100 → bullish extension
A clear breakout and stabilization above 4100 would give scope for a move toward 4200.
Until one of these levels goes, expect more range-bound trading.
4. Trading Plan
No changes from yesterday:
Bias stays bearish, but only with confirmation below 4050.
If price breaks above 4100, short-term upside to 4200 becomes the higher-probability scenario.
5. Conclusion
Gold is trapped in a tight range, and the next major move will be decided by a clean breakout from 4050 or 4100.
For now, patience is key.

GOLD → Neutral price channel... Waiting for news FX:XAUUSD is testing the lower boundary of the 4060 channel and rebounding, maintaining moderate fluctuations in anticipation of key US data. Focus on 4040 - 4100...
The probability of a Fed rate cut in December has risen to 74% following comments by J. Williams
The unusual situation surrounding the Russia-Ukraine conflict means that any hints of de-escalation could trigger a correction in the metal...
The trading week will be relatively short, as Thursday and Friday are public holidays in the US, and the market may see reduced volatility.
Focus on the following news:
- PPI (forecast +0.3%) and US retail sales
- Q3 GDP and PCE index (inflation)
Gold remains sensitive to Fed comments and geopolitics. Strong data could lower expectations for policy easing. A breakout is likely after the release of inflation data and GDP. Rising odds of a rate cut in December limit downside potential.
Resistance levels: 4100, 4111
Support levels: 4040, 4024
Gold is being held within its current trading range. The last four trading sessions indicate uncertainty about the future direction. In this case, it is worth considering trading within the current boundaries first. I expect a retest of resistance and a subsequent downward rebound.
Best regards, R. Linda!

GOLD → Waiting for NFP... High importance level!FX:XAUUSD is stagnating ahead of the news. The market is in a phase of uncertainty, with long shadows and short candlestick bodies. The key factor will be the US employment data for September.
We have not seen unemployment data for more than seven weeks, which makes this data highly significant. Complete uncertainty. Significant deviations from forecasts could significantly change expectations for Fed rates. The probability of a Fed rate cut in December fell to 33% after the publication of the minutes, in which the regulator expressed concerns about inflation.
The market expects 50K jobs to be created in September, compared to 22K in August.
The unemployment rate is forecast at 4.3%, with wage growth at 3.7% year-on-year.
The further dynamics of gold depend on the NFP data. Weaker indicators may reinforce expectations of Fed policy easing and support price growth, while strong data will put pressure on the metal
Resistance levels: 4082 - 4111
Support levels: 4040, 4006
In the current circumstances, having only one scenario means narrowing your view of the situation as much as possible. The market can be aggressive on news. Weak data could lock the price within the current range (trading between graces). However, a breakout of resistance at 4082 - 4111 and a close above this level could trigger growth. Otherwise, a breakdown and consolidation below 4040 could break the current bullish trend and trigger a sell-off to 3930 (especially against the backdrop of the Fed's weak but hawkish stance).
Best regards, R. Linda!

Gold Analysis: Buyers vs Sellers Near Critical LevelsHello traders! Let’s take a look at XAUUSD (Gold). XAUUSD is currently trading within a broad corrective structure, moving between a well-defined Resistance Level near $4,100 and a strong Support Level around $4,030. Throughout the recent sessions, Gold has repeatedly reacted to these two key zones, forming clear ranges and turnarounds visible on the chart. Earlier, price created a large Range Phase, followed by a sharp rejection from the upper boundary of the descending Resistance Line, confirming continued selling pressure from higher levels. The repeated “Turned Around” reactions along this trendline show that sellers remain active every time price approaches the upper trend boundary. After breaking below the Seller Zone around $4,100, Gold retraced into the lower structure and entered the Buyer Zone, which aligns with both horizontal support and the ascending Support Line of the current bullish correction. This confluence makes the $4,030–$4,050 region a major demand area. Recently, XAUUSD bounced strongly from the Support Line, but the recovery stalled at the Seller Zone, where price is now showing signs of rejection once again. This confirms the zone as a significant barrier for buyers. A rejection from this level may trigger another downward movement toward the Support Level around $4,030, where buyers previously stepped in aggressively. As long as Gold trades below the descending Resistance Line and the $4,100–$4,110 area, the market retains a bearish-to-neutral tone. Only a clean breakout above this zone would signal a shift toward a stronger bullish phase and open the path to higher resistance levels. As long as XAUUSD remains below the $4,100 Resistance Level, sellers retain the advantage. I expect price to potentially reject the Seller Zone and move back toward the $4,050–$4,030 Support Level. A rejection from resistance sends price down toward $4,030, where buyers may attempt another defense. Break below this level opens the door for deeper correction. Overall, the market currently favors selling pullbacks into resistance, while the Support Line remains the key area for defending bullish structure. Please share this idea with your friends and click Boost 🚀

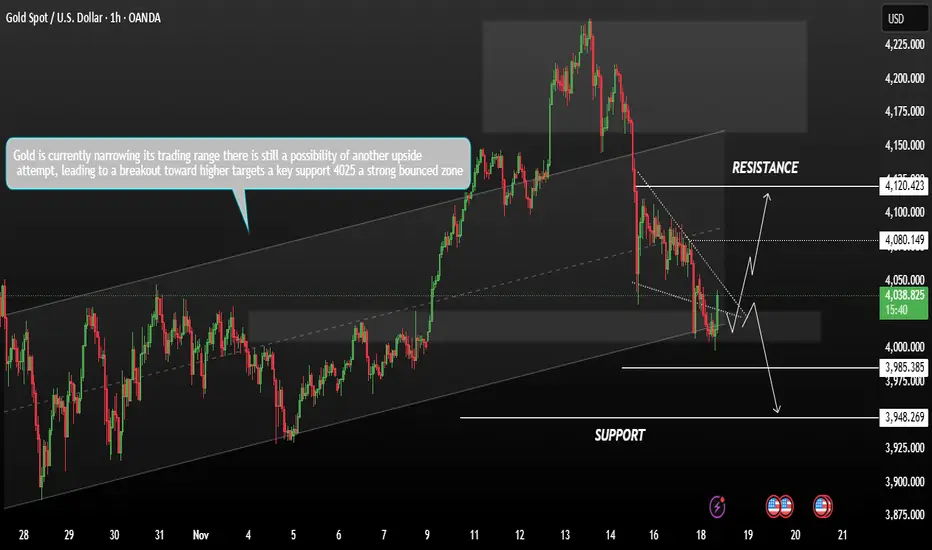
Gold Price Scenario trading range What should next ?Gold is currently narrowing its trading range and forming a triangle pattern, indicating a potential breakout setup on Tuesday, gold extended its decline, pressured by a strong U.S. dollar and reduced expectations of a Federal Reserve rate cut next month.
At the moment, gold remains in a consolidation phase as investors wait to see whether bullish momentum can continue if buyers regain control, and price breaks above the consolidation zone, the next resistance levels are expected at 4080 – 4120.
However, if price breaks below the support at 4025, this may signal renewed bearish momentum, with a psychological downside target zone of 3985 – 3948 as long as gold holds within the current range, there is still a possibility of another upside attempt, leading to a breakout toward higher targets.
You may find more details in the chart,
Trade wisely best of luck buddies.
Ps; Support with like and comments for better analysis Thanks for Supporting.