Lingrid | GOLD Weekly Support Hold Long OpportunityOANDA:XAUUSD pulled back sharply from the resistance and printed a higher low right at the confluence of the uptrend and above previous week low 4,050. Structurally, the broader upward channel remains intact while price retested the downward trendline from above, keeping the higher-low sequence alive. If 4,000–4,050 support continues to hold, it favor a rebound toward 4,245 and, if momentum extends, a run at 4,400; a daily close back below 4,043 would defer the bounce. Broader momentum still skews bullish with successive higher lows, suggesting the recent drop is a corrective pullback within the trend rather than a top.
⚠️ Risks:
A decisive break below 4,000 that invalidates the uptrend confluence could extend losses toward 3,950–3,900.
Strong USD and higher real yields on hawkish Fed rhetoric/data may cap upside or accelerate downside.
Diminishing geopolitical risk or risk-on equity strength could sap haven demand for gold.
If this idea resonates with you or you have your own opinion, traders, hit the comments. I’m excited to read your thoughts!
Trade ideas

Gold Pullback: Technical Correction Keeps the Main Trend IntactHello everyone,
Gold is currently trading around 4,112 USD on the H4 chart after a fairly deep correction. Many traders seem concerned seeing strong selling pressure, but a closer look at price action reveals this is merely a technical pullback, not a signal of a long-term trend reversal.
After the parabolic surge, gold paused due to profit-taking. The dense Fair Value Gaps (FVG) in the 4,050–4,130 USD area indicate plenty of “unfinished business” — liquidity has not been fully tested, stop-losses not swept, supply and demand not fully balanced.
The 4,050 USD zone is key support, both technically and psychologically for buyers. Holding above this level preserves the H4 uptrend structure. Meanwhile, the 4,130 USD zone presents a short-term resistance — FVG combined with the Ichimoku cloud — and gold must decisively handle this region to continue higher.
From the news perspective, the market is caught between two forces: anticipation of Fed rate decisions and the upcoming US CPI, which could trigger volatility; versus easing US–China tensions, temporarily reducing safe-haven demand. The recent selling was mostly profit-taking after a 5.5% rally earlier this month; buyers haven’t exited, they are merely reorganising positions before returning.
My preferred scenario: gold retests 4,050–4,070 USD, sweeps remaining liquidity, and then bounces to test 4,130 USD. Only if 4,050 USD breaks with high volume would the market likely head toward 4,000 USD, where buyers will defend aggressively. If it holds, a recovery is expected and gold could target higher levels.
Do you see this as a normal pullback or a precursor to a sharp drop? Share your thoughts below.

XAUUSDHello Traders! 👋
What are your thoughts on Gold?
Gold has reached a key support zone after a sharp two-day drop.
From this area, we expect a corrective rebound toward the broken structure.
This retest could complete a pullback phase before the next wave of decline resumes.
A short-term rally toward the resistance zone is likely.
If price shows rejection there, the next downside targets are expected to follow.
As long as price remains below the red resistance zone, the bearish bias remains intact.
Look for bearish confirmation signals on lower timeframes before entering short positions.
Don’t forget to like and share your thoughts in the comments! ❤️

GOLD (XAUUSD): Support & Resistance Analysis for Next Week
Here is my structure analysis for Gold for next week.
Support 1: 3868 - 3927 area
Support 2: 3766 - 3830 area
Support 3: 3690 - 3736 area
Resistance 1: 4023 - 4109 area
Resistance 2: 4187 - 4245 area
Resistance 3: 4357 - 4383 area
Consider these structures for pullback/breakout trading.
❤️Please, support my work with like, thank you!❤️
I am part of Trade Nation's Influencer program and receive a monthly fee for using their TradingView charts in my analysis.

XAU/USD Completing Wave Y: Final Dip Before RallyGold has completed its major 5-wave rise and is now finishing a corrective W-X-Y pattern. The recent drop looks like the final leg of this correction, meaning sellers are getting weaker. Price may show a small bounce up and then one last dip to complete the correction. After that final drop, a strong new uptrend is expected to start again. In short: correction ending soon, last dip big bullish move ahead.
Stay tuned!
@Money_Dictators
Thank you :)

Xauusd Bullish SetupThis Gold (XAU/USD) analysis presents a bullish setup on the 30-minute chart. The price is expected to rebound from the support zone around 4097, where a buy limit trade is placed. The stop loss is positioned at 4046 to manage downside risk. The analysis targets an upward move towards 4165 (first take profit), 4227 (second take profit), and a final target at 4318, indicating strong potential for a recovery and continuation of the uptrend.

Gold is about to experience a significant decline!Gold and Silver are ready to crash in next few days, It has a clear complete pattern of double 3 as w-x-y from Elliott wave analysis, and as whole this is only wave (ii), given the strength of wave (i), one can see a massive bearish move both in Gold and Silver.

Price Action: Long Term, Mid Term, Short Term Trend Explained
In this article, I will teach you the basics of market trend analysis.
We will discuss Long Term, Mid Term and Short Term trends.
I will show you how to identify and apply them properly.
Please, note that we will execute the trend analysis strictly on a daily time frame.
For the trend identification, we will rely on classics price action analysis rules.
We will say that the trend is bullish if the price forms at least 2 consequent bullish impulses with a retracement leg between them, so that the price would set at least 2 higher highs and a higher low between them.
We will say that the trend is bearish if the price forms at least 2 consequent bearish impulses with a retracement leg between them, so that the price would set at least 2 lower lows and a lower high between them.
If none of these conditions are met, we will say that the market is consolidating .
Long Term Trend
Long term trend is based on the analysis of a price action over 1 year.
To identify a long-term trend, start by analyzing the price action over a period of one year from the current trading day.
Analyze highs and lows.
According to the rules, the long term trend on USDCAD is consolidation.
Mid-Term Trend
Mid-term trend is based on the analysis of a price action over the last 5 months.
To identify a mid-term trend, start by analyzing the price action over a period of 5 months from the current trading day.
Analyze highs and lows.
According to our rules, the mid term trend on the pair is bearish.
Short Term Trend
Short term trend is based on the analysis of a price action over the last 2 months.
To identify a short-term trend, start by analyzing the price action over a period of 2 months from the current trading day.
Analyze highs and lows.
According to our rules, the short term trend on the pair is bearish.
According to our trend analysis,
long term trend is a consolidation,
mid-term trend is bearish,
short term trend is bearish.
Combining these 3 trends, we can derive that the pair is trading
in a huge range . After the price reached a resistance of the range, the price started to trade both in a short term and midterm bearish trends.
We can anticipate a bearish continuation till the price reaches a support of a long term range.
That is how you execute a trend analysis with price action.
❤️Please, support my work with like, thank you!❤️
I am part of Trade Nation's Influencer program and receive a monthly fee for using their TradingView charts in my analysis.

Gold Eyes 4,010 Support Ahead of CPI – Big Move Loading?Hey Traders,
In tomorrow’s trading session, we’re monitoring XAUUSD for a potential buying opportunity around the 4,010 zone. Gold remains in a broader uptrend and is currently in a correction phase, approaching a key support and resistance confluence around 4,010 that aligns with the ascending trendline.
Market Focus:
All eyes are on tomorrow’s U.S. CPI release, with expectations for headline inflation at 3.0% and core at 3.1%. A softer-than-expected print could weigh on the U.S. Dollar, potentially igniting fresh momentum for GOLD to resume its bullish trend.
Next Move:
Watching price action around 4,010 closely — if CPI data confirms disinflation, we could see a strong rebound toward recent highs as safe-haven demand strengthens.
💬 What’s your take on the CPI? Are you positioning long or waiting for confirmation? Drop your thoughts below!
Trade safe,
Joe

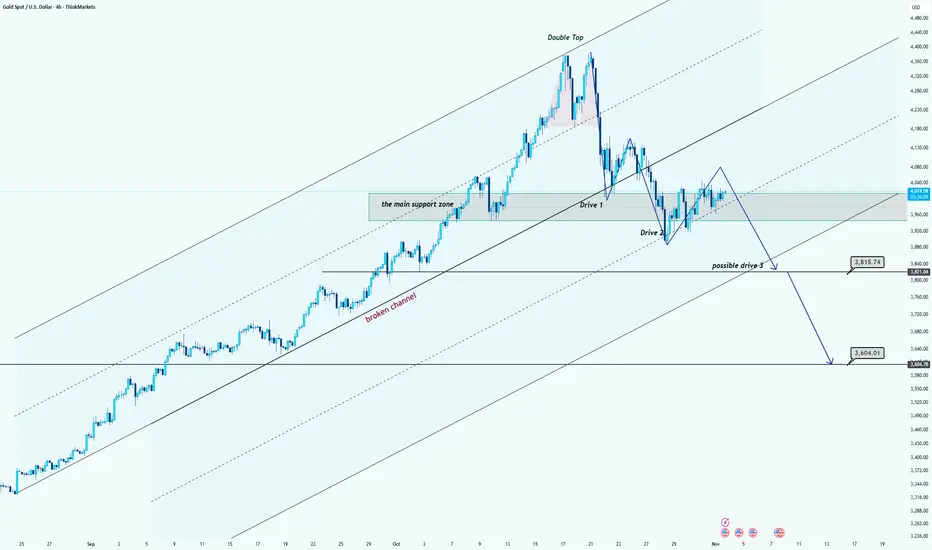
Gold Forming Bearish Three Drives Pattern Below Channel MidlineHi team!
Gold has formed a double top near the upper boundary of a long-term ascending channel, signaling potential exhaustion of the bullish momentum. After breaking below the local support and retesting it, price created a lower high, which confirms a short-term bearish structure.
Currently, the market is consolidating below the midline of the new channel. The recent sequence of moves is forming a potential Three Drives pattern, where Drive 1 and Drive 2 are already complete, and a possible Drive 3 could be developing.
If price fails to reclaim the main support zone around $4,000–$4,050, we can expect a continuation to the downside toward:
$3,815 – the first key support level and measured target for Drive 3.
$3,604 – the next major support zone and lower boundary of the broader channel.
As long as price remains below the recent swing highs, the bearish scenario remains valid. A clear break above the midline of the channel would invalidate this setup and suggest a potential reversal.
Disclaimer: As part of ThinkMarkets’ Influencer Program, I am sponsored to share and publish their charts in my analysis.
GOLD HIGH PROBABILITY SETUP SOON!!! 🚨 XAUUSD HIGH PROBABILITY BUY SETUP 🚨
* Here We Can See Clearly The Next Potential Moves For GOLD Coming Hours/Days.
* Keep Your Eyes Close On Your Trading Positions.
* Happy PIP Hunting Traders.
FXKILLA.

XAUUSD 4H Chart – Bearish Structure in Play📉 Technical Outlook
XAUUSD 4H Chart – Bearish Structure in Play
Gold continues its corrective phase after breaking the previous bullish structure.
Price formed a Lower Low, confirming a short to mid-term downtrend.
The 4H bullish order block around 3917–3935 is being retested, while the bearish OB near 3960–3980 acts as resistance.
As long as price stays below the 4H bearish OB, further downside movement toward 3750–3770 remains likely.
The structure shows potential for a short-term pullback before continuation lower.

Exclusive analysis of gold's future market.
What recent news is influencing gold's performance? How should we assess the outlook for gold's bullish and bearish outlook?
Gold prices weakened again in U.S. trading on Monday (October 27), extending last week's decline. With the thaw in U.S.-China trade relations, investor demand for gold as a safe-haven asset has declined. Market focus has now shifted to the Federal Reserve's interest rate decision, with the agency expected to announce a rate cut later this week. This decline comes just as gold's nine-week winning streak ended, after the price briefly surpassed $4,300 per ounce, reaching a record high, driven by geopolitical risks and expectations of monetary easing. The latest decline stems from progress in trade negotiations. U.S. and Chinese officials reached a preliminary agreement during the ASEAN Meetings in Malaysia, with the framework expected to be finalized later this week when the two presidents meet in South Korea. The agreement is expected to extend the trade truce and pave the way for a broader trade agreement. This suggests the risk of renewed trade friction has significantly decreased. Improving sentiment has driven investors' renewed appetite for riskier assets, weakening safe-haven demand for gold.
This week marks a "super week" for gold, and the gold market will continue its surge. First, the 2025 Asia-Pacific Economic Cooperation (APEC) Leaders' Informal Meeting will take place. US President Trump will also travel to Southeast Asia, where he will meet with leaders from various countries. Furthermore, amid the US government shutdown, a series of central bank interest rate decisions will be announced this week, including those from the Federal Reserve, the Bank of Japan, the European Central Bank, and the Bank of Canada. The US will also release a series of economic data, including the September core PCE price index, a key indicator for the Fed's interest rate adjustments, and third-quarter real GDP data. Expectations of a Fed rate cut at its October 29th meeting have limited further declines in gold prices. Last week's weaker-than-expected US Consumer Price Index (CPI) data reinforced market bets on a 25 basis point (0.25 percentage point) rate cut by the Fed. Traders are also watching for further easing signals this year. Generally speaking, rate cuts reduce the opportunity cost of holding gold and weaken the US dollar, making dollar-denominated gold more attractive to overseas buyers.
Gold Market Analysis on October 28th:
Gold Technical Analysis: Gold broke through the 4,000 mark as expected. We've been emphasizing short selling numerous times today, but did you miss out? Gold successfully broke through the 4,000 mark in the US market, and the US Treasury and spot gold markets showed clear signs of rotation. The US Treasury yield index re-entered the 4% mark, reflecting a subtle adjustment in market expectations for a Fed rate cut this week and a temporary outflow of safe-haven funds. The US dollar index fell slightly by 0.14% on the day, while spot gold remained under downward pressure. Based on the current 4-hour chart, gold still has room to fall. Focus is on the upward pressure at 4,010. A break above this level will open up further upward potential. I personally believe the upward trend will not break in the short term. Having already broken through the 4,000 mark, gold is poised to test the 3,945 level. If it fails to break through this level, it is likely to trade in a range-bound manner in the short term. Trading strategies suggest that rebounds from the upper resistance level could be opportunities for short selling.
After breaking through the neckline of the 1-hour double top, gold has been fluctuating weakly below it. The 1-hour moving average continues to diverge downward, indicating bearish momentum. A break below 4004 in the US trading session provided support, but this support has now become resistance. Therefore, any resistance below 4004 in the US trading session presents an opportunity to buy on rallies. Overall, today's short-term trading strategy for gold suggests shorting on rebounds, supplemented by buying on pullbacks. Focus on resistance at 4160-4185 in the upper short term, and support at 4010-4005 in the lower short term. It's crucial to keep pace with the market. Maintain control of your positions and stop-loss orders, set strict stop-loss orders, and avoid holding onto positions. Specific trading points are based on real-time intraday data. Welcome to experience and share real-time market trends.
Gold Trading Strategy Reference for October 28th
Short Strategy:
When gold rebounds to around 4004-4010, short (buy short) a 20% position in batches, targeting around 3960-3950. A breakout targets the 3945 level.
Long Strategy:
When gold pulls back to around 3945-3950, long (buy long) a 20% position in batches, targeting around 3980-4000. A breakout targets the 4010 level.

Gold key Levels (3800-4100)These are the Gold key levels which I’ll be using for trading.
Here’s how I trade these levels:
- Close above a level → Buy setup
When a candle closes clearly above a level, it confirms bullish momentum and I look to enter long immediately after the close.
- Close below a level → Sell setup
A confirmed candle close below support signals bearish strength, and I enter short right after the close.
- Rejection from a level → Opposite trade
If price shows a strong rejection from a level, I trade in the opposite direction - rejection from resistance = sell setup, rejection from support = buy setup.
These levels works well for both day trading (using 1H candles) and scalping (using 15M or lower timeframes). It keeps trading simple, just reactions to market behaviour.

GOLD (XAUUSD): Short Trade Before the FED
I see an intraday pullback trade on Gold ahead of
FOMC & FED Interest Rate Decision today.
The price will likely retrace from the underlined resistance,
following a confirmed bearish imbalance and a formation
of a double top pattern.
Expect a bearish movement at least to 3988 level.
❤️Please, support my work with like, thank you!❤️
I am part of Trade Nation's Influencer program and receive a monthly fee for using their TradingView charts in my analysis.

gold usdHI GUYS,
GOLD usd is on the right shoulder , expect buys in london session to Take profit GRAND FINAL H4 HS

Gold Pullback Could Be the Next Buying OpportunityHello, traders, I want share with you my opinion about Gold. The market for Gold has been trading within a clear bullish structure, forming an ascending channel since breaking out from the earlier range near the 4,050–4,100 zone. The breakout from that consolidation led to strong upward momentum, with price making consistent higher highs and higher lows. Recently, the market faced strong selling pressure from the Seller Zone near 4,366, which aligns with the Resistance Level. After a retest of this supply area, price rejected and started a correction within the channel. The price is approaching the Buyer Zone around 4,205, which also coincides with the lower boundary of the ascending channel and the previous support level. This confluence makes the area significant for potential bullish reactions. I expect Gold to retest the Buyer Zone (4,205) and, if buyers show strength, a bounce toward 4,320–4,366 could follow. This would represent the continuation of the uptrend within the ascending channel. However, if price breaks below 4,205, it would signal a possible shift in structure and open the door for a deeper correction toward the 4,100 area. Please share this idea with your friends and click Boost 🚀

Gold 30Min Engaged ( bullish After Break Detected )Status: Active Reversal Protocol
Symbol: Gold
Session: London–New York Overlap (Smart Exit Window)
Bullish After Break 4030
Bias: Bullish & bearish Reversal
☄️ Volume Surge Confirmed — Sellers dominate exhausted highs
☄️ Session Aligned — Smart money exit window open
☄️ Cluster Shield Active — Supply imbalance verified
☄️ Delta Shift Negative — Buyers trapped above
☄️ POC Retest Completed — Liquidity absorbed at resistance
☄️ Structure Break Pending — Bearish bias confirmed

GOLD | Bearish Bias Holds Below $3,944 Amid Trade OptimismGOLD – MARKET OVERVIEW | Trades Below $4,000 as Risk Appetite Rises
Gold continues to slide, as optimism over a potential U.S.–China trade deal and improving global outlook weakens demand for safe-haven assets.
The metal is now down nearly 10% from its all-time high of $4,377 (Oct 20), with the recent rally losing steam as traders take profits amid signs of progress in trade negotiations between the world’s two largest economies.
Technical Overview
Gold dropped nearly $150, exactly as projected in our previous outlook.
The price remains under bearish pressure while below 3,944, targeting 3,893, and a break below that could extend the decline toward 3,855 → 3,818.
However, a 1H close above 3,944 would indicate a potential reversal, opening the way for a retest of 3,970 → 4,011.
Key Technical Levels
Pivot Zone: 3,932 – 3,944
Support: 3,893 · 3,855 · 3,819
Resistance: 3,970 · 4,011 · 4,053
Outlook:
Gold stays bearish below 3,944, with downside potential toward 3,855 if trade optimism persists.
Only a confirmed 1H close above 3,944 would shift bias back to short-term bullish toward 4,011.

GOLD (XAUUSD): Another Pullback Trade
Gold is testing a major daily resistance that we spotted earlier again today.
It looks like the price may retrace from that one more time.
A bearish breakout of a support line of a rising channel is my
intraday confirmation.
Goal - 3989
❤️Please, support my work with like, thank you!❤️
I am part of Trade Nation's Influencer program and receive a monthly fee for using their TradingView charts in my analysis.

XAUUSD - Bears are taking over Gold remains under bearish pressure as it trades below key moving averages and fails to reclaim the 61.8% retracement zone. A confirmed 4H close below $3,920 would strengthen the case for a continuation toward the Fibonacci extension targets listed below.
🎯 Fibonacci Extension Targets (Bearish)
Using the latest swing high to swing low:
Target 1 (38.2%) → $3,832
Target 2 (61.8%) → $3,808
Target 3 (100%) → $3,776
Bias: Bearish continuation
Confluences:
Trend Structure: Price is forming lower highs and lower lows after rejecting from the previous swing high, confirming a bearish market structure.
EMA Ribbon / Dynamic Resistance: The price is trading below the EMA ribbon, which is now acting as a strong dynamic resistance zone.
Fibonacci Retracement: Price rejected from the 61.8% retracement level of the previous downswing — a key bearish retracement zone.
Momentum Indicators: Bearish momentum increasing as candles close below the midline of the ribbon with low buying pressure.
Volume/Confirmation: Decreasing bullish volume on retracement, followed by renewed selling pressure.

Gold: Last Chance to Exit
The last forecast rode the upside nicely. Now we’re getting local setups. Near term, I expect a return to $4,115–$4,186, with a preferred target at $4,160. The decline reads as a zigzag (with a triangle in the middle), so I’m looking for a rebound into that range. More soon.

Gold on side Swings on Fed aftermathAs discussed throughout yesterday's session: 'My position: I am Buying Gold aggressively throughout yesterday's session all along especially when #3,952.80 benchmark got invalidated to the upside. Gap to the downside on Asian market opening delivered excellent chances to Buy more as I closed all orders with #4,000.80 Take Profit. Keep in mind that I might Sell #4,024.80 now (aggressive Scalp to the downside) only to Buy more. #4,052.80 benchmark and #4,100.80 extension are my Targets.'
If you followed Trading plan I announced above, you would be in excellent Intra-day Profits. I have Sold Gold from #4,027.80 High's multiple times and re-Bought Gold from #4,004.80 especially delivering excellent results and altered all my Trading activity (no need to gamble on Fed Rate decision aftermath). My Profit is excellent and will sit out today's session as it will be full of side-Swings where I will continue comfortable Trading throughout tomorrow's session.
