Trade ideas

DeGRAM | GOLD seeks to decline📊 Technical Analysis
● Price trends inside a descending channel, posting lower highs after rejections at ~4045; latest pullback broke intraday base and points toward mid-channel.
● Bearish structure with failed bounce at prior support (~3950) keeps momentum down; next magnet sits near 3855 (channel/HTF support confluence).
💡 Fundamental Analysis
● Short-term bearish: stronger USD and improved risk appetite recently weighed on gold after the retest of record highs, triggering corrective pressure.
✨ Summary
● Bias: short toward 3950 → 3855, invalidation above 4045. Key levels: 4045 (res), 3950/3855 (supports).
-------------------
Share your opinion in the comments and support the idea with a like. Thanks for your support!

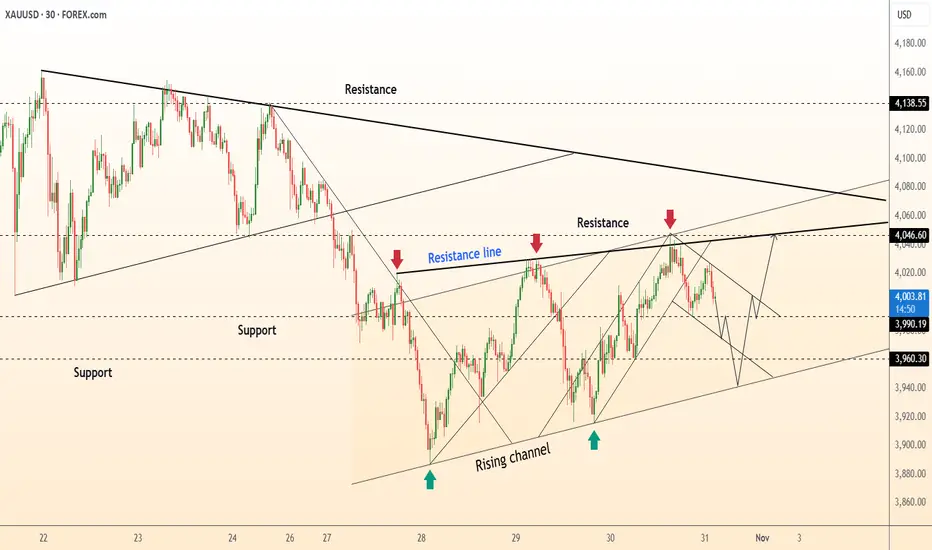
DeGRAM | GOLD is forming a new local ascending structure📊 Technical Analysis
● XAU/USD is forming a rising channel, holding firm above 3,960 support after rejecting from the resistance near 4,046.
● The pattern suggests a continuation of the uptrend as long as price sustains above the channel base, with potential breakout targets toward 4,138.
💡 Fundamental Analysis
● Gold remains supported by a softer dollar and cautious market sentiment ahead of key U.S. employment data, which could further boost safe-haven demand.
✨ Summary
● Long bias above 3,960; targets 4,046–4,138. Rising structure and weaker dollar fundamentals reinforce short-term bullish momentum.
-------------------
Share your opinion in the comments and support the idea with a like. Thanks for your support!
Gold Extends Decline Below $4,000 as Risk Appetite Returns🔍 Market Context
Gold continues to struggle amid renewed optimism around US–China trade talks.
The shift in sentiment has reduced safe-haven demand, while softer expectations of further Fed rate cuts keep the US Dollar capped — offering limited downside support for XAUUSD.
However, the technical landscape remains clearly bearish.
The break below the $4,000 handle confirms continuation of the downtrend first outlined in early-week plans.
📊 Technical Analysis
Structure: Gold maintains a clean bearish channel on the H1–H4 frame.
Immediate resistance: $3,985 – $4,000 (former support, now supply zone).
Target zones:
• Short-term liquidity area near $3,925–$3,930
• Extended target sits around $3,880–$3,860, aligning with Fibo 1.618.
Invalidation: Only a sustained break and hold above $4,020–$4,030 would neutralize this short-term bearish bias.
🎯 Trading Outlook
If gold retests the broken $4,000 zone and fails to regain it,
expect sellers to extend control toward $3,920 or lower ahead of the FOMC meeting.
That event may later define the next recovery point — but for now, momentum remains firmly on the downside.
⚜️ Summary
Gold’s recent slide isn’t random — it’s structural.
The market is rebalancing after excessive bullish sentiment,
and liquidity below $3,900 is likely to attract attention before any significant rebound.
Watch the reaction near $3,920–$3,880 —
that’s where the next meaningful decision for gold may emerge.
📊 MMFLOW TRADING Insight:
“Smart money doesn’t chase candles — it waits for liquidity to shift.”

GOLD 15MIN STRCUTURE GOLD SELL OFF IS CRAZY . NEW SUPPORT 3885-3880
THE YELLOW METAL SELLOFF CONTINUES ON FOMC FEDERAL FUND RATE OUTLOOK.
All eyes are now on the Fed’s monetary policy verdict , as the US government shows no signs of reopening.
Market are almost fully pricing in two interest rate cuts this year, with a 25 basis points (bps) cut .
the key technicality surrounding gold trading is as follows
the 4hr EMA10,EMA20,EMA50,EMA100 are all above price supporting bearish take profit only the 4HR EMA200 IS below price acting as dynamic support on 4hr at 3945-3940 + ema 200 support for buy.
THE CURRENT 15MIN SUPPORT 3885-3880
THIS WILL BE LAYER BY LAYER.
THE DOLLAR INDEX BROKEN OFF 98.757 SUPPORT FLOOR INDICATING A POSSIBLE EFFECT ON RATE CUT COMING ,HOWEVER THIS PRICE ACTION PUT GOLD LONG POSITION ON CAUTIOUS MODE.
THE UNITED STATE 10 YEAR TREASURY BOND YIELD CLOSE IN MASSIVE SELLOFF TO CLOSE BELOW 4.0% MARK AT EXACTLY 3.987%
GOLD CORRECTION IS PLAYING ON CAUTION AND the next demand floor will around 3767.90-3764-3760
finally the last layer by layer will be 3700-3706 my pay day zone ....at this level expect to see the hand of GOD.
NOTE;gold trading is very volatile but comes with liquidity ,pls manage your risk and i wish you good luck.
#GOLD #XAUUSD #DXY #US10Y

Policy essence: "Eagle-wing rhetoric" concealing a loose coreThe trend significance of the interest rate cut decision: This interest rate cut is the second one in 2025, with a cumulative easing of 50 basis points, and the dovish forces in the voting results were significantly dominant - Milan's radical proposal to cut interest rates by 50 basis points was not passed, but the only opponent against the rate cut was Schmidt, with 10 votes in favor, highlighting the "loose consensus". This is a fundamental difference from the "consecutive rate hikes" tone in 2023. Historical data shows that the probability of initiating continuous easing within 3 months after the first rate cut is 83%, with the average gold price rising by more than 7%, and the current price has not reflected this trend.
The liquidity booster from the termination of the balance sheet: The Fed clearly stated that it would completely end the balance sheet reduction on December 1st. The easing strength of this action has been severely underestimated by the market. From historical experience, within 1 month after the termination of the balance sheet reduction in 2019, the gold price rose by 4.2%, while the bank reserves have dropped to the critical level of 2.93 trillion US dollars, and the termination of the balance sheet reduction will directly release over 300 billion US dollars of liquidity. This "interest rate cut + balance sheet expansion" combination is precisely the core driving force for the rise of gold, and the price of 3924 US dollars underestimates this pricing.
The misleading sentiment of Powell's statement: Powell emphasized that the interest rate cut in December is "not a certainty", which is actually a cautious statement in the absence of data - the US government shutdown led to the delayed release of data such as the September CPI, and the Fed needs to reserve flexibility for its policies. However, the non-farm payrolls added only 12,000 in October (far below the expected 113,000), and the core data of weak private sector employment has already laid the groundwork for the interest rate cut in December. Interest rate futures show that the probability of an interest rate cut in December is still 67%, and the speech did not completely reverse this.
Today's gold trading strategy
buy:3915-3925
tp:3940-3950
sl:3895

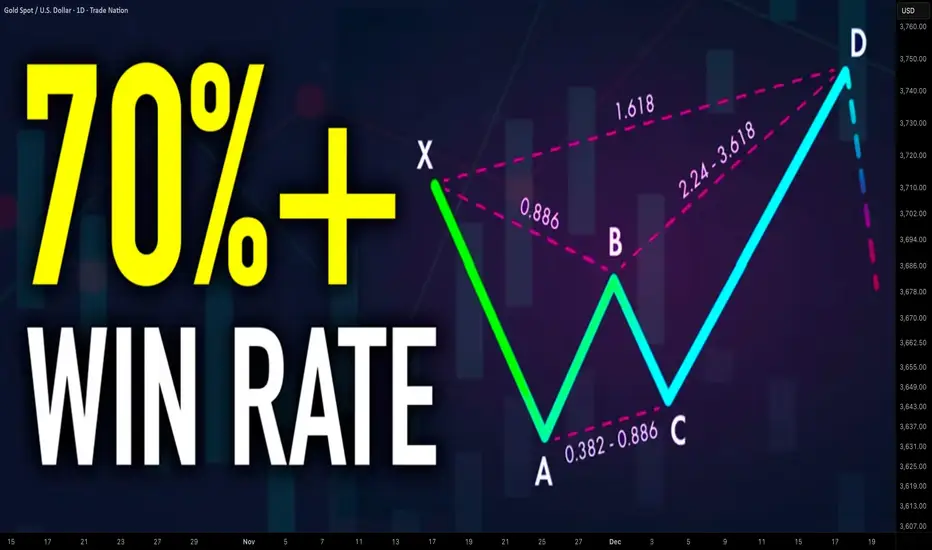
Best Harmonic Patterns For Beginners in Forex Gold Trading
In the today's article, I will share with you 4 best harmonic patterns for beginners. We will discuss the structure of each pattern and the rules.
Harmonic ABCD Pattern
That pattern is based on 3 legs of a price movement:
AB leg - impulse leg,
BC leg - retracement with the range of XA leg,
CD leg - impulse leg that has the same direction, the same time horizon and the same length as the XA leg
AB and BC legs should be equal or almost equal, that makes the pattern harmonic.
The completion point of the pattern - D point can be applied for predicting a pullback.
ABCD pattern can be bullish and bearish.
In a bullish ABCD pattern, AB leg is bearish.
D point of the pattern will be a safe point to buy from.
In a bearish ABCD pattern, AB leg is bullish.
D point will be a safe place to sell from.
The next 3 patterns will be based on 4 legs of a move:
XA, AB, BC, CD and will have XABCD structure with the initial point of the pattern being X point.
D point will be a completion point of the pattern from where a pullback will be anticipated.
The type of the harmonic pattern will be identified with Fibonacci numbers. The exact placement of each point of the pattern will define the name of the pattern.
Harmonic Gartley Pattern
In Harmonic Gartley,
B point of the pattern should strictly be between 618 and 786 retracement of the XA leg.
C point should lie between 618 and 786 retracement of AB leg.
D point will be 1.272 extension of AB leg.
Bullish Gartley Pattern will be based on a bullish XA leg.
Bearish Gartley will be based on a bearish XA leg.
Harmonic Bat Pattern
In Harmonic Bat,
B point of the pattern should strictly be between 50 and 618 retracement of the XA leg.
C point should lie between 618 and 1 retracement of AB leg.
D point will be 886 retracement of XA leg.
Bullish Bat Pattern will be based on a bullish XA leg.
Bearish Bat will be based on a bearish XA leg.
Harmonic Cypher Pattern
In Harmonic Cypher,
B point of the pattern should strictly be between 382 and 618 retracement of the XA leg.
C point should lie between 1.272 and 1.414 extension of XA leg.
D point will be 786 retracement of XC leg.
Bullish Cypher will be based on a bullish XA leg.
Bearish Cypher will be based on a bearish XA leg.
These patterns are phenomenally accurate and they are very simple to recognize.
❤️Please, support my work with like, thank you!❤️
I am part of Trade Nation's Influencer program and receive a monthly fee for using their TradingView charts in my analysis.
Gold price adjusted down below 4000 next week✍️ NOVA hello everyone, Let's comment on gold price next week from 11/03/2025 - 11/07/2025
⭐️GOLDEN INFORMATION:
Gold (XAU/USD) edges lower on Friday, slipping below the $4,000 mark as traders reassess the Federal Reserve’s (Fed) policy outlook after this week’s rate cut. The metal trades near $3,985, down about 1% on the day and heading for a second consecutive weekly loss.
A stronger US Dollar and steady Treasury yields weigh on Gold, as markets trim bets on another Fed rate cut this year. Chair Jerome Powell signaled a cautious stance, noting that a December cut is “not a foregone conclusion” and policy will depend on incoming data.
⭐️Personal comments NOVA:
Gold price lacks bullish momentum, accumulates and corrects down below 4000
🔥 Technically:
Based on the resistance and support areas of the gold price according to the H4 frame, NOVA identifies the important key areas as follows:
Resistance: $4154, $4235
Support: $3953, $3884
🔥 NOTE:
Note: Nova wishes traders to manage their capital well
- take the number of lots that match your capital
- Takeprofit equal to 4-6% of capital account
- Stoplose equal to 2-3% of capital account
- The winner is the one who sticks with the market the longest

Gold Buy Setup AgainHi All,
Hope you are all fine.
Everyone is saying that Gold will crash which doesn't seems to be the case the way I am analyzing it (Subhaan Allah). Not praising myself (sorry for that) but it seems to go up again as described on the chart. I have entered buy and anyone want to jump in can wait for a small retracement and enter.
Rest Green Pips to All
Amen

Gold Slippery Slide - Rebound or Breakdown Ahead?Gold has pulled back sharply from its all-time high of 4380, slipping to the key psychological level of 4000 — and today, that threshold gave way, printing a low of 3972.
This breach opens the door to deeper liquidity zones around 3900, 3800, and even 3700, where resting orders may be swept.
Yet despite the drop, the broader uptrend remains intact, suggesting potential for a rebound once liquidity is harvested.
As price approaches these pivotal levels, it's crucial beneath monitor lower timeframes for signs of a reversal (especially when structure shifts beneath the surface)

Gold Trade Plan 31/10/2025Dear Traders,
The price is ranging between the 4000–4040 zone and is still moving within the larger descending channel on the higher timeframe. At the same time, there is a smaller channel where the price is currently moving. If the daily candle closes above 4040, the price is expected to rise toward the 4100–4120 area. However, if it closes below 4000, I expect a decline toward the 3940–3900–3850 zones. Given the monthly candle close, high volatility is anticipated.
Regards,
Alireza!

Gold sellPrice is in a POI and intraday structure is bearish. Plus, at current price action there is a structural disruption.

Gold 1H Trend Reversal Setup | 4000 | 4100Market Outlook
Gold has recently shown signs of a potential bullish reversal after breaking above a descending trendline.
The market has shifted from a short-term bearish trend into a possible accumulation phase, with buyers stepping in near 3896–3940 support.
🧭 Technical Breakdown
1️⃣ Structure Break:
Price broke the descending trendline, showing momentum shifting from bearish to bullish control.
2️⃣ Retest Zone:
Retest area 3939–3960 aligns with a previous short-term supply zone, now turning into potential demand.
3️⃣ Target Zone:
If bullish momentum holds, the next major upside target lies between 4120–4160, where higher-timeframe resistance and liquidity exist.
4️⃣ Invalidation Level:
A clean 1H close below 3939 would invalidate this bullish setup and suggest further downside toward 3896.
Trade Idea (Educational Purpose Only)
Parameter Price Level Explanation
Buy Zone 3940–3960 Retest of broken structure
Targets 4040 → 4120 → 4160 Major resistance & liquidity area
Invalidation Below 3939 Break below support invalidates setup
💬 Summary
Gold is setting up for a possible reversal rally, but confirmation is key — wait for a strong bullish candle on retest before considering continuation.
⚠️ This analysis is for educational and discussion purposes only — not financial advice.

Potential Gameplan Scalp/Swing for Tues 27 OctPotential move and execution area for scalping or swing trading.
Let's see how it plays out and when it will play out.
Reminder: For educational purposes only.
@TeamWePrint

GOLD XAU/USD Strong Bullish Trend trade on breakoutGOLD (XAU/USD) 1H FORECAST 💰
We’re seeing strong bullish momentum on the 1-hour time frame! 🔥
Price action is approaching a key breakout zone around 4035 — a decisive breakout above this level could confirm further upside momentum 📈
🎯 Technical Targets:
• 4054 💎
• 4075 ⚡
• 4110 🚀
As long as the breakout holds above 4035, we remain bullish in the short term. 🟩
⚠️ Risk Management Reminder:
Always use proper risk management and wait for confirmation before entering any position! 🧠
💬 Like | 🔁 Share | 💎 Comment your views below!
#XAUUSD #Gold #Trading #Forex #TechnicalAnalysis #Breakout #BullishTrend

XAUUSDGold: The main trend remains up, but after testing the $4,380 level, the price was unable to break above this level and the price declined. We expect this to be a correction, with key support levels at 3,885 and 3,857. If the price can hold above 3,857, there is a high chance that the price will continue to rise.
** Very Risky Trade
🔥Trading futures, forex, CFDs and stocks carries a risk of loss.
Please consider carefully whether such trading is suitable for you.
>>GooD Luck 😊
❤️ Like and subscribe to never miss a new idea!

GOLD SELLERS WILL DOMINATE THE MARKET|SHORT
GOLD SIGNAL
Trade Direction: short
Entry Level: 4,010.34
Target Level: 3,889.94
Stop Loss: 4,089.87
RISK PROFILE
Risk level: medium
Suggested risk: 1%
Timeframe: 4h
Disclosure: I am part of Trade Nation's Influencer program and receive a monthly fee for using their TradingView charts in my analysis.
✅LIKE AND COMMENT MY IDEAS✅

my crush told me about gold After people all over the world lined up in front of gold shops, you can already assume that within the next three months, the market will inevitably collapse. However, I don’t believe the current decline marks the true end. Investors haven’t completely lost hope in the market yet. And as long as there’s hope, there’s still buying demand.
A sharp one-way crash from here would be too easy for short-term speculators, short traders, and the so-called “Smart Money” — the top 1% who have driven gold prices up since the beginning of the year with enormous capital. They won’t sell their positions at prices that are too low or too quickly.
That’s why I think there’s a high chance of one more rebound, possibly pushing prices to the level where people start believing gold will reach $5,000 per ounce. Of course, the market never moves the way the majority expects.
Therefore, I see the $4,600–$4,8XX zone as an ideal area to take profits or open short positions. Nothing can rise parabolically forever — greed always has an end, and eventually, it turns into fear. When that happens, the market collapses.
NFA — I’m just writing this so I can sleep.

Gold is Ready For Bull From SupportHello Traders
In This Chart GOLD HOURLY Forex Forecast By FOREX PLANET
today Gold analysis 👆
🟢This Chart includes_ (GOLD market update)
🟢What is The Next Opportunity on GOLD Market
🟢how to Enter to the Valid Entry With Assurance Profit
This CHART is For Trader's that Want to Improve Their Technical Analysis Skills and Their Trading By Understanding How To Analyze The Market Using Multiple Timeframes and Understanding The Bigger Picture on the Charts

ANFIBO | XAUUSD - Soboring today [10.30.2025]Hi traders, I'm here, Anfibo.
XAUUSD Analysis – Daily Trading Plan
Trading Plan for Today:
>>> SELL ZONE:
ENTRY: 4135 - 4150
SL: 4165
TP: 4045 - 4010 - 4000
>>> BUY ZONE:
ENTRY: around 3935
SL: 3915
TP: 4020 - 4080 - 4135 - ...
Risk Management:
- Prioritize Buy setups following the higher-timeframe trend; Sell only for intraday scalps.
- Maintain a minimum Risk:Reward ratio of 1:2.
- Avoid entries during major geopolitical or economic announcements.
- Monitor the Head & Shoulders pattern closely — confirmation will guide the next major move.
Conclusion:
Gold has completed a healthy correction after its parabolic surge to $4,400, and the market is now regrouping around the $4,000 zone, with early signs of renewed bullish momentum. As long as $3,890 remains intact, the broader trend remains bullish, and I expect a potential rebound toward $4,200 in the near term.
GOODLUCK, LOVE U GUYS!

Gold price analysis October 28📉 GOLD UPDATE – Correction Phase Continues
Gold remains under bearish pressure as buyers failed to hold the price above 4057, confirming that sellers are back in control. The market structure now supports a continued corrective move toward the 3955 support zone during the European session. A further breakdown below this level could open the way to 3892, which serves as the next key downside target.
For now, the focus should remain on SELL setups during the London session. Any BUY positions would be considered counter-trend and only valid if price shows strong rejection signals at key supports or reclaims the 4057 zone.
🎯 Trading Plan
SELL trigger: Price rejection at resistance zone 4050
SELL DCA: On break below 3955
Target: 3890

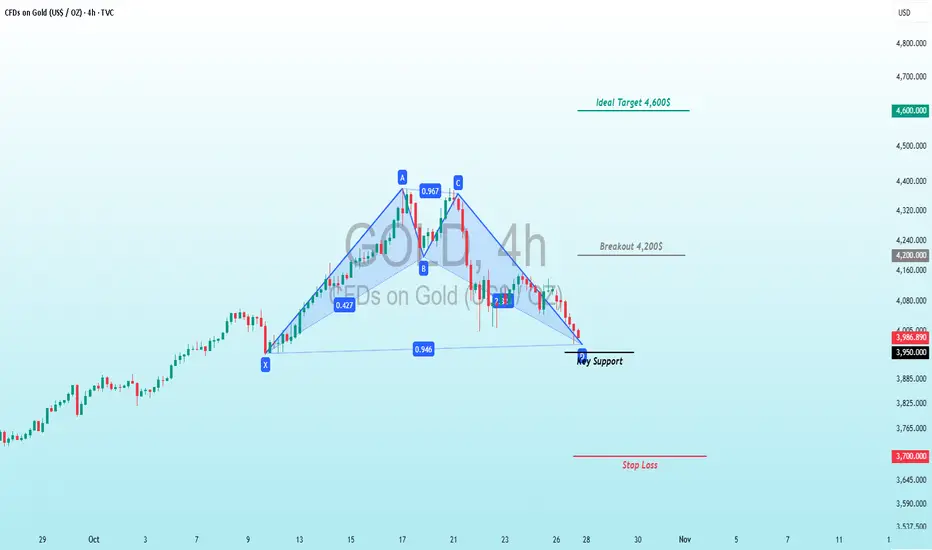
CFDs on Gold (USD/OZ) Symmetrical Triangle Squeeze Setup!TVC:GOLD
🟡 CFDs on Gold (USD/OZ) Symmetrical Triangle Squeeze Setup! 📊
TVC:GOLD 's been on a rollercoaster since early Oct! 🚀 Starting from a solid base at Point A (~$3,730 on Oct 3) 🏗️, it powered up in a steep ascending channel 📈, smashing through resistance to hit euphoric highs at Point B (~$4,600 by Oct 15) – a whopping +23% pump fueled by green marubozu candles, surging volume, and RSI blasting overbought at 75 amid safe-haven flows. But greed turned to fear: A sharp reversal kicked in at Point C, forming a classic symmetrical triangle consolidation 🔺 between ascending support (blue line from A-B) and descending resistance (from C), coiling tight over 10+ days with contracting volatility – MACD flattening, Bollinger Bands squeezing like a spring ready to pop!
Fast-forward to Oct 27: Price's testing the apex near $3,989 (up +3.989% short-term) ⚖️, hovering at the 0.47 Fib retracement level from the A-B swing 🕸️ (key support at $3,950, resistance at $4,070). Breakout north? Bulls could rocket to $4,200 (5.5% quick gain) or full measured move to $4,600 retest for +15.5% profit 💰 from here – ideal for longs with stops below $3,900. Bear breach? Down to $3,700 (-7%) for shorts. Geopolitics + Fed whispers = high octane – watch volume explosion! ⚠️
#GoldTrading #CFDs #CommodityBreakout
xauusd 3894 or 4060 today?October 29, 2025, XAU/USD has specific price targets. The gold price is currently around $4,018, and traders are focusing on key technical levels and the upcoming Federal Reserve interest rate decision.
Below is a summary of the key price levels to watch before the market closes today.
Analysis Type Key Resistance Key Support Primary Target Alternative Target
Technical & Scenario-Based $4,005.79 $3,951.68 $4,059.90 - $4,114.01 (if resistance breaks) $3,893.96 (if support breaks)
Bearish Correction - $3,940 $3,870 -
Range-Bound $4,010 $3,860 Movement between $3,860 and $4,010 -
🚨 Key Market Driver Today
The single most important event influencing gold's movement today is the Federal Reserve's interest rate decision. Markets are overwhelmingly expecting a 25-basis-point rate cut, and how the market reacts will depend heavily on the tone (dovish or hawkish) set by Fed Chair Jerome Powell.
Dovish Signal (Bullish for Gold): If the Fed signals openness to further easing, it could weaken the US Dollar and help push gold above the $4,005 resistance toward the higher targets.
Hawkish Signal (Bearish for Gold): If the Fed suggests this cut is a "one-and-done" move, it could strengthen the Dollar and trigger a sell-off in gold, pushing it down to test the $3,951 support and potentially lower.
💡 A Note for Your Trading
Conflicting Signals Exist: While one technical model suggests a potential rise to $4,010, another maintains a bearish outlook with a target of $3,870, contingent on the price staying below $3,940. This highlights the market's uncertainty ahead of the Fed news.
Trade the Reaction: Many analysts advise waiting for the price to convincingly break through one of the key levels ($4,005 resistance or $3,951 support) before committing to a new trade direction, rather than anticipating the move prematurely.
In summary, for the remainder of today's session, watch the $4,005 resistance and $3,951 support levels. The Fed's announcement will likely determine whether the price moves towards $4,060 or falls back to $3,894.
