The upward wave has ended.Since the past and the $2000 gold price, we have provided and updated our gold analysis, stating that wave-(E) of gold has started.
In our latest analysis, we mentioned that gold could rise to a maximum of $4330–$4401, and prices above this range would not be sustainable.
Currently, in my opinion, the post-pattern move has been confirmed, and we can say that wave-(F) has begun. This corrective wave could take approximately 2 years, after which gold's upward trend may resume. Gold prices could fluctuate between $3100–$4300, and the most likely pattern for wave-(F) could be a triangle or a diametric.
Good luck
NEoWave Chart
Trade ideas

XAUUSD M30 TIME FRAME CHART ANALYSIS CONFIRMED TARGET I'm going to SELL now long Short entry 4026
Take profit 4000
Take profit 3980
Target 3964
Stop loss 4044
Are you agree 🔥

GOLD The Target Is DOWN! SELL!
My dear friends,
My technical analysis for GOLD is below:
The market is trading on 4022.7 pivot level.
Bias - Bearish
Technical Indicators: Both Super Trend & Pivot HL indicate a highly probable Bearish continuation.
Target - 4010.3
Recommended Stop Loss - 4030.0
About Used Indicators:
A pivot point is a technical analysis indicator, or calculations, used to determine the overall trend of the market over different time frames.
Disclosure: I am part of Trade Nation's Influencer program and receive a monthly fee for using their TradingView charts in my analysis.
———————————
WISH YOU ALL LUCK

Trade idea on xauusdSell at current market price near 3975.00
Use the parameters on the chart for the SL and Tp
Apply proper risk management

1500 Pips – No One Does It Like UsWhile others talk — we execute.
Every pip tells a story of patience and precision. ⚡
Stay hungry, stay humble, and let your results speak louder than words. 💎
✨ Precision. Patience. Profit.

Gold compression before expansionGold remains in a controlled accumulation phase after a strong move, holding rising lows and respecting the fair value zone near 3990. As long as buyers defend the 3985–4000 range, the setup favors a false dip and re-entry scenario with continuation higher. A clean break and hold above 4040 unlocks the first target at 4110, and extension toward 4200 remains valid on structural expansion and Fibo alignment. The market is balanced on a hinge: levels are defined, buyers present, but confirmation lies only in price reclaiming the breakout zone.
Fundamentally gold still tracks macro uncertainty. Rates, inflation expectations, dollar hesitation and US debt dynamics keep capital rotating defensively. This is one of those periods where expectations and reality diverge, and the longer the compression holds, the stronger the eventual move. Still, discipline first — price must confirm above 4040.
Bias remains bullish while above 3985. Break below opens a corrective path toward 3920–3890 before another attempt higher.

Gold: Tests key $4K levelThe most important news during the previous week was related to the Fed cut of reference interest rates by 25 basis points. Although the market was previously expecting another rate cut in December, Fed Chair Powell commented that such a course of action is currently questionable for Fed members. At the same time, other risks which previously pushed the price of gold to ATH have eased, so the price of gold remained in a quest to find a new equilibrium level. Analysts from Morgan Stanley stated on Friday that they are still estimating potential gains for gold, driven by interest rate cuts, ETF inflows, central bank buying, and persistent economic uncertainty. The bank projects gold will average $4,300 during the first half of 2026.
As expected, gold dropped during the previous week to the lowest weekly level at $3.888. The price reversed a bit for the rest of the week, closing it at $4.002. The level of $4K currently represents a significant level for gold. The RSI is still moving above the level of 50, however, it is on a course to reach the oversold market side in the coming period. On the other hand, moving averages of 50 and 200 days continue to move without a change from the previous period, as two parallel lines with an uptrend.
Charts are suggesting that the level of $4K will be the level to watch for another week in a row. The week ahead will start by testing this level. In case that it is not breached, there is a probability that the gold will revert back, where $4,1K could be a short term target. In case that selling orders prevail in the week ahead, then $3,9K will be a target of gold for one more time.

xaususdInside route possability. Numeorus ways this can go floor been 3000. However is a scenrios for triangle (unlikely) 38% around 3800 area. We have a triple top on lower tf. Whether leg was impulsive or corrective determines if this move will be quick or more complexed triple 3 etc.

Gold is Targeting #5,100.80 benchmark / Medium-termGold's Short-term: Gold reached my personal maximum (regarding Short-term of course) of almost invalidating #4,400.80 benchmark / both Short and Medium-term Buyers / investors started taking Profits and as Naturally, asset cannot only Trade in one direction, Gold dipped creating aggressive Descending Channel and is now testing the Lower Low’s pressure point. However, #4,000.80 is very strong Support zone for the fractal which won't be invalidated without serious cause and even with Short-term development (due current decline) Investors drawing capital from Gold to more riskier assets - I doubt Gold has more potential to go Lower below my Support zones on the chart regarding Short-term. The current Selling accumulation pattern on Hourly 4 chart is now on total Neutrality but attempting to break towards last week’s Lower Low's. Current Fed loan climate is Gold friendly as Gold often demonstrates resilience during early phases of Fed tightening cycles before investment flows adjust to Higher Rates. If Rates go down more aggressively, Gold will soar more (another reason why I am Bullish on Gold).
#MA50 and #MA200 observation: Keep both lines on your Weekly (#1W) chart, as they are pointers for Long-term. As Long as Gold is Trading above them, Bullish Long-term stance remains and Gold will Target upper levels.
Fundamental commentary: Gold was Trading on #1,800.80 on mid-October #2023 Year, and currently tested #4,400.80 benchmark which records one of the most aggressive rises of Gold in history. It was up almost (# +65.00%) lately / when confidence in financial system is on a decline (which is the case in current and last few Years), Gold is soaring as hedge. U.S. Dollar just had one of its weakest first halves in #50 Years, down more than (# -10.00%) against other major currencies. Massive debt (# 315 trillion globally), rising government spending and tariff regulation and impact on the markets have shaken confidence in the system world-wide. When U.S. Dollar weakens, Investors are in search of asset that feels more stable to store their money / it is always one and almost only option - Gold. In addition, Central banks have been Buying Gold in bulk / over #1,000 tons annually for the past #3-Year fractal, most since #1,967 Year which is not surprise or weird / something is going on. Part of that started with Middle East conflict escalation #2,023 Year, U.S. freezing #300 million Russian reserves in #2,022 Year, showcasing other countries that their Dollars can be shut off as political leverage.
Recapitulation: Segment which makes the almost (# +65.00%) increase on Gold unusual is that both Gold and Stock markets are both hitting record Highs at the same time. Institutions are still sitting on trillions in cash. Many are still not deciding to go "all in" on Stocks at these levels. Also on the contrary, they also don't want to lose to Inflation sitting on the sidelines / so they're parking most of the money in Gold as a temporary middle ground and that demand is helping push Gold Higher from big institutions, and also independent Investors world-wide. Even with all the questions and uncertainty right now, keep this in mind: Gold is used to protect wealth, not grow it. Gold usually spikes when confidence in the financial system drops, but it can dip just as fast once confidence returns. In #1,980 Year, Gold hit a record of #850.80 per ounce then dropped (# -50.00%) by #1,982 Year. After peaking at #1,920.80 in #2,011 Year, it took nearly a decade to recover and if full confidence returns, Gold may fall fast as mention above, however confidence for financial system is far from delivered or happening.
My personal thoughts: All Traders are well aware that I am well known Seller of the market however what made me triple my account, is switching to being a Bull in recent times as Trading against the trend is disastrous for a Trader. I do believe that even if Gold dips, near Lower Low's is maximum as illustrated on my chart and #5,100.80 benchmark is my next point of interest and my next Medium to Long-term Target. #6,100.80 - #6,200.80 represents Ultimate Top's for now and stabilization zone where another aggressive dip is possible, fuel only for Gold to soar further. I do believe Financial system is about to collapse even more and with ever-growing Inflation world-wide, Gold will skyrocket and I am here to Buy it / Trade it even more than ever, expecting my Targets to be met. Remember, trend is your friend and hope all of Sellers which got liquidated accounts, sending me many messages will turn their Technicals and finally start Buying Gold. Yours, goldenBear88

GOLD $4,381 — Cyclical Top or Local Top?Has the price of gold reached its final bullish cycle high at $4,381 during the trading session of Monday, October 20? That session marked the end of an upward inertia phase in precious metals prices, triggering the first retracement since mid-August. However, a retracement does not necessarily mean a final cycle top or the start of a long-term bearish trend.
To confirm that gold has made its annual top this October in the commodities market, several technical and fundamental conditions must be met — and at this stage, they are not.
1) To confirm a major cycle top, a strong resistance level and a clear bearish reversal pattern must be observed
Looking back at gold’s price history, we can refer to the long distribution phase of 2011–2012, which concluded a bullish trend that had begun at the start of the century. This was followed by a four-year bear market, before a new long-term uptrend began in January 2016.
What about the current long-term technical setup? Monthly chart data provide insight into the broader cycle. Gold has been building its fifth bullish wave since the breakout above its former all-time high in March 2024, already exceeding several theoretical price targets based on Fibonacci extensions. The $4,300 region aligns with two major extensions, including the 1.618 “golden ratio” extension of wave 3.
However, that alone is not enough to confirm that the cycle top occurred at $4,381. At this stage, there is no distribution pattern or major support break. A drop below $3,400 would be a strong signal of a completed bullish cycle.
2) Gold’s cyclical top will occur when the US dollar confirms a medium-term bullish reversal
Gold’s cyclical top will coincide with the moment the US Dollar (USD) establishes a sustained bullish reversal. Gold and the dollar usually move in opposite directions: a stronger dollar reduces the appeal of gold for international investors. Once the dollar confirms an upward trend reversal, capital will progressively rotate away from gold — signaling the end of the metal’s bullish phase.
The chart below shows the weekly candlesticks of the US Dollar Index (DXY) against a basket of major currencies, highlighting the bullish reversals seen in 2018 and 2021.
3) Gold’s cyclical top will be reached when outflows dominate in GOLD ETFs
The gold cycle will top out when capital outflows from gold-backed ETFs become dominant. Inflows into these funds usually reflect investor appetite for the metal. When these inflows slow and reverse, it shows a gradual disengagement from gold’s financial demand — which has played a major role in its 2025 price rally.
This shift marks the maturity of the bullish phase. Therefore, the dominance of ETF outflows is an early indicator of an impending gold cycle reversal. For now, according to World Gold Council data, that situation has not yet materialized.
DISCLAIMER:
This content is intended for individuals who are familiar with financial markets and instruments and is for information purposes only. The presented idea (including market commentary, market data and observations) is not a work product of any research department of Swissquote or its affiliates. This material is intended to highlight market action and does not constitute investment, legal or tax advice. If you are a retail investor or lack experience in trading complex financial products, it is advisable to seek professional advice from licensed advisor before making any financial decisions.
This content is not intended to manipulate the market or encourage any specific financial behavior.
Swissquote makes no representation or warranty as to the quality, completeness, accuracy, comprehensiveness or non-infringement of such content. The views expressed are those of the consultant and are provided for educational purposes only. Any information provided relating to a product or market should not be construed as recommending an investment strategy or transaction. Past performance is not a guarantee of future results.
Swissquote and its employees and representatives shall in no event be held liable for any damages or losses arising directly or indirectly from decisions made on the basis of this content.
The use of any third-party brands or trademarks is for information only and does not imply endorsement by Swissquote, or that the trademark owner has authorised Swissquote to promote its products or services.
Swissquote is the marketing brand for the activities of Swissquote Bank Ltd (Switzerland) regulated by FINMA, Swissquote Capital Markets Limited regulated by CySEC (Cyprus), Swissquote Bank Europe SA (Luxembourg) regulated by the CSSF, Swissquote Ltd (UK) regulated by the FCA, Swissquote Financial Services (Malta) Ltd regulated by the Malta Financial Services Authority, Swissquote MEA Ltd. (UAE) regulated by the Dubai Financial Services Authority, Swissquote Pte Ltd (Singapore) regulated by the Monetary Authority of Singapore, Swissquote Asia Limited (Hong Kong) licensed by the Hong Kong Securities and Futures Commission (SFC) and Swissquote South Africa (Pty) Ltd supervised by the FSCA.
Products and services of Swissquote are only intended for those permitted to receive them under local law.
All investments carry a degree of risk. The risk of loss in trading or holding financial instruments can be substantial. The value of financial instruments, including but not limited to stocks, bonds, cryptocurrencies, and other assets, can fluctuate both upwards and downwards. There is a significant risk of financial loss when buying, selling, holding, staking, or investing in these instruments. SQBE makes no recommendations regarding any specific investment, transaction, or the use of any particular investment strategy.
CFDs are complex instruments and come with a high risk of losing money rapidly due to leverage. The vast majority of retail client accounts suffer capital losses when trading in CFDs. You should consider whether you understand how CFDs work and whether you can afford to take the high risk of losing your money.
Digital Assets are unregulated in most countries and consumer protection rules may not apply. As highly volatile speculative investments, Digital Assets are not suitable for investors without a high-risk tolerance. Make sure you understand each Digital Asset before you trade.
Cryptocurrencies are not considered legal tender in some jurisdictions and are subject to regulatory uncertainties.
The use of Internet-based systems can involve high risks, including, but not limited to, fraud, cyber-attacks, network and communication failures, as well as identity theft and phishing attacks related to crypto-assets.

Balances and Imbalances in Gold🔴 Why Point of Control (POC) Acts as Strong Support or Resistance to Create a Balance
In a Volume Profile, the Point of Control (POC) represents the price level where the highest traded volume occurred during a specific period. This level attracts attention because it reflects the fairest price accepted by both buyers and sellers.
➥ In an Uptrend:
When the market is trending higher, previous POCs often act as strong support zones. Traders who missed earlier entries tend to buy when price revisits these high-volume levels, believing them to be fair-value areas within the broader uptrend. Moreover, institutional participants often reload positions near the POC since liquidity is abundant there.
In short, when price revisits a past POC during an uptrend, demand tends to emerge again, creating a bounce from that level.
➥ In a Downtrend:
Conversely, in a downtrend, previous POCs act as strong resistance zones. What was once a fair price for buyers now becomes a fair price for sellers. Market participants who were trapped at higher levels use these zones to exit or add fresh short positions. Thus, when price rallies toward a prior POC, supply often re-enters, leading to rejection or a pullback. In this backdrop, let's discuss Gold chart.
🔴 Gold Chart Analysis in This Context
In the above 1H chart of Gold, the relationship between price and POC is clearly visible.
➥During the earlier part of the chart, Gold is in an uptrend. Each time the price retraced, it found support around the previous session’s POC. These levels acted as liquidity zones, where strong buying interest reappeared, helping the price continue its upward leg. This repetitive structure created a classic “staircase” pattern - each rally was followed by a controlled pullback to the prior POC, confirming the zone as a demand base.
➥However, as momentum shifted, Gold entered a downtrend. In this phase, the same POC logic flipped - price began reacting bearishly around previous POCs. Each time the market attempted to rally, it stalled or reversed near those old value areas, signaling that sellers were defending the former fair-value levels. This behavior turned prior supports into resistance shelves, reinforcing the bearish control.
➥Currently, price seems to be retesting one such POC zone near the $4000 zone. If sellers maintain control, the next leg lower could unfold toward the next lower-volume pocket or untested POC zone. But before that we need some sign of weakness near 4000- shortening of the thrust/lack of buying interest/impulsive selling etc. before pulling the trigger or else 4125 to 4150 might be on the cards.
What do think at this point? Will it pass through the resistance zone or react sharply back to 3900.
Do comment and 🚀

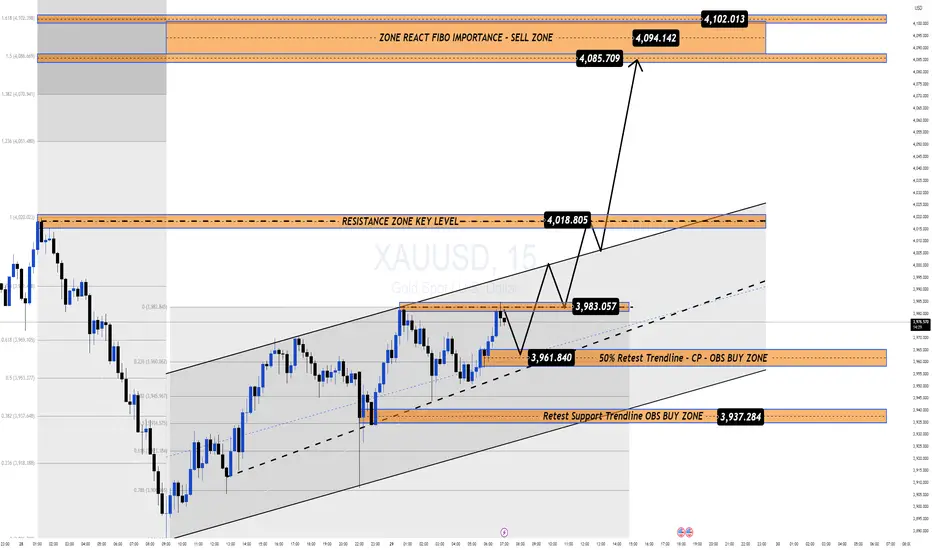
Gold Recovers 1000 Pips Ahead of FOMC: Key Levels in Focus📊 Market Overview
After a sharp selloff that shook long positions, Gold has rebounded nearly 1000 pips, recovering from the 388x area toward 398x ahead of the upcoming FOMC meeting.
Despite the short-term recovery, Gold remains down around 3.5% this week, reflecting cautious sentiment as traders reposition before the Fed decision and amid fading U.S.–China trade tensions.
Currently, price is trading near $3,980–3,990 during the Asian session, consolidating under the psychological $4,000 zone.
💎 Technical Outlook (H1–M15)
Gold continues to trade within a short-term ascending channel, forming a corrective recovery inside a broader downtrend.
Immediate Support Zones:
• 3,961 – 3,937 → Trendline retest & OBS Buy Zone
• 3,918 → Structural invalidation area
Resistance & Key Reaction Levels:
• 4,018 – 4,085 → Mid-term key resistance
• 4,094 – 4,102 → Major Sell Zone (Fibo 1.5–1.618 confluence)
📍If Gold breaks and holds above 4,018, momentum could extend toward 4,085 – 4,102, where strong selling pressure may reappear.
📍If the price rejects at 4,094 – 4,102, expect a corrective move back toward 3,961 – 3,937, aligning with the channel base and trendline retest.
🌍 Macro Context – FOMC Ahead
Markets expect the Fed to cut rates by another 25bps, following September’s “risk management” cut.
However, if Powell’s tone turns hawkish, Gold could face renewed downside pressure as rate-cut expectations fade, particularly for December.
Conversely, a cautious or dovish tone emphasizing inflation risks and slower growth could boost Gold above $4,100 in the short term.
Meanwhile, easing trade tensions between the U.S. and China and the ongoing equity rally may continue to limit safe-haven demand.
🧭 Summary
Gold is holding a short-term recovery bias, yet the medium-term trend remains fragile ahead of the FOMC.
Expect volatility around the 4,000–4,100 zone, with the Fed statement likely to set the next major direction.
🛡️ Stay patient — liquidity builds before clarity, and key reactions around $4,094–4,102 will reveal the next macro impulse.
GOLD DAILY CHART ROUTE MAP UPDATEHey everyone,
Check out our updated Daily Chart Route Map, now featuring updated levels for tracking Golds movement.
We’ve refined our proprietary Goldturn Channel, our unique method for constructing ascending channels. Price action recently broke out above the channel, with a body close above 4325, leaving a long-term gap open near 4444.
Currently, we’re observing rejection at 4325, and our channel top is now acting as support. The market is range-bound between 4325 (resistance) and 4183 (channel top as support). A decisive break above or below either of these levels will help define the next directional move, keeping in mind the open gap overhead at 4444.
On the downside, 3961 remains the pivotal swing zone, aligning with the channel midline, should we see a confirmed break below 4183.
As always, we will keep you all updated with regular updates throughout the week and how we manage the active ideas and setups. Thank you all for your likes, comments and follows, we really appreciate it!
Mr Gold
GoldViewFX

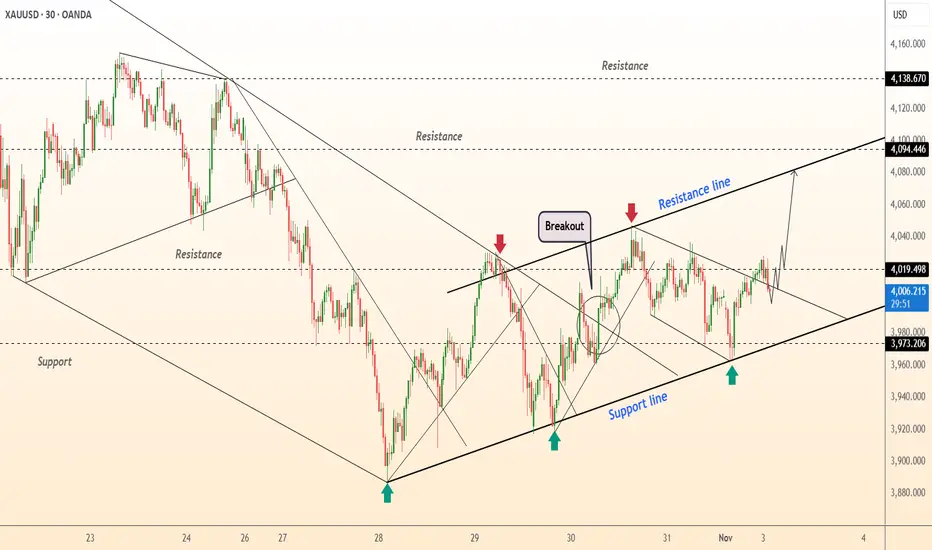
DeGRAM | GOLD is testing a resistance level📊 Technical Analysis
● XAU/USD has confirmed a breakout from the descending resistance line and continues to form higher lows along the rising support line, indicating growing bullish momentum.
● The pair targets the next resistance at 4,094–4,138, with immediate support seen at 3,973, maintaining a short-term upward structure inside a rising channel.
💡 Fundamental Analysis
● Gold gains traction as investors price in a pause in Fed tightening and geopolitical risk supports safe-haven demand.
✨ Summary
● Long bias above 3,973; targets 4,094–4,138. Breakout structure and macro sentiment favor bullish continuation.
-------------------
Share your opinion in the comments and support the idea with a like. Thanks for your support!
Gold's downward trend shows no signs of stopping sell on ralliesGold prices priced in the Fed's rate cut expectations yesterday, and quickly retreated after the data release. The bullish momentum was short-lived. After gold prices broke through $4000, almost everyone in the market believed a rebound was imminent. However, I maintain my view: yesterday's rebound was merely a corrective bounce after a sharp decline, just a sign of market recovery. The market is only rebounding, not reversing. Our short positions bought at 4020 have yielded substantial profits; you can refer to my post yesterday to verify its accuracy. The overall trend for gold remains bearish and volatile. Today, during the Asian session, we recommend selling on any rebounds.
The 1-hour moving averages for gold continue their downward crossover and bearish alignment, and the price has now fallen back below the moving averages, indicating that the bears are still slightly stronger. After the Fed data release, the price quickly retreated after reaching 4007, and the resistance at the 4000 level suggests that selling on rallies is the best strategy. The bulls failed to hold above 4000, and the bears have the upper hand.
Market conditions are constantly changing. Now that the bullish expectations have been priced in, gold has returned to a weak trend, and there is still room for further decline. The gold correction will continue.
Today's trading strategy: Short gold at 3985-3995, with a target of 3930-3920.

Gold Holds Firm Ahead of FOMC DecisionGold has shown a clear break of structure (BOS) on the 1H timeframe, confirming a shift from a previous downtrend into a bullish continuation phase. After rebounding from the support area, the price is holding above both moving averages, signaling strong buying interest. A short-term consolidation phase could lead to another upside move toward the next resistance zone as long as support holds.
Key Levels:
Buy Entry: 4000
Take Profit: 4070
Stop Loss: 3960
Reasoning:
Technically, price action confirms a trend reversal with multiple bullish structure breaks (BOS 1H & 2H) and consistent higher lows. Buyers continue to defend the support area, keeping momentum aligned with the broader bullish bias.
Fundamentally, softening U.S. dollar sentiment and stable Treasury yields support gold’s recovery, as traders look for safety ahead of key U.S. economic data and the upcoming FOMC communication.
Disclaimer:
This analysis is for educational purposes only and does not constitute financial advice.

#XAUUSD: +6000 Pips Swing Move In Making, Patience Pays!
Gold prices have fallen sharply as the DXY has regained strength. Following the recent significant sell-off, we can anticipate the potential direction of the price. Three key targets can be considered if the price moves in our favour. The first is a nearby target at $4000 which would represent a gain of 1100 pips. Subsequent targets should be determined according to your trading plan.
There are two potential entry points; if the first is invalidated the second should be considered.
We wish you the best of luck and trade safely.
Team Setupsfx 🚀❤️

XAUUSD.... SHORTThe market ticks all my entry strategy on the daily and the 4hrs... but I'm waiting for 30mins to close below my counter trendline for an entry.
Recently USD is getting stronger 💪. Lets see what the market does ✌

XAUUSD UPDATEhi everyone
For this upward movement, the first resistance is at the 3494 level. A breakout at this level would also coincide with a breakout of the trendline. If both the trendline and resistance are broken, the price is likely to move toward the next resistance at 4984. The target price could reach the 61.8% Fibonacci retracement level.
I’m also interested in entering a long position around the 3862 area. However, if the support at 3884 breaks, I will reconsider the setup
good luck all
**My trading strategy is not intended to be a signal. It's a process of learning about market structure and sharpening my trading my skills also for my trade journal**
Thanks a lot for your support

XAUUSD: A Potential Reversal on the HorizonOANDA:XAUUSD The price has been on a steady decline, but there's a shift happening. Sellers have tried to push the price even lower twice, but both attempts were met with strong rejection at nearly the same price level. This is forming a Double Bottom, a classic signal that the downward momentum is losing power.
Now, all focus is on the neckline. A decisive breakout and a close above this level will not only confirm the pattern but could also spark a significant rally toward the 4,135 target.
If this happens, we could be looking at the beginning of a powerful trend reversal. The market is gearing up for a move, and this is where it gets exciting.

GOLD XAUUSD GOLD XAUUSD ,GOLD ,AS earlier predicted on retest to 4030 zone, price is reacting but 4hr close shows a technical break of structure and if we take correction i will be watching 4000-4006 demand floor which is a descent 270pips drop from the close of the newyork high.
the next demand floor should 4000-4006 fails will be 3956-3954 zone ,a strong 1hr cross and a break and retest descending trendline .
if 4000-4006 holds and we break freely away from 4030 ,then we will target 4100 zone you can stop at 4068 another 300pips break of 4030 resistance zone and watch for correction .
am confident that 4100 is possible tomorrow.
technical failure of both zone will retest 3885-3889 current low which i think wont happen based on the current FEDERAL FUND RATE 3.75%-4.0%.
#GOLD #XAUUSD

BUY SETUP – Smart Money Style (GOLD / USD – 30m)Analysis:
Price has formed a clean bullish structure after rejecting the demand zone (gray area). Multiple rejections confirm strong buyer presence around $3975–$3988, indicating liquidity absorption below the previous low.
Trade Plan:
Entry: Within the reaccumulation zone near $4026
Stop Loss: Below the demand base at $3975
Take Profit: Toward the upper liquidity and supply zone at $4097
Risk/Reward: ~1:3
Concept:
This setup aligns with Smart Money and FU (Failed Breakout) principles — price swept liquidity below the prior structure, tapped into unmitigated demand, and is now targeting the next high. A clean break and hold above $4053 would confirm momentum continuation to the upside.

Gold M15 LowsI expect one of those lows if not all of them to be taken out before we start to see some bullish momentum.
