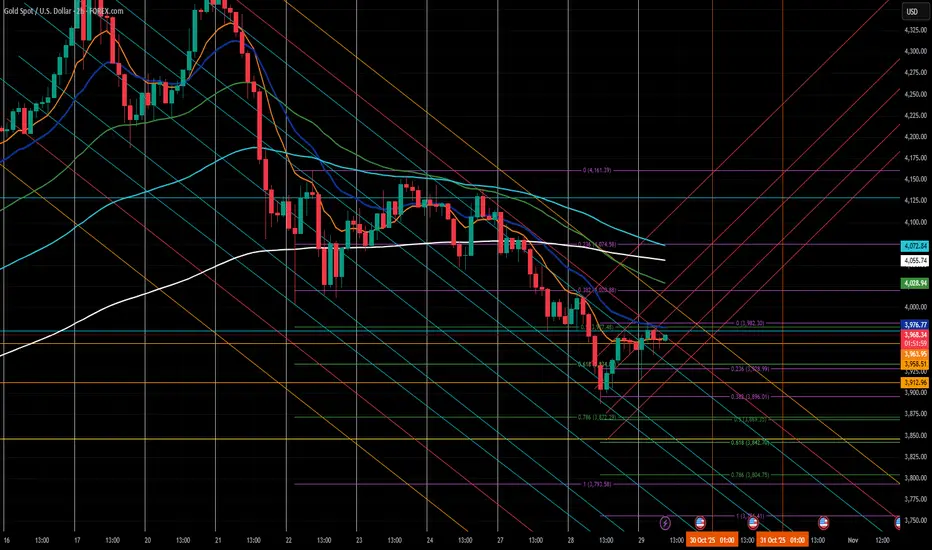
Channel Resistance Holding - Short OpportunityHello Followers, I am going to share you my opinion on gold next move..
Gold is working in a parallel channel couple of days, gold has formed a proper channel, it is respecting lower lows and lowers highs. gold Current Price is 3975.. It is possible that now gold fly high till the resistance area 4020/4045. And then it will form an other an otherwise around the target area 3850. If gold break the resistance then we have an stoploss around4090..
KEYPOINTS:
Current Price 3975
Target Area 3850
Resistance area 4020/4045
Stop Loss Point 4090
Trade ideas


XAUUSD 4H Analysis (29th October 2025) ASIAN/LONDON
BUY/SELL SCENARIOS:
BUYS:
Body Candle Close above the 4019.80 level.
2) Retest the failed 4h Bearish OB at the 4019.80 level.
3) Create a 5/15m Bullish Engulfing Candle to capitalise on BUYS towards the 4161.40 level.
SELLS:
1) Retest the 4h Bearish OB at the 3973.28 level.
2) Create a 5/15m Bearish CHOCH with a body candle close (with a FVG)
3) Retest the 3/5m Bearish CHOCH Level to capitalize on SELLS towards the 3838.00 level.
Trade smart, Trade safe, Trade according to your trading plan always. Cheers

GOLD at breakout level? What's next ??#GOLD.. market just reached at his current breakout area that is around 3945 .
If market sustain below than we can expect further drop...
Good luck
Trade wisely

XAUUSD 15-Minute Chart Minor-Grade Short Entry Strategy XAUUSD 15-Minute Chart Minor-Grade Short Entry Strategy
Entry level around 4018 USD, stop-loss placed at 4053 USD.
1st target around 3940 USD: partial close (50% position), trail stop.
2nd target around 3870 USD: further partial close (50% of remaining), trail stop.
3rd target around 3800 USD: additional partial close (50% of remaining), trail stop.
Let the residual position run with progressive partial closures and stop trailing.

What is the purpose of this back-and-forth market manipulation?#XAUUSD OANDA:XAUUSD TVC:GOLD
Gold prices have broken through short-term resistance due to news, and the hourly and 4-hour charts show prices above the middle Bollinger Bands. Therefore, we need to adjust our strategies accordingly. However, the market is currently fluctuating rapidly, and entering the market rashly in the short term still carries significant risks. Therefore, the wise choice is to wait and see, and enter the market only after the market stabilizes. In the short term, the upside resistance level to watch remains at 4030. If gold breaks through this level strongly during the US session, the price may test 4050. The initial support level to watch is 3980-3960. If the price retraces but does not break through this level, consider taking small long positions in gold in batches, with a target of 4010-4030. Temporary adversity is the best test for traders; setbacks only make us stronger. Success belongs to the confident, opportunity belongs to the pioneers, and miracles belong to the persistent! 💪💪💪

Gold price trading below 4000⭐️GOLDEN INFORMATION:
Gold (XAU/USD) steadies near $3,950 per ounce in Asian trading on Thursday, snapping a four-day losing streak. Prices find support from ongoing central bank buying and renewed ETF inflows, which have tightened supply in both official and market channels. However, gains remain capped after Fed Chair Jerome Powell signaled that another rate cut in December is uncertain, pushing 10-year Treasury yields above 4% and raising the opportunity cost of holding non-yielding bullion. The Fed had earlier delivered a widely expected 25-basis-point rate cut.
⭐️Personal comments NOVA:
Gold price is moving sideways, accumulating below 4000. Gold's long-term correction downtrend
⭐️SET UP GOLD PRICE:
🔥SELL GOLD zone: 4030 - 4032 SL 4037
TP1: $4020
TP2: $4010
TP3: $4000
🔥BUY GOLD zone: 3886 - 3884 SL 3879
TP1: $3900
TP2: $3910
TP3: $3925
⭐️Technical analysis:
Based on technical indicators EMA 34, EMA89 and support resistance areas to set up a reasonable sell order.
⭐️NOTE:
Note: Nova wishes traders to manage their capital well
- take the number of lots that match your capital
- Takeprofit equal to 4-6% of capital account
- Stoplose equal to 2-3% of capital account

Going Short On Gold (XAUUSD)XAUUSD – Short Setup 🔴🔴🔴🔴🔴🔴
Price has broken out of the descending trendline, tapping liquidity above recent highs before retesting a former support turned resistance zone in the 5 mins Tf. This aligns with the broader bearish structure. The trendline acts as liquidity, and the rejection from resistance confirms potential downside continuation toward the 3,800 area.

Xauusd Focus ShortOn the XAU/USD chart, the hourly timeframe is currently in a downtrend, while the daily timeframe remains in an uptrend.
Therefore, the decline seen on the hourly chart represents a pullback within the broader daily uptrend.
Once this pullback completes, the daily trend is expected to push toward a new all-time high (ATH) before entering a longer-term correction phase.
Given this context, the current pullback could extend for several thousand points, so the focus should remain on short positions (sell setups) during this retracement phase.

Elliott Wave Analysis – XAUUSD (October 29, 2025)
Momentum
• D1: Momentum remains compressed, but yesterday’s candle closed with a long lower wick — a clear sign of weakening downside pressure. A bullish daily close today would confirm a potential D1 reversal.
• H4: Momentum is preparing to turn down from the overbought zone, yet the current upward move is still weak. We need to monitor whether price can hold above the previous low once H4 momentum drops toward oversold.
• H1: Momentum is falling, but price is supported around 3953 and capped near 3994.
As long as price holds above 3927 and avoids breaking 3892, the next H4 oversold phase could confirm a stronger upside structure.
________________________________________
Wave Structure
• D1: The current decline equals 0.382 retracement of wave (3) yellow, a key Fibonacci level.
• H4: Wave (4) purple has already retraced 0.782 of wave (3) — unusually deep for a normal 4th wave (which typically stops around 0.382–0.5).
This suggests the ongoing correction may represent wave (4) yellow on the D1 timeframe.
If true, the market could now be forming wave W of a larger W–X–Y structure, meaning the upcoming recovery might only be a slow, overlapping X wave before another decline.
• H1: The 5-wave black structure seems completed.
A break above 3995, followed by a test of 4050, would confirm the end of wave (5) black and the start of a corrective move upward.
________________________________________
Summary
Price volatility is still high — avoid limit orders for now and watch how price reacts at key zones.
• 🔹 Support: 3953 – 3927 – 3892
• 🔹 Resistance: 3994 – 4050

GOLD LONG SETUP Gold has been dumping everyday last week, but decent support has been met on 3.8 level. Price will start to regain losses climbing back to 4.3 Level before we can see serious bears.

How to trade gold stably as the weekly and monthly charts close?#XAUUSD TVC:GOLD OANDA:XAUUSD
As we expected, gold broke through the previous strong resistance at 4030 and continued its bullish trend, reaching a high of 4046, very close to our target of 4050. Although the price of gold retreated somewhat after the brief surge, from the daily chart, the short-term price of gold is still above the MA5 moving average, while from the 4-hour chart, the middle band coincides with the MA20. Therefore, I don't think this means the bulls have given up; on the contrary, it's more like a way to better accumulate momentum at the bottom. This strategy remains effective, and we can still consider going long on gold when the price retraces to the 3985-3975 range.

Correction over - new Annual High's in sightTechnical analysis: The Price-action hit the Daily chart’s Support belt and got rejected as expected near #3,888.80 - #3,892.80 and is currently pulling back on full-bodied Daily chart's candle. In my personal belief, decline was only be temporary as it was delivered in previous Bull runs however caution is required as the Weekly catalysts are still about to be reported (Fed or not, I continue Buying preserving my Bullish stance). Technically the newly formed Ascending Channel on Hourly 1 chart still has a Lower High’s to give around #4,027.80 mark before I re-evaluate the trend and continue soaring regarding the Short-term. As I mentioned throughout my remarks, Gold is Neutral now, turning Bullish as long as Gold closes the week above the #3,888.80 configuration which is far away currently. Selling sequence is limited or near exhaustion, however Gold not only succeeded in breaking the Resistance (#3,952.80 mark) with ease and almost tested second Resistance belt, but was also comfortably Trading above it. Needless to mention on the other side, Ascending Channel is intact due to the sharp Intra-day recovery on DX and uncertainty on all market classes. This outweighs the decline on Bond Yields market.
My position: I am Buying Gold aggressively throughout yesterday's session all along especially when #3,952.80 benchmark got invalidated to the upside. Gap to the downside on Asian market opening delivered excellent chances to Buy more as I closed all orders with #4,000.80 Take Profit. Keep in mind that I might Sell #4,024.80 now (aggressive Scalp to the downside) only to Buy more. #4,052.80 benchmark and #4,100.80 extension are my Targets.

Gold 29-31 Oct 25 reject at OB or BOS at $4004-$4020Gold can be reject at order block (OB) price $4004-$4020, if price Break of structure (BOS) above $4020 will up more to $4130, Key zone to watch at ($4004-$4020).
4H closed not break above $4020, confirmed to sell, but if 4H closed price above $020, recommend to buy target $4130

It’s Not Just a Chart, It’s a Mind Game — Stay Calm, GoldRiders.First of all — congratulations to everyone who followed yesterday’s setups!
We sold in the morning and made profits, then bought during the U.S. session — and won again.
Even though the technical analysis was pointing opposite to the news direction, price movement proved once more that the chart often leads before headlines.
Some followers were confused when I mentioned the news was positive for the dollar — which normally means gold should fall — yet buyers secured safe profits above 3938. That was a wise move reflecting good risk control.
Despite the positive Richmond Manufacturing Index and Consumer Confidence data (both supportive for USD), gold respected the technical levels more than fundamentals.
This is normal, as low to medium-impact data rarely outweigh technical setups, unlike major events such as interest rate decisions, which can override technical signals completely.
From the chart:
After dropping from 4019 early yesterday to 3886 around noon, gold reversed and started forming a higher high.
Currently, any dip below 3945 signals minor weakness, below 3928 indicates stronger bearish pressure,
and a confirmed breakdown happens only under 3898–3883.
On the upside, strong resistance persists between 3970–3983, tested since last evening.
A breakout above it could open the way to 4017–4020.
Important Warning:
Today is high-risk.
Expect volatility not only during the FOMC rate decision at 9:00 PM and Jerome Powell’s speech at 9:30 PM,
but possibly much earlier — the “volatility show” can start anytime.
So please trade cautiously.
If you’re new, still learning, or your emotions or account size can’t handle sharp swings —
sit out today and observe.
For learners, use a demo account as if it’s real — that’s one of the best lessons you’ll ever get.
Also note: Meta, Microsoft, and Alphabet (Google) will release earnings today — adding even more volatility.
Bullish Scenario (Buy)
Entry: Safe entry above 3983 (aggressive from 3967)
Targets: (3972–3976) – 3982 – 3994 – 4000 – (4007–4012) – 4021 – 4031 – 4046 – 4055 – 4064 – (4072–4077) – 4084 – 4097 – 4103 – 4117
Don’t feel safe with any buy before breaking 3983. The next key resistance is 4020.
Bearish Scenario (Sell)
Entry: Safe entry below 3928 (aggressive from 3938)
Targets: (3932–3930) – 3922 – 3913 – 3906 – 3901 – 3895 – 3887 – 3873 – (3860–3856) – 3842 – 3821 – 3813 – (3804–3800) – 3793
Notes:
1- This page doesn’t engage with sarcastic or disrespectful comments — if you don’t like the post, just scroll.
Professional discussions are always welcome.
2- If you found this analysis useful, share it — your support makes a real difference!
✍️ We appreciate it, if you drop a comment if you received the analysis clearly.
Disclaimer:
This analysis reflects my personal opinion and market observation only.
It is not investment advice or a buy/sell recommendation.
Trading in financial markets involves high risk, and all decisions remain the trader’s responsibility.
GoldXAUUSD
- Bearish Channel as an corrective pattern in Short Time Frame
- Break of Structure
- Completed " 12345 " Impulsive Waves
- Order Block
- Change of Characteristics

Gold. Possible find temporary support. 28/Oct/25Xauusd possible at its temporary support zone at 3900 +/- while waiting for FED and Japan rate decisions meeting 30 Oct.

Gold price analysis November 3🟡 XAUUSD – Recovery Signal Forming
Gold prices are showing signs of returning to an uptrend after a short-term correction. The 4026 area is now acting as an important key level – a stable price above this area would be a confirmation signal that buying pressure is returning to the market.
With recent economic data still supporting the gold uptrend, the current priority strategy is to wait for BUYs following the trend. The sellers can only regain control if the price breaks through the support trendline around 3970, then the downtrend can be re-established.
📈 Sample trading plan:
Buy early around: 4000
Buy intensified when the price breaks above: 4026
Expected target: 4150
Risk: The uptrend is negated when the price closes below the 3970 trendline


GOLD | Daily Analysis #2 - 30 October 2025Hello and welcome back to DP,
Review and news:
Yesterday Gold pulled back slightly from recent highs after strong run-up. According to FXTrendo, it had briefly topped the psychological US$4,000/oz level, then traded around ~US$3,995. Expectations that the Federal Reserve might cut interest rates later this year remain a tailwind, which helps non-yielding assets like gold. Geopolitical uncertainties and safe-haven demand continue to underpin gold’s appeal. In summery gold remains structurally bullish, but near-term momentum is under pressure. The market is in a consolidation/correction phase while waiting for the next catalyst (Fed clarity, inflation prints, major geopolitical event).
1H – 4H Technical Analysis:
As you can observe, the major downtrend broke, the upside moving is feuled up. Demand zones are strong and 3914 zone is still irony. So if price pass and break 4024 area, there is potential to uptrend goes continuously. With analyzing the support and resistance zones, these scenarios are possible: Bearish scenario: If gold fails to reclaim the resistance zone (~4,000 +), and breaks below short-term support (~3,940), then a deeper retracement toward ~3,900 or lower becomes more likely. Bullish scenario: If gold holds above ~3,940-3,900 and the Fed or external shock triggers safe-haven flows, a move back toward ~4,050-4,100 is possible. Neutral to caution: Given the mixed signals (strong overall trend but short-term pullback), many traders may prefer to wait for confirmation (e.g., breakout above resistance or a clean bounce off support) rather than aggressively chase.
Disclaimer:
This content is for informational purposes only and does not constitute financial or investment advice. © DIBAPRISM
Amir D.Kohn

When the Dollar bleeds, Gold breathes stronger.A clear structural divergence is unfolding between XAUUSD and DXY —
Gold has printed a clean bullish market structure, while the Dollar Index mirrors it with a progressive bearish flow.
This inverse rhythm isn’t coincidence — it’s the pulse of global liquidity.
As capital rotates out of USD strength into hard assets, we’re witnessing how smart money hedges exposure against monetary uncertainty.
Each push in Gold aligns perfectly with weakness in DXY —
a synchronized dance that often precedes macro repricing in risk assets.
💭 The key insight?
Gold’s rise isn’t simply technical — it’s the market’s vote of confidence against the Dollar’s future yield.
📊 MMFLOW TRADING Insight:
“Liquidity never lies — when one side inflates, the other exhales.”

Gold price analysis on October 30Fundamental Analysis
Gold prices remained confined within a familiar range, despite the volatility caused by the US Federal Reserve's key monetary policy decision on Wednesday.
Powell noted that policymakers may be more cautious if this prevents them from releasing further reports on jobs and inflation.
Markets are now pricing in a 67.8% chance of the Fed keeping rates unchanged at its December 10 meeting, compared with a 9.1% chance before the Fed's announcement.
President Trump said he hoped to reduce US tariffs on Chinese goods in exchange for Beijing's commitment to curbing fentanyl precursor exports.
Technical Analysis
Gold gained ground in Asia and is eyeing a return to the 4000 handle, which could happen early today as more supportive news comes in. The weekly peak around 4025 will act as a stop for the price increase and act as a correction to find more buying momentum towards 4100. The BUY zone around 4025 is still good, buying power is still accumulating around here. If the trendline around 4025 is broken, Gold will fall deeply to 3865.
Trading signals
BUY GOLD 3925-3923 SL 3920
SELL GOLD 4025-4027 SL 4030
SELL GOLD 4095-4097 SL 4100

XAU/USD – Bearish Continuation Outlook (Smart Money Framework)XAU/USD – Bearish Continuation Outlook (Smart Money Framework)
🧭 Market Structure Overview
The major structure is bearish — confirmed by a Market Structure Break (MSB) after the last swing high.
Every bullish move since then is viewed as a retracement into premium price for better short entries.
Smart Money likely accumulating shorts above internal liquidity levels before driving price lower.
🟩 Premium Supply Zones (Sell Areas)
1️⃣ Be-BB (Bearish Breaker Block) → 4,180 – 4,240
💣 Main shorting area
Price expected to tap this level to mitigate sell-side imbalance.
Watch for liquidity grab above 4,060 before reversal.
Confirmation: bearish engulfing or BOS on lower timeframes (LTF).
2️⃣ Be-OB (Bearish Order Block) → 4,260 – 4,320
🚫 Last line of defense for bears
If price reaches here, expect a strong rejection due to trapped buyers and institutional orders.
Perfect “last tap” zone before deep markdown.
🟥 Discount Demand Zones (Targets)
🔻 Primary Demand Zone Area → 3,820 – 3,870
Previous accumulation zone (high-volume node).
Take-profit target for swing shorts.
Potential re-entry area for Smart Money to reload buys later.
🎯 Expected final destination if bearish pressure sustains.
📉 Bearish Scenarios
⚔️ Scenario 1 – Textbook Smart Money Setup
Price retraces to 4,060–4,180 zone (Be-BB).
Liquidity grab above 4,060 (previous high).
Bearish rejection → BOS → Sell continuation.
Targets: 3,939 → 3,870 → 3,820.
💥 Most probable scenario.
⚔️ Scenario 2 – Deep Retracement Then Dump
Bulls push higher into 4,260 (Be-OB).
Liquidity sweep and institutional fill.
Massive rejection → sell-off continuation.
🔥 Deeper pullback = bigger sell move later.
