XAUOkay!!! Big charge ups as of late. Took an unnecessary BE from the breach of 54!!!
Next…..
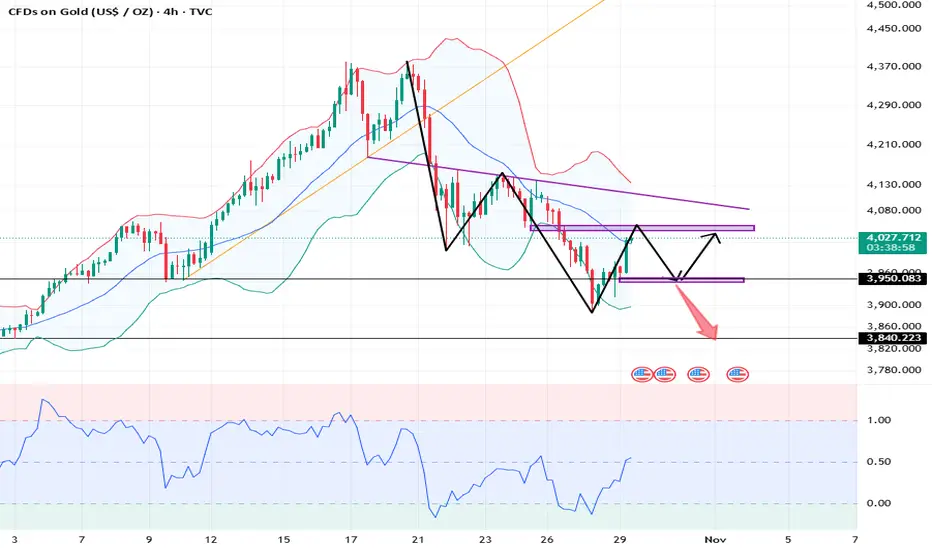
Super Handle Interactions.
$3983!!!!!
The low is either printed OR we sweep with a drip into $3941 before reclaiming $3983!!!
Either way this is not staying down here by Thursday and if we get the flip, we can hold with confidence into NOV 3rd 📍
Safest bet. Let $4025 get the closures and she’ll be on her way.
Currently layering in, second drops are for $3941.
Let’s see how we go!!! 🫶🏽💵
Trade ideas

Gold Technical Update | Correction Expected Below 4100New Gold Analysis (4H & Daily Timeframes):
After gold reached the previous technical target at 4300 🎯 we now expect a potential correction toward 3850 and 3750 as long as price remains below 4100.
Check the chart !

Short on GoldShort on gold. Price has reaced an area of interest in the 4H chart where price has been used as resistance 3 previous times. Price has also tested the 50 EMA and failed to break above it (confluence) Sell gold now for possibly drop back to the support zone around 3,965. If you enter now stop loss above last high of the resitance level around 4,054.1

XAUUSD Ideathis pair has formed a valid ascending channel and a valid ascending trendline
in my opinion this would be the move of the gold
but first gold need to break the red trendline with a candle that close under the touch of the trendline
dont forget today there is very affective news about the interest rate
so be careful with your risk management
Follow for more ideas

retracement ? With the reduction of international tensions and geopolitical risks in the last days of 2025 and of course the end of the fiscal year of international banks and financial institutions, as well as large companies in international stock markets, I think we can expect a two- or three-month break and price correction in the global gold price. The specified range can be re-tested by the average price.
regards

XAU/USD – Gold Accumulates Before Breakout, Target 4,096 USD🔍 Market Context
Gold is trading within a symmetrical triangle pattern , reflecting short-term accumulation before forming a new breakout wave.
After a sharp decline from the peak of 4,096 USD, the market has shown two instances of Change of Character (ChoCH) – an early sign indicating the return of buying pressure.
As long as the price holds above the 3,959 – 3,917 USD range, the short-term bullish structure remains intact. This support zone serves as a crucial “discount zone” in the current accumulation cycle.
💎 Key Technical Zones
• Support Zone 1: 3,959 USD → main structure holding area, coinciding with the lower trendline.
• Support Zone 2: 3,917 USD → final liquidity reaction zone.
• Resistance Zone: 4,040 USD → potential break & retest area.
• Liquidity Zone: 4,096 USD → expansion target if the peak is broken.
🎯 Trading Scenarios
1️⃣ BUY Setup – Favoring the bullish structure
• Entry: 3,959 – 3,917 USD
• Stop Loss: 3,905 USD
• Take Profit:
– TP1: 3,985
– TP2: 4,040
– TP3: 4,072
– TP4: 4,096
✳️ “Buy the discount” – prioritize buying orders at the confluence support zone of trendline + FVG to follow the SMC flow.
2️⃣ SELL Scalp – Secondary strategy when price reacts at the peak
• Entry: 4,096 USD
• Stop Loss: 4,108 USD
• Take Profit:
– TP1: 4,072
– TP2: 4,040
– TP3: 3,985
✳️ “Sell the premium” – only activate if there is a strong price rejection signal at the liquidity peak.
💬 Conclusion
The short-term trend of gold remains bullish as the price stays above the trendline and continuously forms higher lows.
The main strategy is buy the dip – sell reaction around the 3,959 → 4,096 USD range.
The confirmation point for a strong bullish trend will be when the price closes steadily above 4,040 USD .
“Smart money accumulates in silence before the market makes noise.”
⏰ Timeframe: 1H
📅 Update: 03/11/2025
✍️ Analysis by: Captain Vincent

Bearish GoldM-Pattern formed at the top
Ascending channel formed
Bearish flag pattern formed
All technical analysis suggexts a bearish momentum waiting, gold will soon melt downwards

XAUUSD: Market Analysis and Strategy for October 29Gold Technical Analysis:
Daily chart resistance: 4090, support: 3840.
4-hour chart resistance: 4050, support: 3950.
1-hour chart resistance: 4050, support: 3980.
Today, the European session saw an accelerated rebound, breaking through $4000. The focus is on whether it can hold. If the price can stabilize above $4000 after the Fed's rate cut and Powell's speech, it will inevitably attract previous buying interest, solidifying the long-term upward trend. Conversely, if the price falls below $4000, it can be basically determined that a short-term top has formed. At that time, greater selling pressure will continue to amplify the decline until market risk sentiment shifts.
Based on the 1-hour chart, the price faces resistance around 4050, and the battle around the 4000 level remains crucial. Support is seen around 3980.
Trading Plan:
SELL: 4050 near
BUY: 3980 near
BUY: 3955 near
If you choose to trade, please avoid times when news releases occur.
Bullish GoldBased on the analysis of supply and demand points and fundamental conditions, it seems that gold will be in demand next week and will grow by about 10%.
This analysis is valid as long as the global price of an ounce does not fall below $3,970.

GOLD XAU/USD 1H Techenical outlook double bottom 📉 GOLD (XAU/USD) 1H Technical Outlook ✨
⚙️ Pattern Update:
Price forming a Double Bottom 🟢 & showing signs of a Descending Channel Breakout 💥
📊 Buying Zone (Support Levels):
🟩 3950
🟩 3920
🟩 3896
👉 Wait for a bullish confirmation candle before entering long positions! 🔥
🎯 Resistance / Target Levels:
🎯 4014
🎯 4044
🎯 4075
💡 Strategy:
✅ Wait for confirmation 📈
✅ Follow strict Risk Management ⚖️
✅ Trade with patience & discipline 💪
📢 Like 👍 | Comment 💬 | Follow 🔔 | Share 🔄
Let’s trade smart — not emotional! 🧠💰

GoldXAUUSD
- Order Block
- Strong Bearish Trend Line
- Fibonacci Level - 38.20% - 50.00%
- Fair Value Gap
- Completed " 123 " Impulsive Waves

Today's gold trading strategyLow-buying and long-positioning during the oscillation recovery, seizing the technical rebound window
The core driving force for the bulls: oversold recovery + expected support.
The rebound demand after technical oversold: The RSI indicator on the hourly chart has risen from 23 after the sharp decline to 42, but the 4-hour chart is still not out of the oversold range (<30). There is a short-term technical recovery momentum. The gold price has been supported twice at the 4000-dollar integer level, forming a "double-bottom" pattern, and the fluctuation range in the past three trading days has gradually narrowed, indicating that after the oscillation, there is a high probability of breaking through the upper limit of the range.
The bottom support of the expectation of Fed easing: The probability of a 12-month interest rate cut is still maintained at 89% in the market, and it has not completely reversed due to the easing of the geopolitical situation. The policy of the tapering of balance sheet will officially end on December 1st, and the implementation of this certain easing event provides "safety margin" for short-term funds, avoiding another deep correction of the gold price.
Structural support of the oscillation range: The 4000-4050 dollar range has become the core area of short-term buying and selling. The 4000-dollar level is both an integer boundary and the lower boundary of the previous oscillation platform, and it has been tested multiple times without effectively breaking through, indicating that there is a concentrated buying demand at this position; the 4050-dollar level is the recent rebound high point, and after the breakthrough, it will open up the short-term upward space.
Today's gold trading strategy
buy:4005-4015
tp:4035-4045
sl:3995

Gold Technical Outlook: From Reaction Zone to RallyStructure and Trendline Break
Gold on the H1 timeframe shows a clear breakout from the descending trendline, signaling a structural shift from bearish to potential bullish continuation. The breakout is supported by the formation of a higher low, suggesting growing buying pressure.
ABC Pattern and Key Retracement Zone
After the first bullish impulse from 3887 to 4045, price is now in a corrective phase (wave B), pulling back into the Fibonacci retracement zone:
0.618 (3993) to 0.786 (3978) marks the PRIMARY REACTION ZONE, where buyers are likely to step back in.
A strong bullish reaction from this zone would confirm the start of wave C.
Fibonacci Extension Targets
If the bullish continuation (wave C) unfolds as projected:
1.618 extension at 4117 → short-term bullish target.
2.618 extension at 4259 → main bullish projection, mirroring the prior impulsive move.
As long as price holds above the 3950–3980 support range, the bullish structure remains intact.
Trading Bias & Summary
Bias: Bullish (while above 3980)
Ideal Entry: Buy limit around 3980–3995 (Primary Reaction Zone)
Invalidation: Break below 3950 (signals potential deeper correction)
Targets: 4117 and 4259

Last Update for today!Potential move for Asian Session.
Expecting potential drop again!
#1 - If price break the seller zone, we could expect a further push toward the 4020 levels before then dropping.
#2 - Price can drop immediately at market open and go back to the 4845 zone.
#3 - Price can push up, break the 4020 level and start the uptrend. Turning the market bullish again!
Let’s see how it goes!

XAU/USD 28 October 2025 Intraday AnalysisH4 Analysis:
-> Swing: Bullish.
-> Internal: Bullish.
Analysis and bias remains the same as analysis dated 20 October 2025.
Price has printed as per previous intraday expectation by printing a bearish CHoCH which indicates, but not confirms, bullish pullback phase initiation.
Price is currently trading within an established internal range, however, I will continue to monitor price with regards to depth of pullback.
Intraday expectation:
Price to continue bearish, react at either discount of 50% internal EQ, or H4 supply zone before targeting weak internal high priced at 4,380. 990.
Note:
The Federal Reserve’s sustained dovish stance, coupled with ongoing geopolitical uncertainties, is likely to prolong heightened volatility in the gold market. Given this elevated risk environment, traders should exercise caution and recalibrate risk management strategies to navigate potential price fluctuations effectively.
Additionally, gold pricing remains sensitive to broader macroeconomic developments, including policy decisions under President Trump. Shifts in geopolitical strategy and economic directives could further amplify uncertainty, contributing to market repricing dynamics.
H4 Chart:
M15 Analysis:
-> Swing: Bullish.
-> Internal: Bearish.
Price printed according to my analysis dated 22 October 2025 where I mentioned price to react at either premium of 50% internal EQ, or M15 demand zone, before targeting weak internal low priced at 4,004.280.
Price has printed a bullish CHoCH, however, depth of pullback was insignificant.
Price is now trading within an internal high and fractal low. CHoCH positioning is denoted with a blue horizontal dotted line.
Intraday expectation:
Await for price to print bullish CHoCH to indicate bullish pullback phase.
Note:
Gold remains highly volatile amid the Federal Reserve's continued dovish stance, persistent and escalating geopolitical uncertainties. Traders should implement robust risk management strategies and remain vigilant, as price swings may become more pronounced in this elevated volatility environment.
Additionally, President Trump’s tariff announcements, particularly against China, are expected to further amplify market turbulence, potentially triggering sharp price fluctuations and whipsaws.
M15 Chart:

Gold: Technicals vs. Fundamentals as Prices DipGold is currently facing significant downward pressure, recently touching its lowest point since early October and dipping below the $4,000 mark. This bearish sentiment is largely fueled by two key factors: cautious remarks from Federal Reserve Chairman Jerome Powell regarding policy easing, and a noticeable de-escalation in the ongoing trade tensions between the United States and China.
As traders, we're now watching for the next catalyst. Upcoming macroeconomic data from the US, coupled with further commentary from Fed officials, will be critical in shaping Gold's near-term valuation.
The December Rate Cut: Not a Done Deal
While the market has been pricing in potential rate cuts, it's important to remember that a cut in December is not yet a certainty. This ambiguity is keeping buyers on the sidelines and adding to the metal's weakness.
A Look at the Charts (Technical View)
From a technical perspective, Gold is at a critical juncture. The key breakout level to watch is the $4050 - $4060 area.
The Bullish Case: If Gold can decisively break above this $4050/$4060 resistance, it would open the door for a test of the next significant level, around $4150 / $4160.
The Bearish Case: However, until Gold can firmly establish itself and stabilize above the $4150/$4160 zone, the risk of a deeper correction remains very high till $3700
We are observing a recurring pattern: Gold is repeatedly failing at immediate trendline resistance levels. In technical trading, this is often a classic sign that the market is weak and may be poised for a further decline, assuming there are no major fundamental surprises.
Trading Strategy: Patience is Key
For those of us looking to enter long-term buy positions, a two-pronged approach is necessary:
Fundamental Watch: Keep a close eye on fundamental developments. Specifically, any new updates regarding US-China tariffs or shifts in the Federal Reserve's tone on interest rates will be major market movers.
Technical Confirmation: Patience is required. We must wait for a confirmed technical breakout above the $4150 / $4160 area. Until this happens, the bearish pressure is likely to continue. Otherwise, gold still have bigger chances to test $3700 before it rise again.

XAUUSD – Gold Eyes a Breakout Above $4,030: Momentum Still Build🟢 XAUUSD | Gold Breakout Setup – Educational Analysis
Gold continues to show constructive price action following sustained bullish momentum across intraday timeframes. After a healthy consolidation phase, the market is now testing a critical resistance zone around $4,030.
A clean breakout and confirmed 1H close above $4,030 would signal renewed strength, aligning with the broader bullish structure observed on higher timeframes (4H & Daily).
🔹 Technical Outlook
The current structure suggests the potential for continuation toward higher liquidity zones if the breakout holds.
Sustained trading above $4,030 would confirm buyer control, invalidating the short-term correction phase.
📈 Trade Plan (Educational Setup)
Entry (Buy Stop): $4,030
Stop Loss (SL): $4,000
Take Profit Targets (TP):
TP1 → $4,060
TP2 → $4,090
TP3 → $4,120
TP4 → $4,150
TP5 → $4,180
TP6 → $4,210
💡 Analyst’s Commentary
This setup aims to capture the potential breakout continuation, with risk contained below the $4,000 psychological support.
Momentum confirmation on H1 and H4 closes will be key for trade validation.
Traders may consider partial profit-taking along the way and trailing stops to secure gains.
⚖️ Risk/Reward: ≈ 1 : 3.5
🕓 Timeframe: H1 – Short-Term Swing
⚠️ Disclaimer:
This analysis is shared for educational and research purposes only as part of Middle East Trading Academy’s ongoing market study.
It does not constitute financial advice or an investment recommendation.

Gold Trade IdeaGold is testing back 4000. 2 additional resistances also share the 4000 so it will be a strong intraday resistance. The idea came with 3.14 RR.

Bearish Continuation Setup with Defined Risk/RewardKey Observations and Trading Setup
Price Action Context: The price recently made a high around $4,045 and appears to be consolidating or forming a lower high after a previous upward move.
Identified Setup: A bearish (sell) trade setup is clearly marked on the chart.
The Entry Price appears to be around $4,009.24 (the current price shown on the OHLC data).
The Stop Loss (the maximum acceptable loss level) is placed at $4,030.62, just above a recent swing high, indicating the point where the bearish bias would be invalidated.
The Target (Take Profit) is set at $3,980.22, indicating the desired level to exit the trade for a profit.
Visual Representation:
The red box highlights the area of risk (above the entry up to the stop loss).
The green box highlights the area of potential reward (below the entry down to the target).
The white arrow clearly illustrates the expected downward price movement.

XAUUSDhi everyone,..
here i just share my idea
remember, this is not a signal
be smart
if i see xauusd with this pattern,
i love to make a speculation LONG/ BUY
TF H1 stochastic =>> look like have a divergent
and TF H1, if break resistance ... have a brd wedge pattern.

XAU/USD – 1H Supply Zone Reaction | Possible Short SetupAfter a clean pullback from the recent low near $3,860, Gold is now approaching an important 1H supply zone (around $4,050).
The overall structure still remains bearish, with lower highs and lower lows dominating the chart.
🔍 Technical Outlook
Price approaching previous structure zone (potential supply).
Market structure: Bearish on both 1H and 4H.
Rejection from $4,050–$4,060 could trigger a short move back to $3,900–$3,860.
Setup invalid if 1H closes above $4,060.
💰 Trade Plan (Example)
Entry: 4,030–4,050
Stop Loss: Above 4,060
Take Profit: 3,900 → 3,860
🧠 Bias: Bearish
🎯 Watching for rejection confirmation from $4,050 zone before short entries.
#XAUUSD #Gold #Forex #TradingView #TechnicalAnalysis #PriceAction #SmartMoneyConcepts #Scalping #FXTrading #GoldAnalysis

Chart Analysis (XAUUSD-15 M)🟢 Chart Analysis (XAU/USD – 15M)
Current Price: $3,964
Resistance Zone: $3,980 – $3,983
Support Zone: $3,950 – $3,951
Major Support: $3,910
📊 Technical Outlook:
Price Action:
Gold has rebounded strongly from the $3,910 zone, forming higher lows — a sign of short-term bullish momentum.
Structure:
The chart shows a range-bound pattern between $3,950 and $3,983.
A breakout above $3,983 could trigger a bullish continuation, while rejection here could push the price back toward $3,950 or even $3,910.
RSI Indicator (53.47):
RSI is currently neutral but trending upward — indicating mild bullish strength.
A move above 60 would confirm momentum toward $3,983.
Volume:
Recent candles show increasing volume on bullish moves, suggesting buying pressure is returning.
🎯 Trade Idea (1:1 Risk–Reward Example)
Scenario 1 – Buy Setup:
Entry: Above $3,966
Take Profit (TP): $3,978
Stop Loss (SL): $3,954
Bias: Bullish above $3,960
Scenario 2 – Sell Setup:
Entry: Below $3,950
Take Profit (TP): $3,938
Stop Loss (SL): $3,962
Bias: Bearish below $3,950
🧭 Summary:
Gold is consolidating within a tight range.
➡️ A break above $3,983 will likely open room for upside momentum.
➡️ A drop below $3,950 can shift bias back to bearish, targeting $3,910.
Overall Bias: Neutral to bullish (as long as price holds above $3,950).

xauusd 1h🔹 Overall Outlook and Potential Price Movements
In the charts above, we have outlined the overall outlook and possible price movement paths.
As shown, each analysis highlights a key support or resistance zone near the current market price. The market’s reaction to these zones — whether a breakout or rejection — will likely determine the next direction of the price toward the specified levels.
⚠️ Important Note:
The purpose of these trading perspectives is to identify key upcoming price levels and assess potential market reactions. The provided analyses are not trading signals in any way.
✅ Recommendation for Use:
To make effective use of these analyses, it is advised to manually draw the marked zones on your chart. Then, on the 5-minute time frame, monitor the candlestick behavior and look for valid entry triggers before making any trading decisions.
